

The Micron P420m is an enterprise application accelerator that ranges up to 1.4TB in total capacity that leverages the PCIe interface and is uniquely offered in both a half-height, half-length (HHHL) and 2.5" form factors. Micron has opted for 25nm MLC NAND for the P420m to meet not only mainstream market requirements for performance and reliability, but also to provide a more cost-effective and higher capacity offering than their P320h which is paired with SLC NAND. The other core difference between the P420m and the P320h is that Micron has added capacitors to protect in-flight data in the event of an unplanned loss of power. The additional data protection feature keeps the card powered long enough to flush all writes to the NAND, giving enterprises one more layer of data protection. The HHHL card interfaces via PCIe Gen2 x8 to achieve sequential read performance up to 3.3GB/s with writes up to 630MB/s and random reads up to 750,000 IOPS and 95,000 IOPS for write activity. The 2.5" interfaces over PCIe Gen2 x4 for up to 1.8GB/s and 430,000 IOPS, respectively.
At its core, the Micron P420m features the same custom Micron/IDT ASIC controller as its sibling the Micron P320h PCIe and the same RAIN architecture (redundant array of independent NAND). RAIN provides device-integrated algorithms that use RAID5 across flash channels, enabling Micron to deliver greater performance, reliability and data integrity. RAIN also guarantees continuous drive operation even after a channel failure by kicking off an automatic background rebuild when a failure is detected. RAIN is entirely automated and runs entirely in the background without degrading system-level performance.
The application accelerator market at large offers a wide scope of options in terms of capacity and performance, but one feature that can be overlooked is power consumption. Some solutions draw so much power and expel so much energy that in-host cooling is a serious concern. The P420m on the other hand is well within the PCIe spec and is rated at just 8W in standby (7W on the 350GB 2.5"), with active power ranging up to 30W depending on capacity, form factor and performance tuning options. The 2.5" form factor is rated at 14W for 350GB and 22W for 700GB. The HHHL form factor is rated at 22W for 700GB, while the 1.4TB model is quoted at 25W with power throttling turned on and 30W without its activation.
As noted, the Micron P420m is available in both HHHL and 2.5" PCIe form factors. The 2.5" PCIe form factor continues to be unique to Micron, though others have shown demos of the technology. Dell has created a backplane for their 12G PowerEdge servers for the drives that allows them to be mounted in groups of four in traditional front-facing drive bays. Of course being able to access the drives via front of server without having to power down the system and remove the lid to service the drive is seen as a substantial benefit by some. It also helps that Micron's 2.5" PCIe drives are by far the fastest storage available in that drive size, as seen in our 2.5" P320h review.
The 2.5" ships in 350GB and 700GB capacities, while the HHHL is available in the 700GB and upper-echelon 1.4TB capacities. The HHHL cards provide endurance of 5 PBW (700GB) and 10 PBW (1.4TB). Our review units are four 1.4TB capacity cards.
Micron P420m Enterprise PCIe SSD Specifications
- Capacities
- 700GB (MTFDGAR700MAX-1AG1Z)
- Sequential Read: 3.3GB/s (128KB, steady state)
- Sequential Write: 600MB/s (128KB, steady state)
- Random Read: 750,000 IOPS (4KB, steady state)
- Random Write: 50,000 IOPS (4KB, steady state)
- 1.4TB (MTFDGAR1T4MAX-1AG1Z)
- Sequential Read: 3.3GB/s (128KB, steady state)
- Sequential Write: 630MB/s (128KB, steady state)
- Random Read: 750,000 IOPS (4KB, steady state)
- Random Write: 95,000 IOPS (4KB, steady state)
- 700GB (MTFDGAR700MAX-1AG1Z)
- Ready Latency: <100µs
- Write Latency: <13µs
- Interface: PCIe Gen2 x8
- Power: 30W maximum, 8 idle
- Form Factor: HHHL
- Dimensions: 68.90mm x 167.65mm x 18.71mm
- Operating Temp: 0°C to +50°C
- Reliability and Endurance
- Uncorrectable bit error rate (UBER): <1 sector per 1017 bits read
- MTTF: 2 million hours
- PBW: 5 (700GB), 10 (1.4TB)
- OS Compatibility
- Microsoft: Windows Server 2008 R2 SP1 (x86-64), Windows Server 2008 R2 SP1 Hyper-V (x86-64), Windows Server 2012 (x86-64) SP128, Windows 7 (x86-64)
- Linux: RHEL Linux 5.5, 5.6, 5.7, 5.8, 6.1, 6.2, 6.3 (x86-64), SLES Linux 11 SP1 and SP2 (x86-64)
- VMware 5.0, 5.1 (x86-64)
- Open source GPL (Kernel Rev. 2.6.25+)
Design and Build
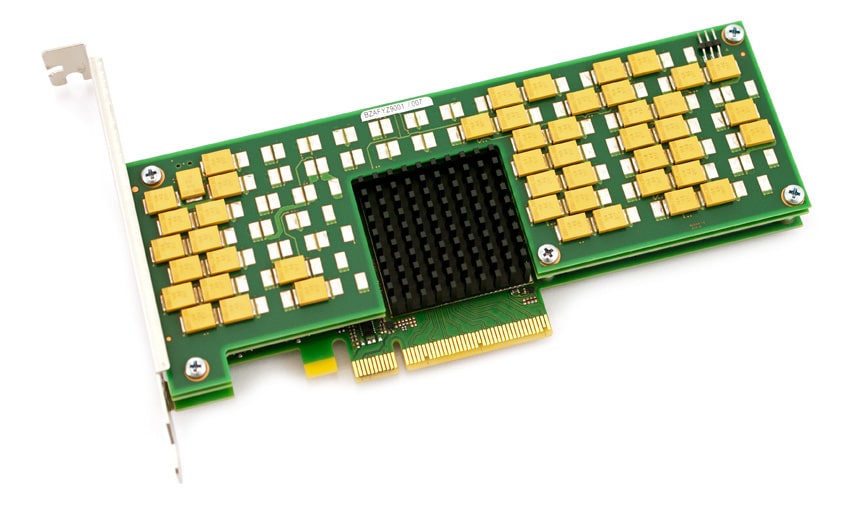
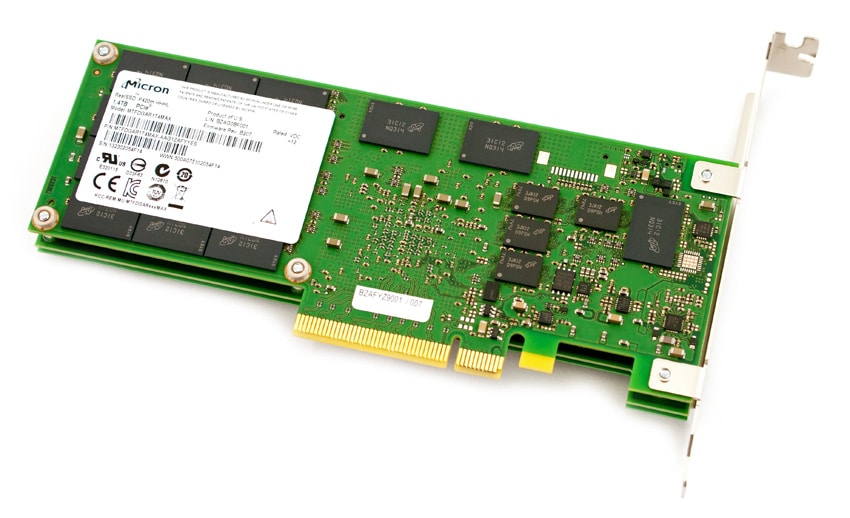
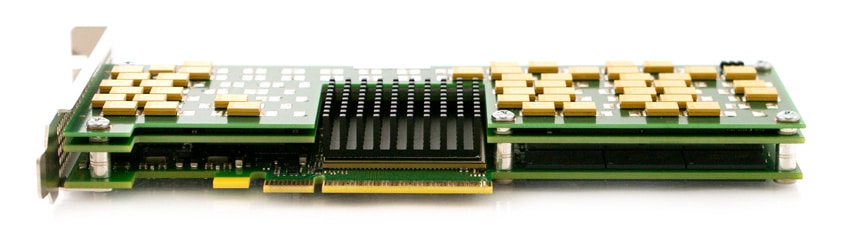
The Micron P420m is a half-height, half-length x8 PCIe application accelerator that features a single controller mounted onto the mainboard, with daughter boards attached to house more MLC NAND and power-fail capacitors. As with its top of the line, SLC NAND-based P320h sibling, the P420m follows the universal HHHL spec, enabling installations for just about any open server PCIe slot.
The power-fail capacitors are new to the Micron P420m to help ensure data integrity in the event that power is lost, as Micron enabled write-back caching leveraging DRAM on the P420m. The P320h had its default configuration set to write-through, although users could (at their own discretion) enable write-back caching for increased performance. Since the default conditions changed to help drive greater performance from the new MLC platform, Micron opted to ensure reliable performance regardless of the conditions of the installed environment.
The top of the card features an adhesive black plate with Micron P420m branding. This plate also serves to protect the top layer daughter board with its power-fail capacitors, as well as the controller's heat sink. That controller is a Micron/IDT ASIC controller that was also found on the Micron P320h. As for NAND, Micron includes 64 of their own Micron 31C12NQ314 25nm MLC NAND packages. That comes out to 2048GB or raw capacity, which is then over-provisioned down to 1.4TB available.
Testing Background and Comparables
The Micron P420m Enterprise PCIe SSD uses a Micron/IDT ASIC controller and Micron MLC NAND with a PCIe 2.0 x8 interface.
Comparables for this review:
- Fusion-io ioDrive2 (1.2TB, 1 x Xilinx Virtex-6 FPGA controllers, MLC NAND, PCIe 2.0 x4)
- Huawei Tecal ES3000 (1.2TB, 3 x Proprietary FPGA controllers, MLC NAND, PCIe 2.0 x8)
- Intel SSD 910 (800GB, 4 x Intel EW29AA31AA1, MLC NAND, PCIe 2.0 x 8)
- LSI Nytro WarpDrive BLP4-400 (400GB, 4 x SandForce SF-2500 controller, Toshiba eMLC NAND, PCIe 2.0 x8)
- Micron P320h (700GB, IDT Controller, SLC NAND, PCIe 2.0 x8)
- Virident FlashMAX II (2.2TB, 2 x Proprietary FPGA controllers, eMLC NAND, PCIe 2.0 x8)
All PCIe Application Accelerators are benchmarked on our second-generation enterprise testing platform based on a Lenovo ThinkServer RD630. For synthetic benchmarks, we utilize FIO version 2.0.10 for Linux and version 2.0.12.2 for Windows. In our synthetic testing environment, we use a mainstream server configuration with a clock speed of 2.0GHz, although server configurations with more powerful processors could yield even greater performance.
- 2 x Intel Xeon E5-2620 (2.0GHz, 15MB Cache, 6-cores)
- Intel C602 Chipset
- Memory – 16GB (2 x 8GB) 1333Mhz DDR3 Registered RDIMMs
- Windows Server 2008 R2 SP1 64-bit, Windows Server 2012 Standard, CentOS 6.3 64-Bit
- 100GB Micron P400e Boot SSD
- LSI 9211-4i SAS/SATA 6.0Gb/s HBA (For boot SSDs)
- LSI 9207-8i SAS/SATA 6.0Gb/s HBA (For benchmarking SSDs or HDDs)
It's worth noting that the comparables we've selected are largely MLC-based drives, with the exception of the SLC Micron PCIe drive. That said, not all PCIe drives are created equally both in terms of performance targets and price. Specific applications require specific storage needs, thus we've opted to standardize the comps on NAND type rather than number of controllers, etc.
Application Performance Analysis
In the enterprise market there is a huge difference between how products claim to perform on paper and how they perform in a live production environment. We understand the importance of evaluating storage as a component of larger systems, most importantly how responsive storage is when interacting with key enterprise applications. To this end, we've rolled out application tests including our proprietary MarkLogic NoSQL Database Storage Benchmark and MySQL performance via SysBench.
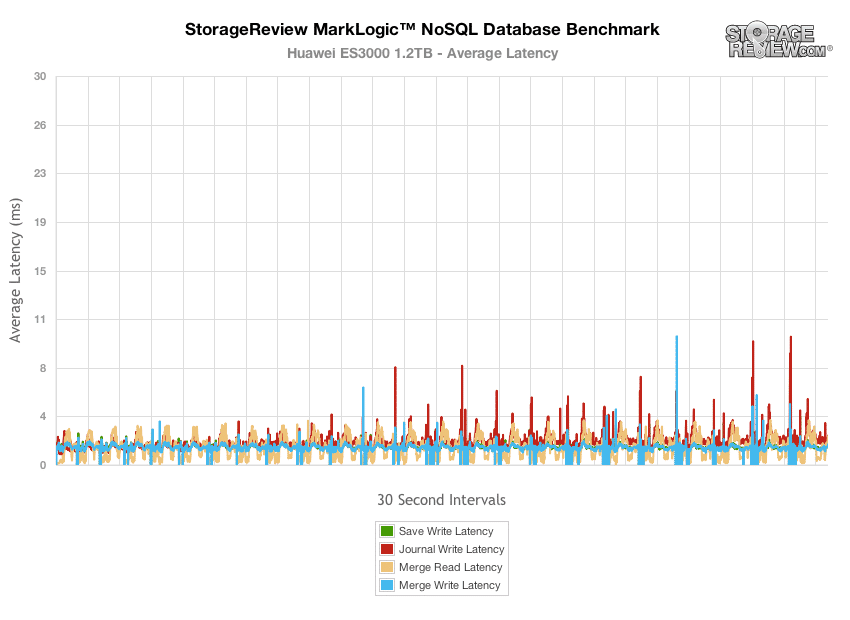
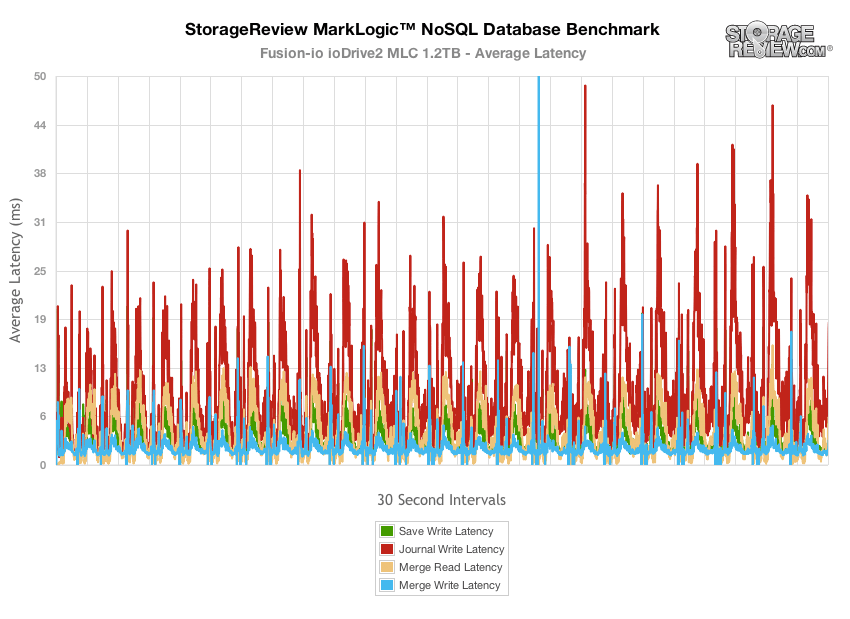
In the MarkLogic NoSQL Database environment, we test single PCIe Application Accelerators with a usable capacity greater than or equal to 700GB. Our NoSQL database requires roughly 650GB of free space to work with, evenly divided between four database nodes. In our testing environment, we use an SCST host and present each SSD in JBOD (while some PCIe SSDs leverage software RAID0), with one device or partition allocated per database node. The test repeats itself over 24 intervals, requiring between 30-36 hours total for the SSDs in this category. Measuring the internal latencies seen by the MarkLogic software, we record both total average latency, as well as interval latency for each SSD.
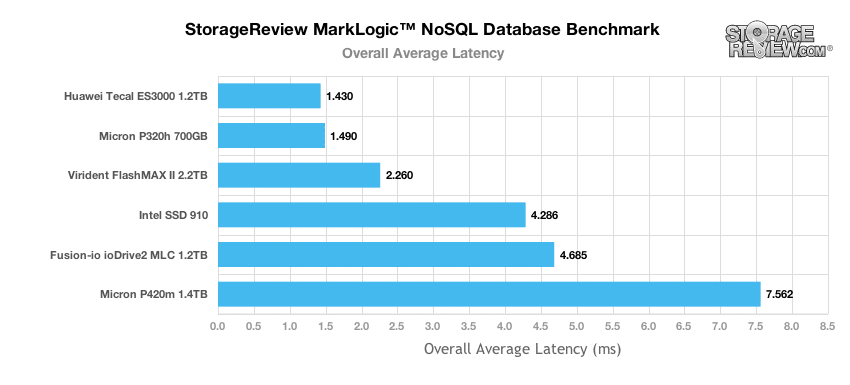
The Huawei ES3000 1.2TB HP offered the best latency in the group, with peak average interval latency measuring between 3.5-9.9ms.
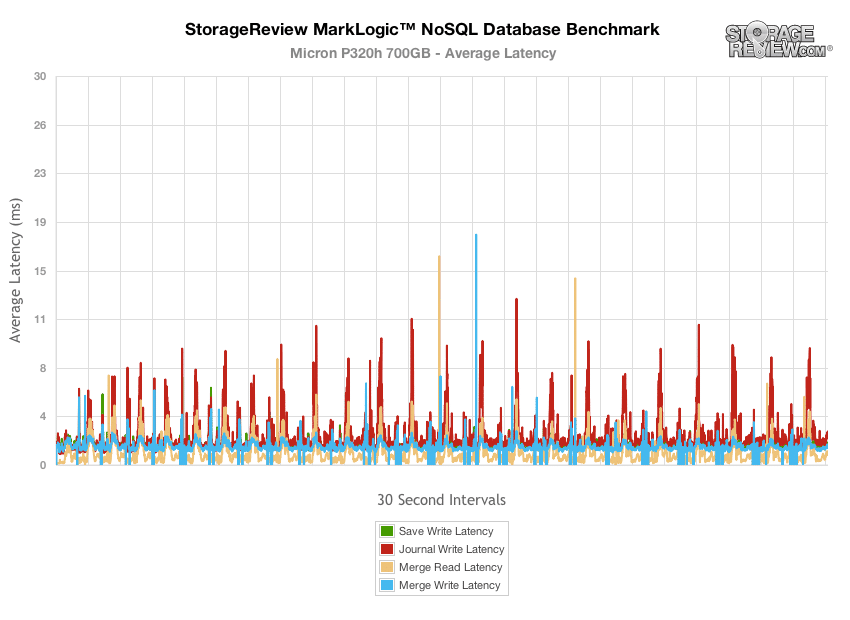
The SLC-based Micron P320h 700GB came in next in the group, with peaks measuring between 12-17.7ms.
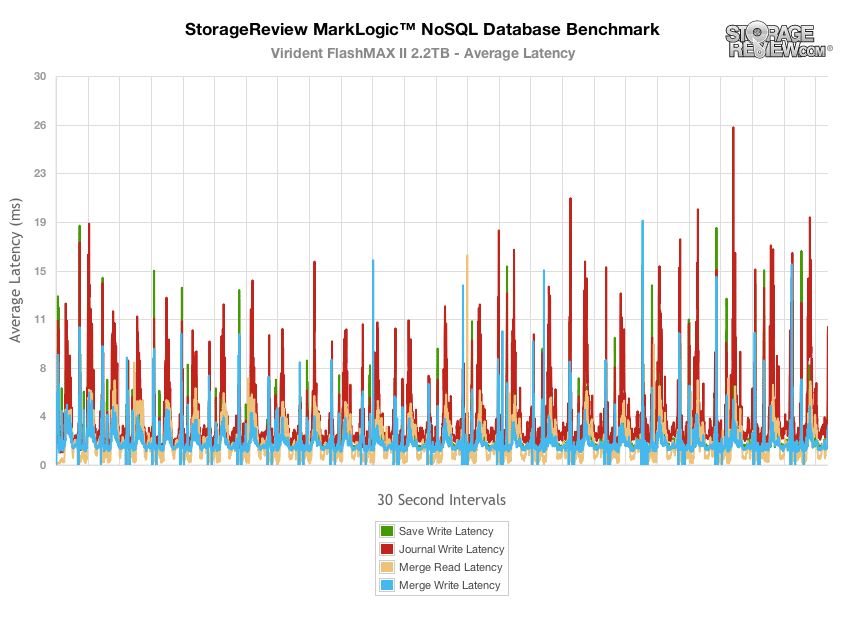
The Virident FlashMAX II 2.2TB HP slotted itself in the middle of our MLC-based PCIe SSD pack, with average latency peaks measuring between 16-26ms.
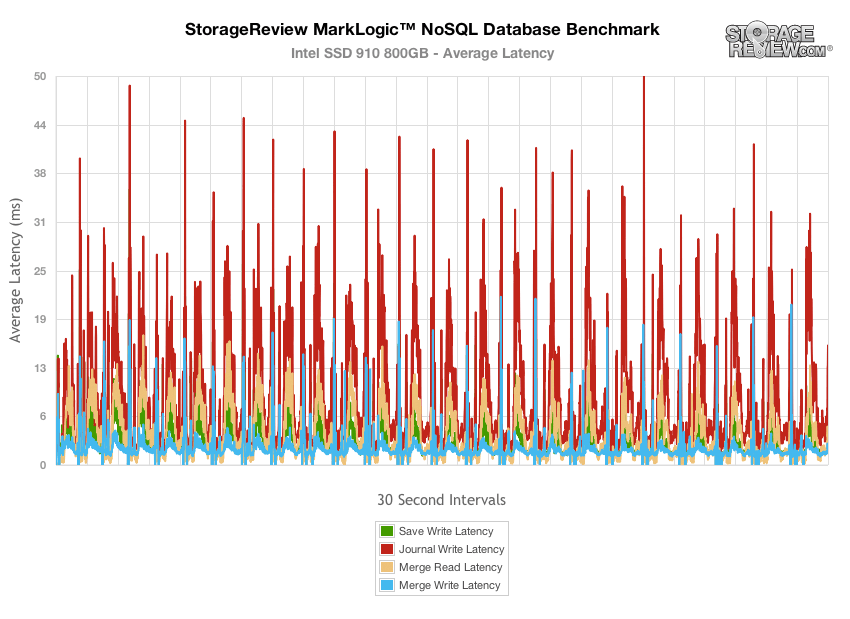
The Intel SSD 910 jumped in overall average latency compared to the Virident FlashMAX II 2.2TB, with peaks ranging from 6-50ms.
The Fusion-io ioDrive2 also trailed the multi-controller PCIe Application Accelerators with peaks also ranging in the 6-50ms range.
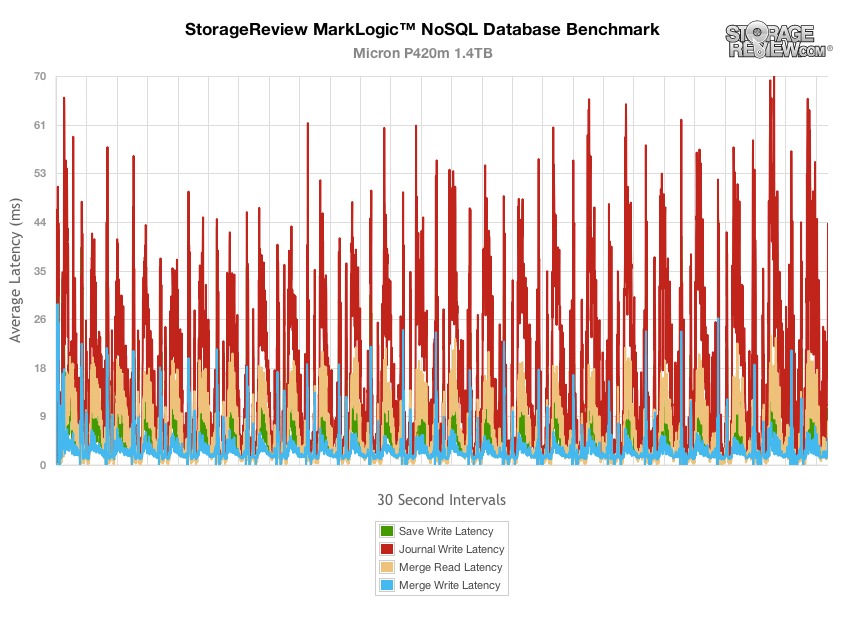
The Micron P420m came in towards the bottom of the group in our MarkLogic NoSQL database test, with peaks measuring between 25-74ms.
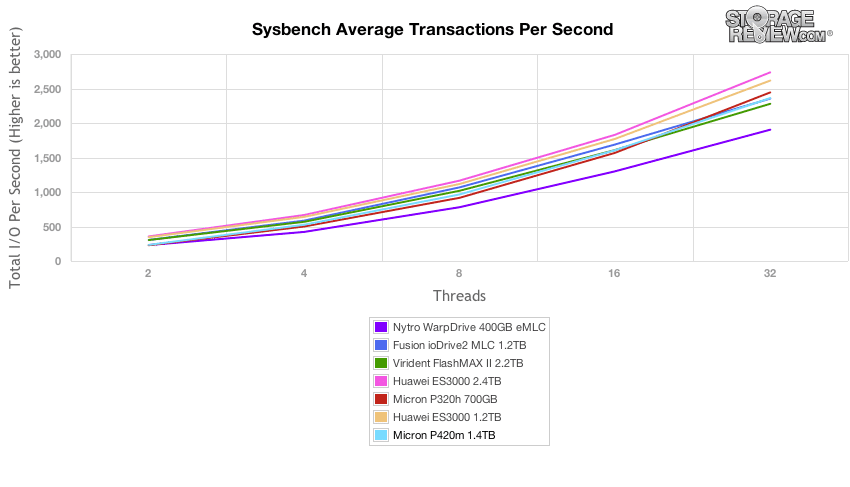
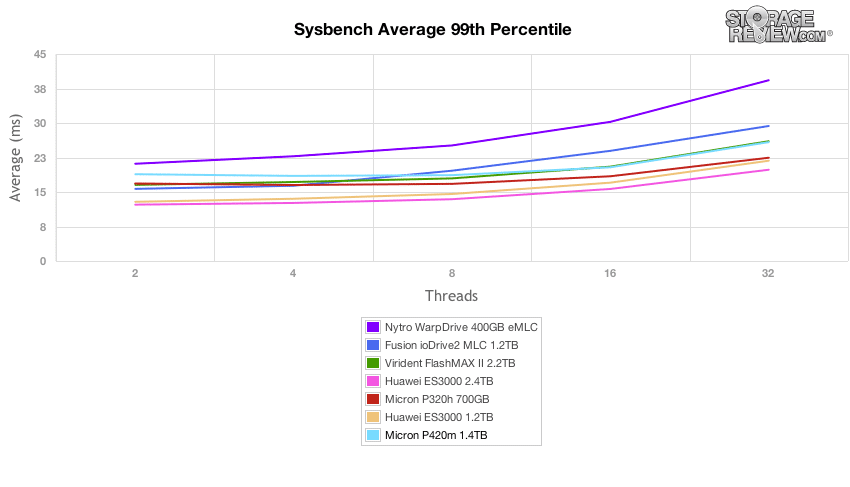
Our next application test consists of Percona MySQL database test via SysBench, which measures the performance of OLTP activity. In this testing configuration, we use a group of Lenovo ThinkServer RD630s and load a database environment onto a single SATA, SAS or PCIe drive. This test measures average TPS (Transactions Per Second), average latency, as well as average 99th percentile latency over a range of 2 to 32 threads. Percona and MariaDB are using the Fusion-io flash-aware application APIs in the most recent releases of their databases, although for the purposes of this comparison we test each device in their "legacy" block-storage modes.
In our SysBench test, the Micron P420m Enterprise PCIe SSD performed towards the upper middle of the pack measuring 2,361TPS at 32-threads, slightly edging out the Fusion ioDrive2 MLC, and coming in ahead of the Virident FlashMAX II as well as the LSI Nytro WarpDrive.
With its strong transactional performance, the Micron P420m offered average latency which scaled from 8.55ms at 2-threads up to 13.55ms at 32-threads.
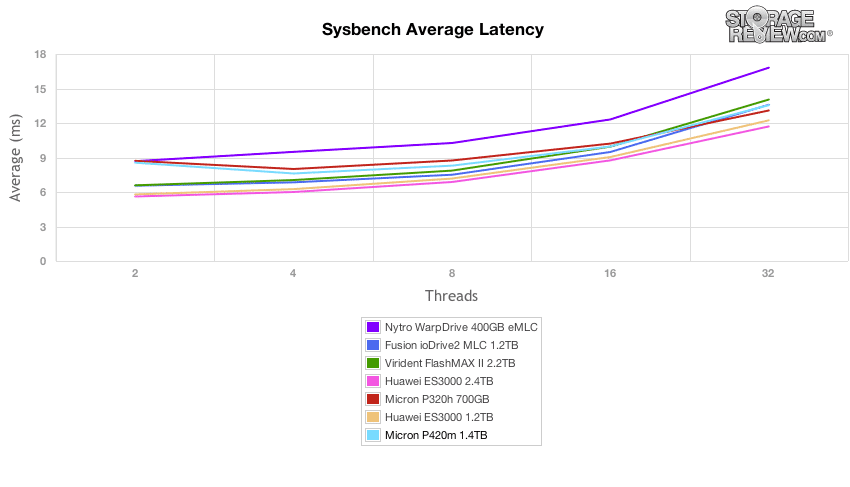
While average TPS or latency is important, another valuable consideration is 99th percentile latency showing what worst-case performance is over the course of the test. The Micron P420m ranked middle of the pack, ranging from 18.8ms to 25.8ms.
Enterprise Synthetic Workload Analysis
Our synthetic enterprise storage benchmark process begins with an analysis of the way the drive performs during a thorough preconditioning phase. Each of the comparable drives are secure erased using the vendor's tools, preconditioned into steady-state with the same workload the device will be tested with under a heavy load of 16 threads with an outstanding queue of 16 per thread, and then tested in set intervals in multiple thread/queue depth profiles to show performance under light and heavy usage.
Preconditioning and Primary Steady-State Tests:
- Throughput (Read+Write IOPS Aggregate)
- Average Latency (Read+Write Latency Averaged Together)
- Max Latency (Peak Read or Write Latency)
- Latency Standard Deviation (Read+Write Standard Deviation Averaged Together)
Our Enterprise Synthetic Workload Analysis includes two profiles based on real-world tasks. These profiles have been developed to make it easier to compare to our past benchmarks as well as widely-published values such as max 4k read and write speed and 8k 70/30, which is commonly used for enterprise hardware.
- 4k
- 100% Read or 100% Write
- 100% 4k
- fio –filename=/dev/sdx –direct=1 –rw=randrw –refill_buffers –norandommap –randrepeat=0 –ioengine=libaio –bs=4k –rwmixread=100 –iodepth=16 –numjobs=16 –runtime=60 –group_reporting –name=4ktest
- 8k 70/30
- 70% Read, 30% Write
- 100% 8k
- fio –filename=/dev/sdx –direct=1 –rw=randrw –refill_buffers –norandommap –randrepeat=0 –ioengine=libaio –bs=8k –rwmixread=70 –iodepth=16 –numjobs=16 –runtime=60 –group_reporting –name=8k7030test
When measuring the performance of PCIe Application Accelerators, it is necessary to evaluate their performance in both Linux and Windows. We do this as some cards favor one OS over another, and an organization's deployment may greatly depend on achieving real-world results in a particular environment. As such, we've organized our results by OS; all Linux data and charts are shown first, followed by Windows results.
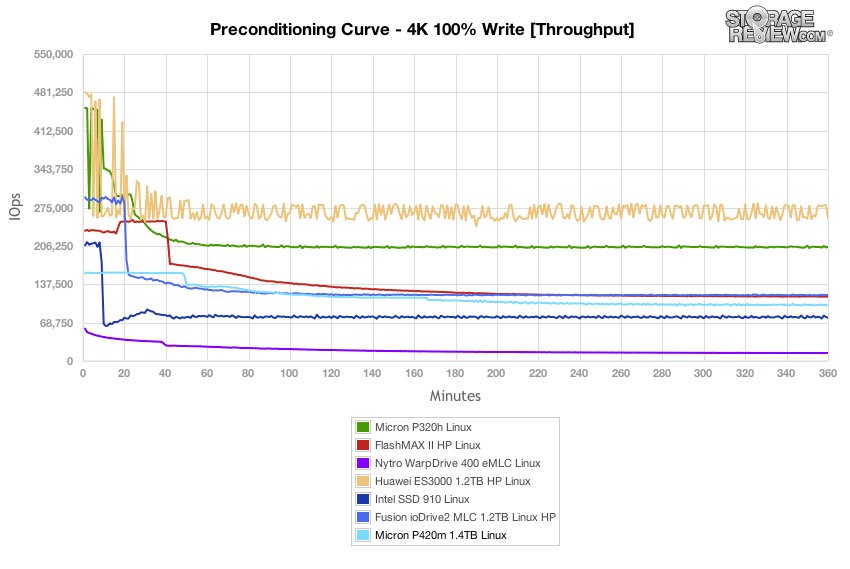
In our first test measuring the 4K random write performance from burst to steady state of the Micron P420m in CentOS 6.3, we saw throughput peak at about 158k IOPS, before tapering off to just below 100k IOPS. These speeds were favorable compared to the Intel SSD 910 and LSI Nytro WarpDrive, but came up short against the ioDrive2 MLC or the multi-controller MLC Application Accelerators such as the FlashMAX II or Huawei ES3000.
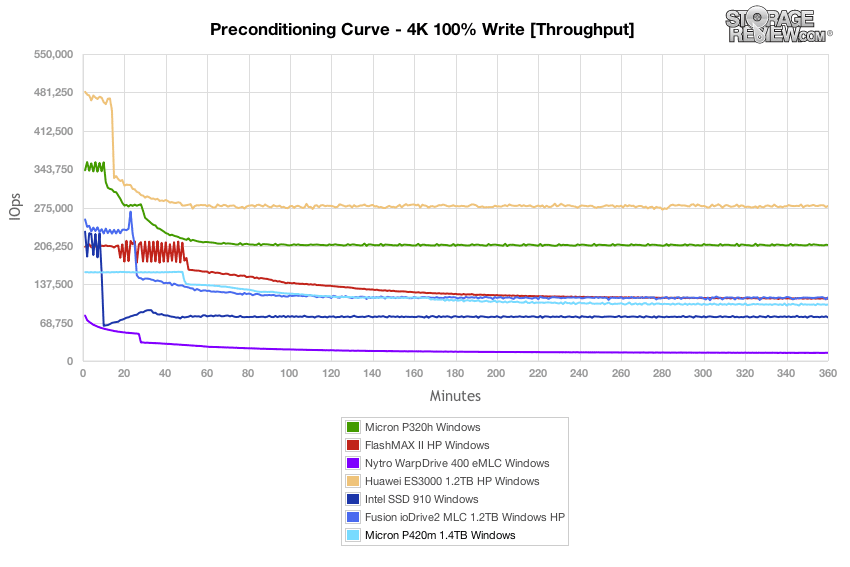
In our Windows Server 2008 R2 environment, performance was nearly identical to our Linux findings, measuring 159k IOPS burst to around 100k IOPS steady-state.
Switching our focus to average latency, the Micron P420m came out of the gate with a response time of about 1.6ms before increasing to about 2.5ms in steady-state.
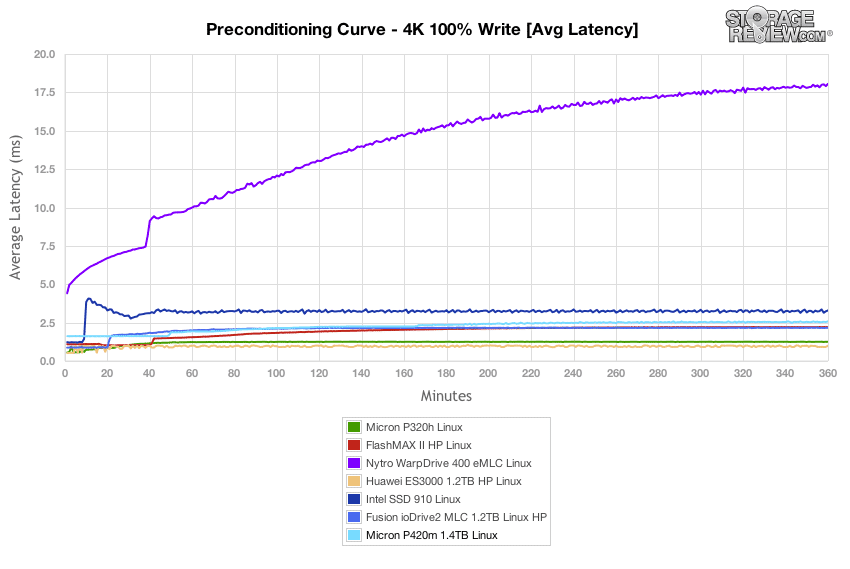
Similar to our random Linux findings in our 4K random write test, we measured average latency from 1.6ms in burst to 2.52ms as it neared steady-state.
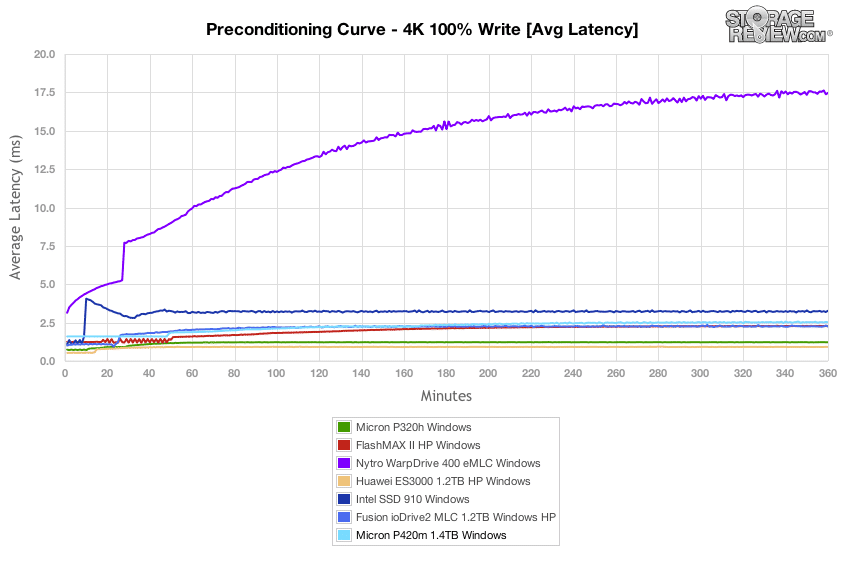
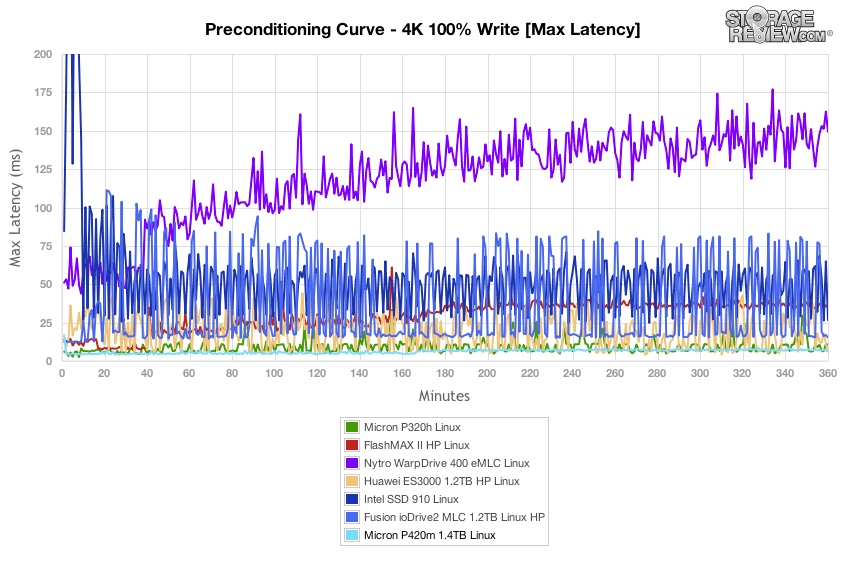
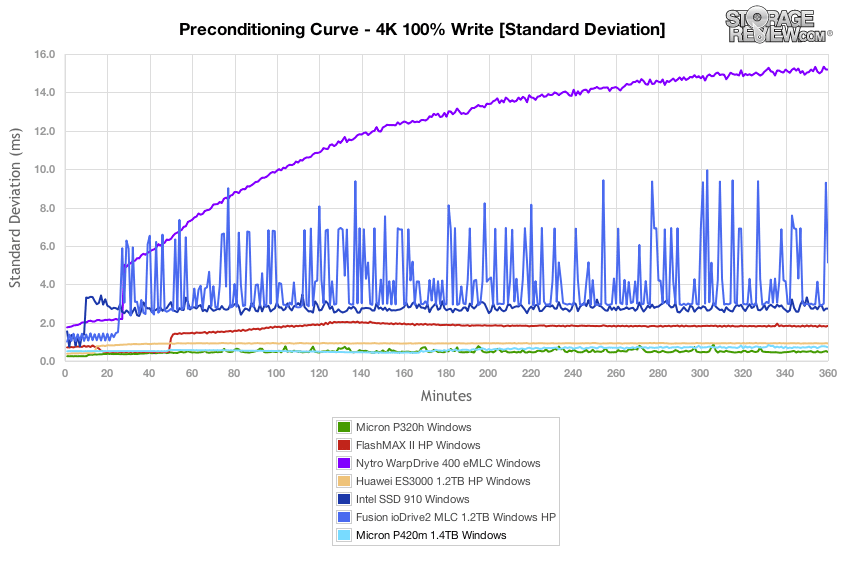
Throughout our preconditioning process, the Micron P420m remained very stable, keeping its peaks one of the lowest in the group measuring under 10ms over the majority of the test.
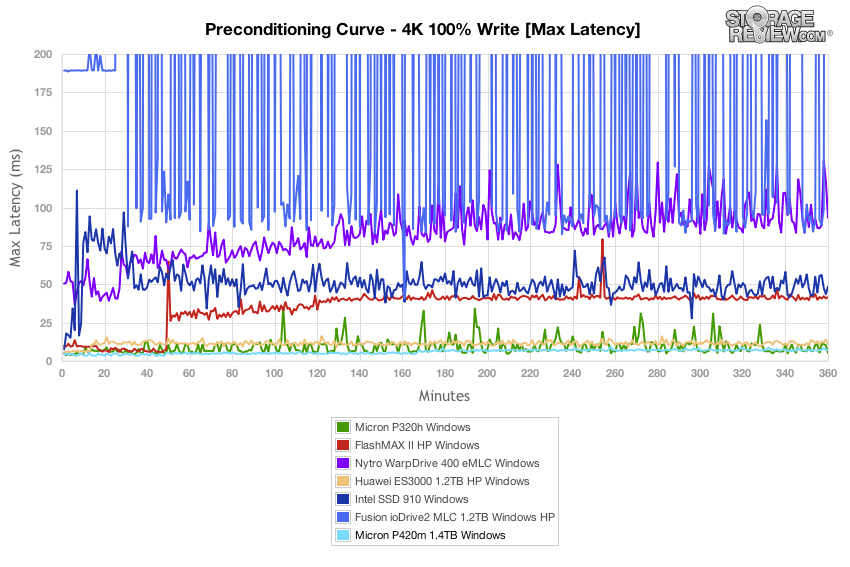
The Micron P420m performed exceptionally well in terms of peak response times in our 4K random write test in Windows Server, staying under 10ms for the duration of the test.
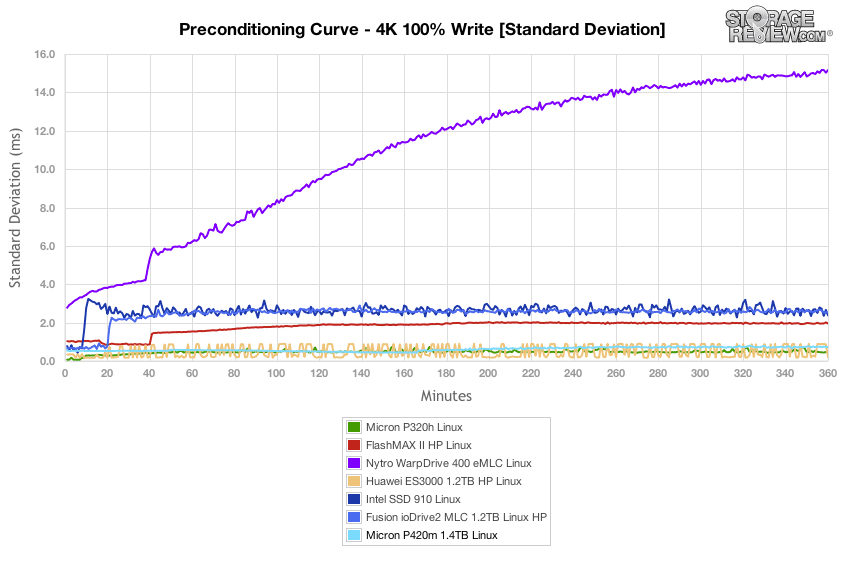
When it came to latency consistency in our 4K random write preconditioning test, the Micron P420m came in at near the top of the pack, being edged out by only the SLC-based P420h and Huawei ES3000.
Switching to our Windows Server environment, the Micron P420m came in at the top of the MLC pack and only coming in second to the SLC-based P320h in latency consistency.
After 6 hours of preconditioning, we noted exceptional read performance from the Micron P420m measuring 587k IOPS, which came in towards the top of the MLC pack. 4K random write performance measured 99k IOPS, which ranked lower in the ground, although still coming in front of the Intel SSD 910 and Nytro WarpDrive.
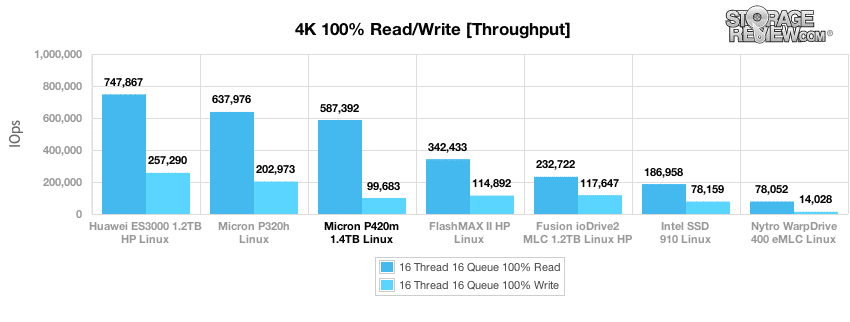
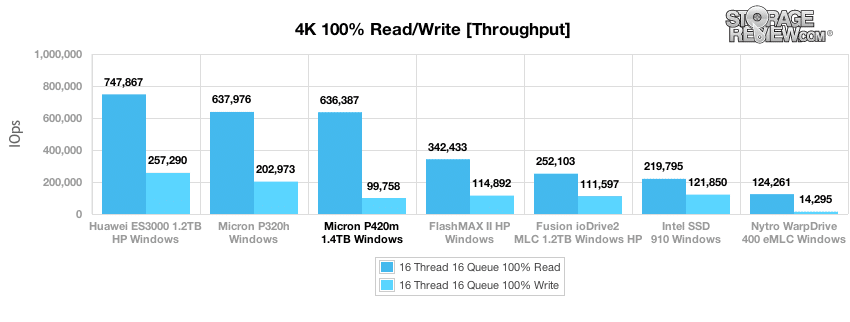
Compared to our Linux testing environment, the Micron P420m in Windows Server 2008 R2 offered a boost in performance, nearly matching the P320h. Write performance remaining the same, only improving by about 100 IOPS.
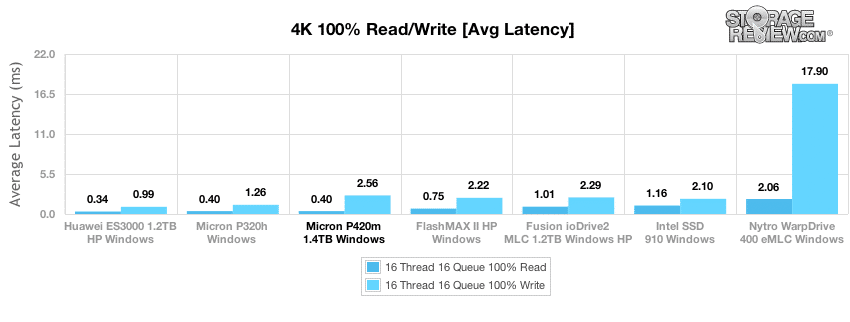
With a heavy load of 16T/16Q, we measured an average steady-state latency of 0.43ms in random read and 2.56ms in random write from the Micron P420m.
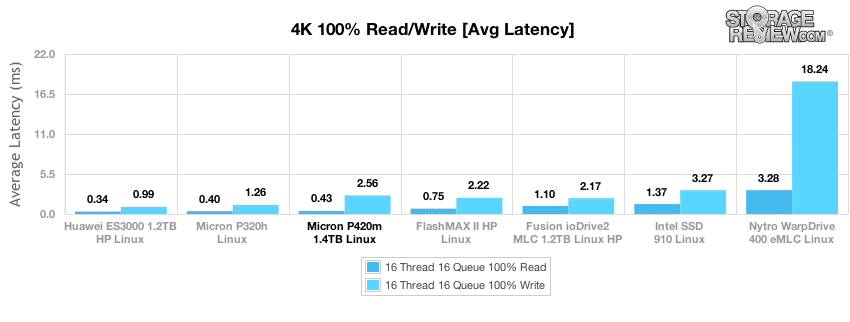
In our Windows testing environment, the Micron P420m offered slightly lower average read latency measuring 0.40ms, compared to 0.43ms in CentOS. Average write latency was on par with the Linux findings.
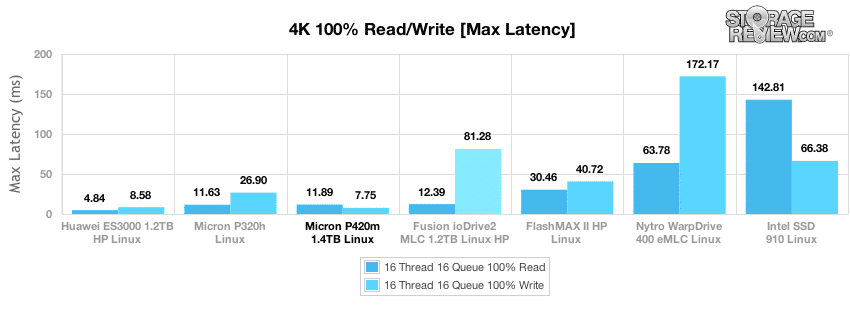
When it came to 4K random latency in Linux, the Micron P420m measured exceptionally low with 11.89ms read and 7.75ms write.
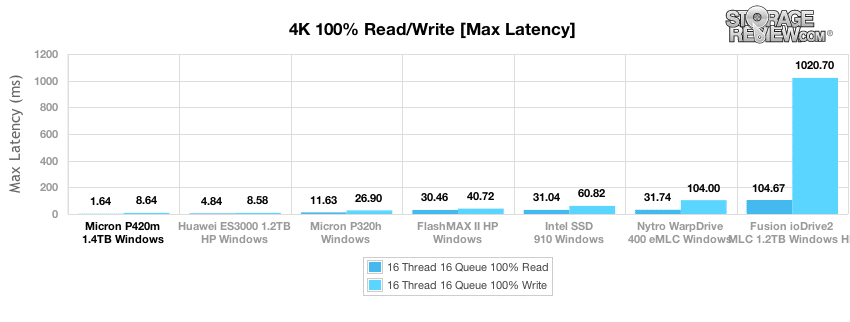
After reaching steady-state in Windows, the Micron P420m improved with its read response time, dropping to only 1.64ms. Peak write latency crept up slightly to just 8.64ms.
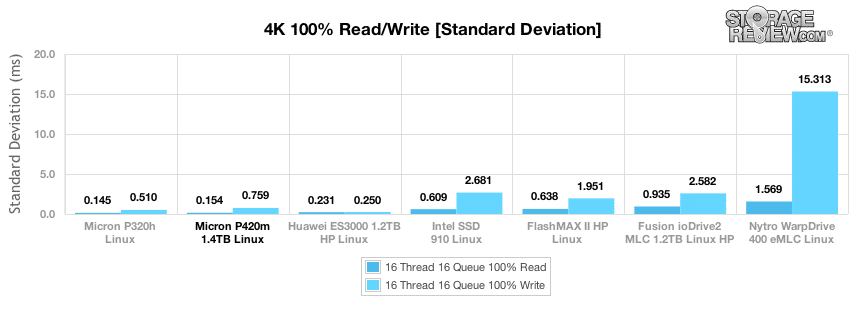
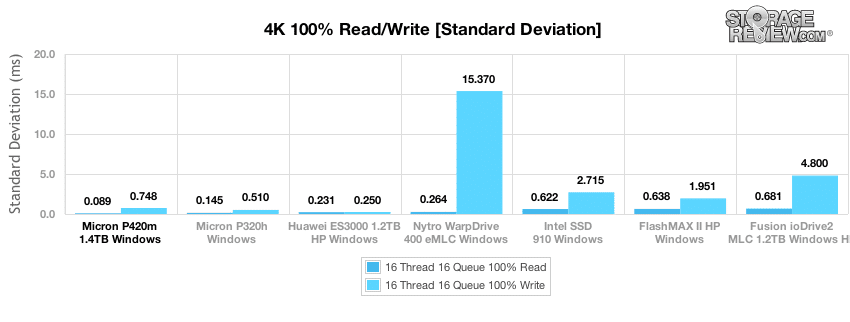
In terms of latency consistency in Linux, the Micron P420m offered the best read standard deviation in the MLC group and came in second in write standard deviation.
In our Windows Server environment, latency consistency of the P420m improved substantially, staying at the top of the pack. Write latency consistency also improved slightly, although the Huawei ES3000 came in on top.
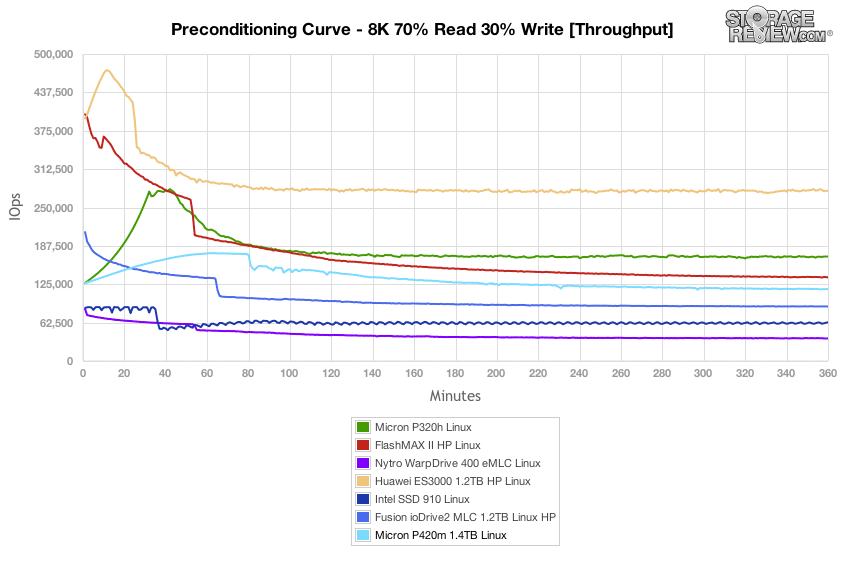
In our next workload, we look at a random 8k profile with a 70/30 read/write mixed ratio. In our Linux environment, the Micron P420m again came in towards the middle of the pack with performance scaling from 175k IOPS in burst to around 117k IOPS in steady-state.
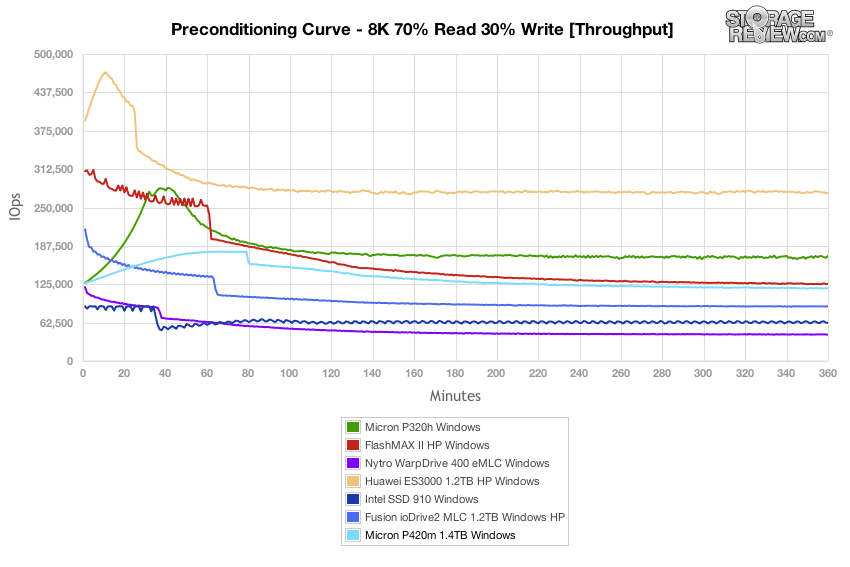
In our Windows Server environment the Micron P420m performed slightly higher in our 8k 70/30 workload, with throughput peaking at 178k IOPS and leveling off to 118k IOPS in steady-state.
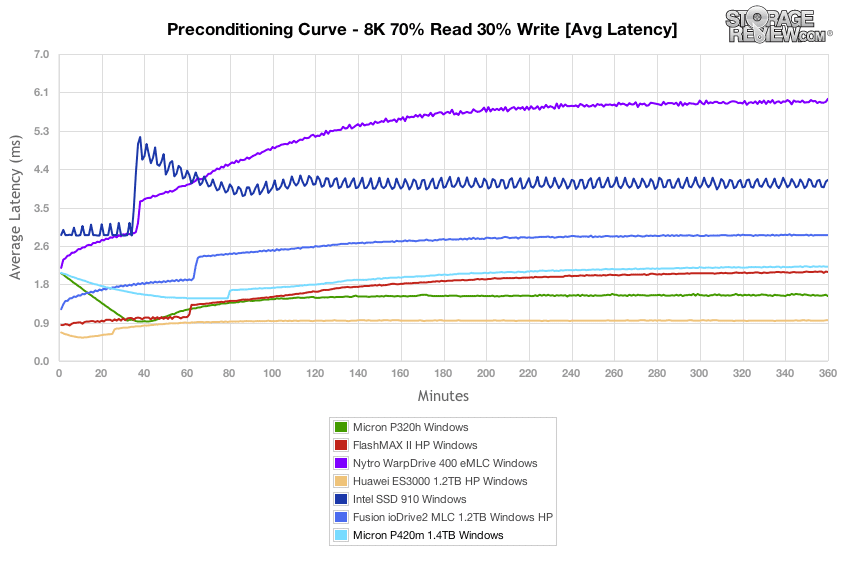
Average latency in our 8K 70/30 preconditioning workload from the Micron P420m in Linux ranged from 1.46ms in burst to about 2.2ms in steady-state.
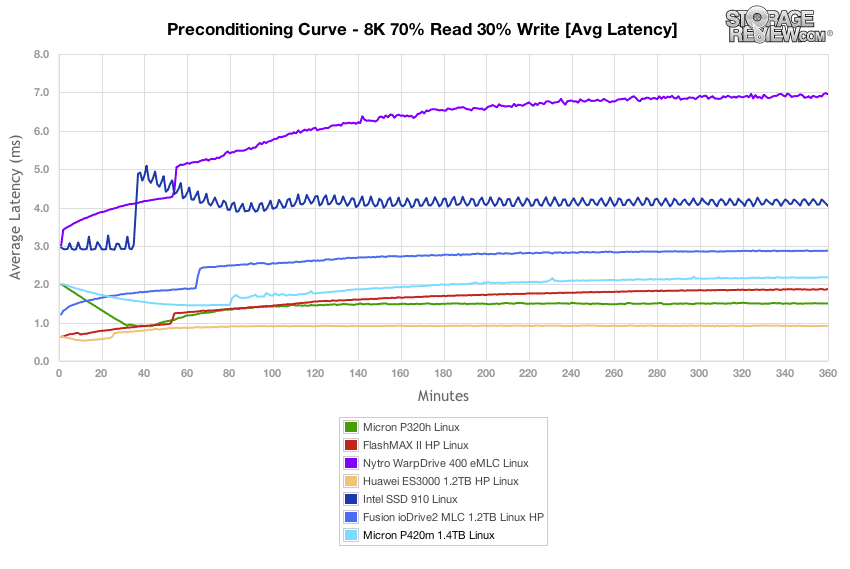
Switching to our Windows Server environment, we saw slightly lower average latency from the Micron P420m, ranging from 1.43ms in burst to 2.15ms in steady state.
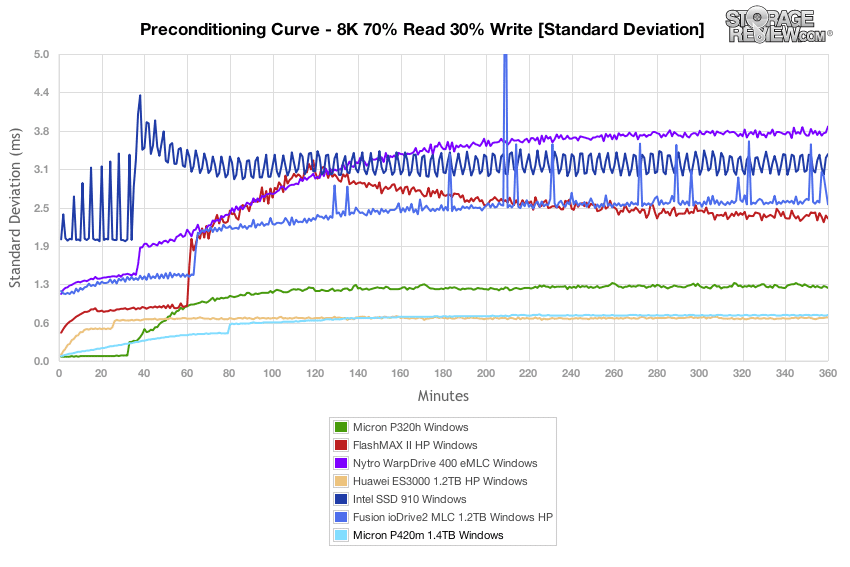
In a Linux environment with our 8k 70/30 workload, the Micron P420m measured around 10ms over the bulk of the test, with a handful of peaks about 140ms.
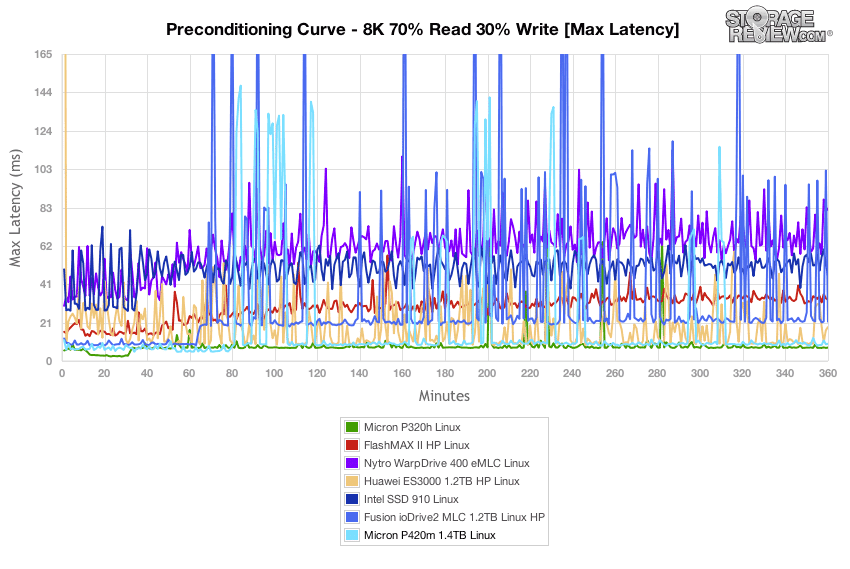
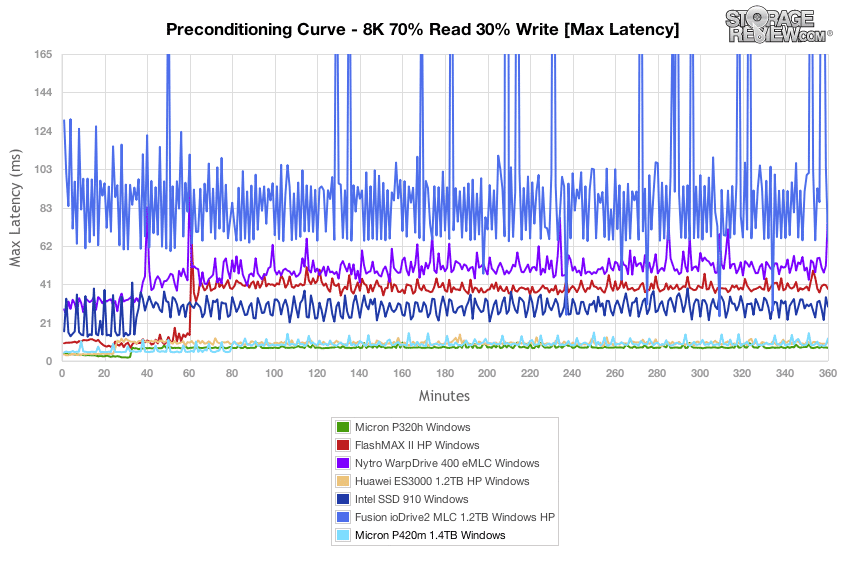
While the Micron P420m had some higher latency spikes in our Linux testing environment, in Windows Server it remained below 16ms for the duration of the preconditioning period.
Comparing latency consistency, the Micron P420m performed at the top of its class over the bulk of the test, with some spikes that brought it into the range of the SLC-based P320h or the FlashMAX II.
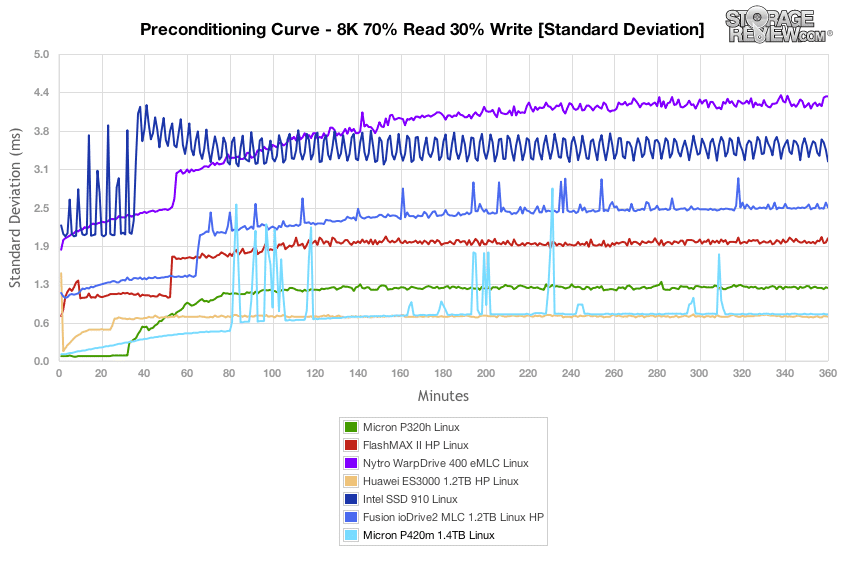
In Windows Server 2008 R2 the Micron P420m was able to offer latency consistency closely matching the Huawei ES3000.
Compared to the fixed 16 thread, 16 queue max workload we performed in the 100% 4k write test, our mixed workload profiles scale the performance across a wide range of thread/queue combinations. In the 8k 70/30 workload the Micron P420m trailed the Virident FlashMAX II from 21.7k IOPS at 2T/2Q to 115.9k IOPS at 16T/16Q, although came in much lower than the 1.2TB ES3000 which scaled from 28.9k up to 276.7k IOPS.
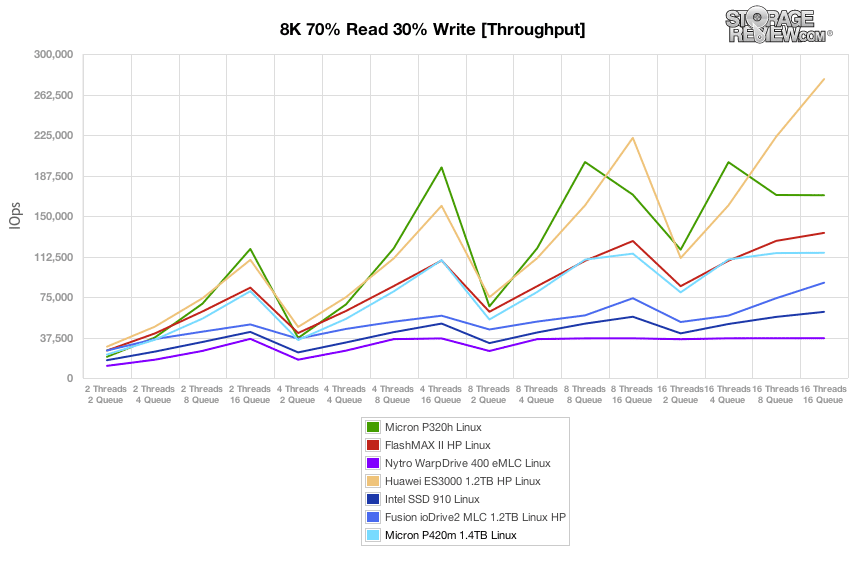
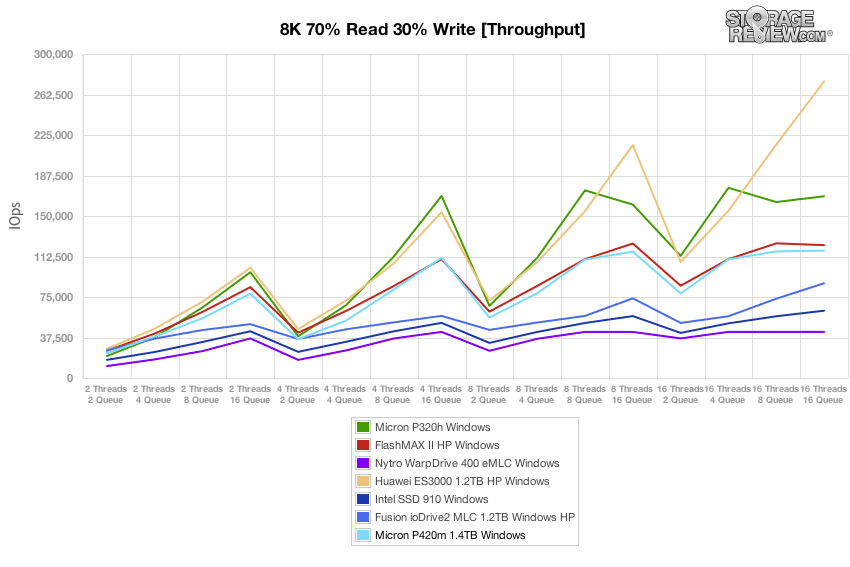
With strong performance in our 8k 70/30 workload in Linux, the Micron P420m picked up a little steam in Windows Server, scaling from 22.8k IOPS at 2T/2Q up to 117.8k IOPS at 16T/16Q.
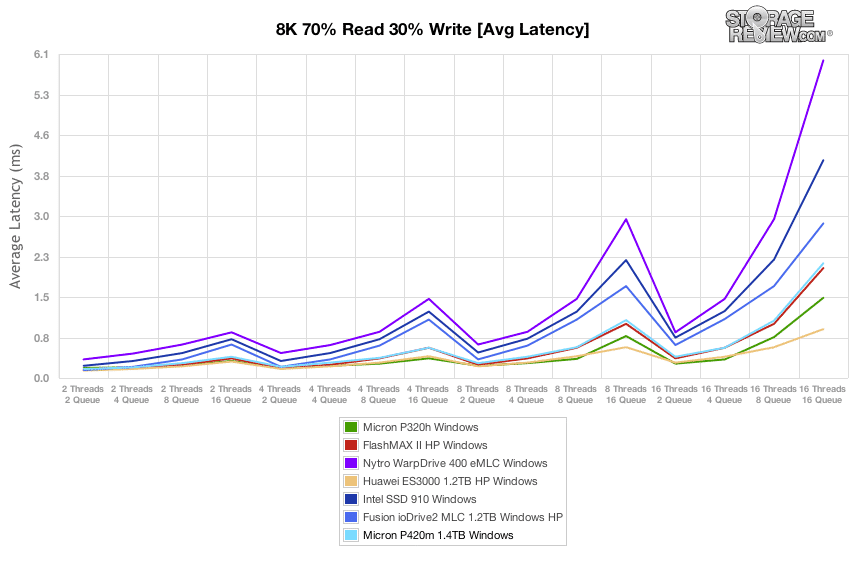
In our CentOS 6.3 environment the Micron P420m offered average latency ranging from 0.17ms at 2T/2Q up to 2.2ms at 16T/16Q.
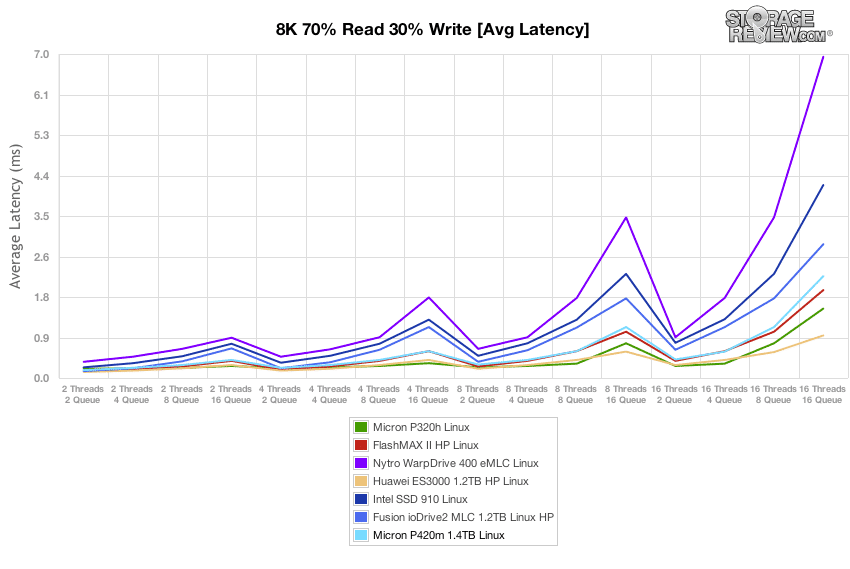
In Windows Server 2008 R2 the Micron P420m offered average latency measuring as low as 0.17ms at 2T/2Q and increased to 2.16ms at 16T/16Q.
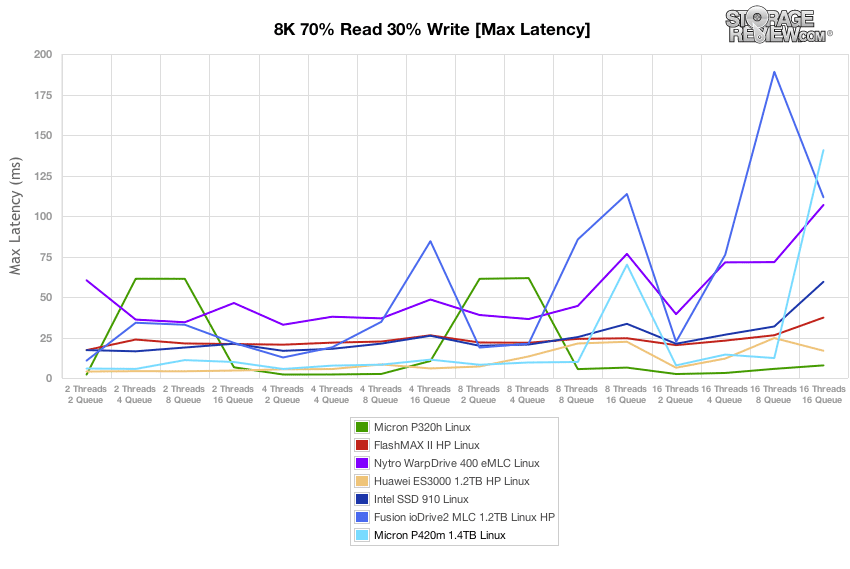
The Micron P420m kept latency spikes to a minimum in our ramped 8k 70/30 workload, showing only two peaks of 70ms and 140ms at an effective queue depth of 128 and 256 respectively.
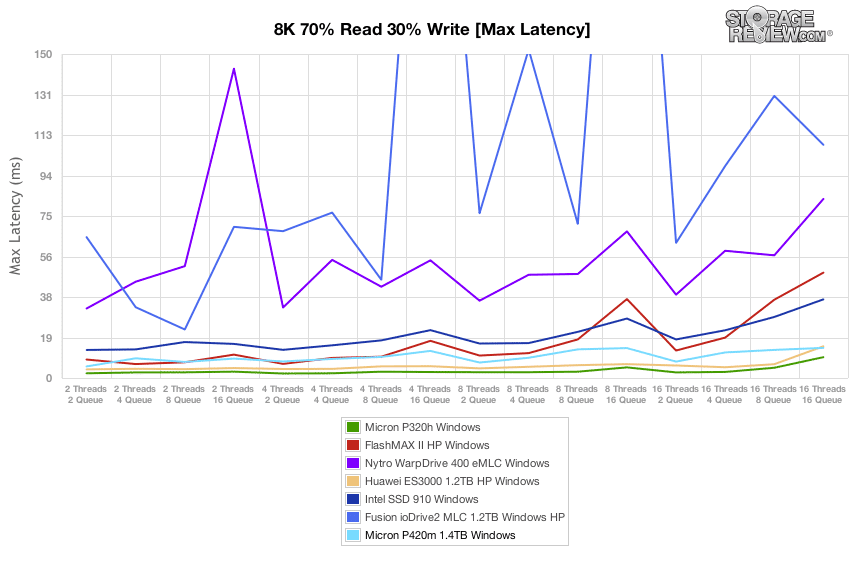
While the Linux environment showed two spikes in peak latency at high queue depths, the P420m remained stable in our Windows Server environment with a high of 13.94ms.
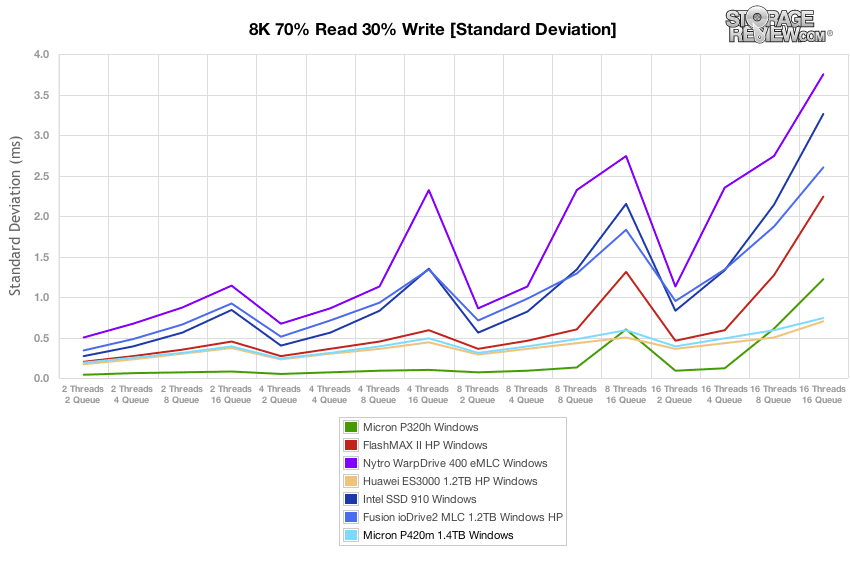
Comparing latency consistency in our ramped 8k 70/30 workload, the Micron P420m came in towards the top of the MLC pack, trailing the Huawei ES3000. The SLC-based Micron P320h still offered the lowest standard deviation in the group, targeting the heavy-write workloads.
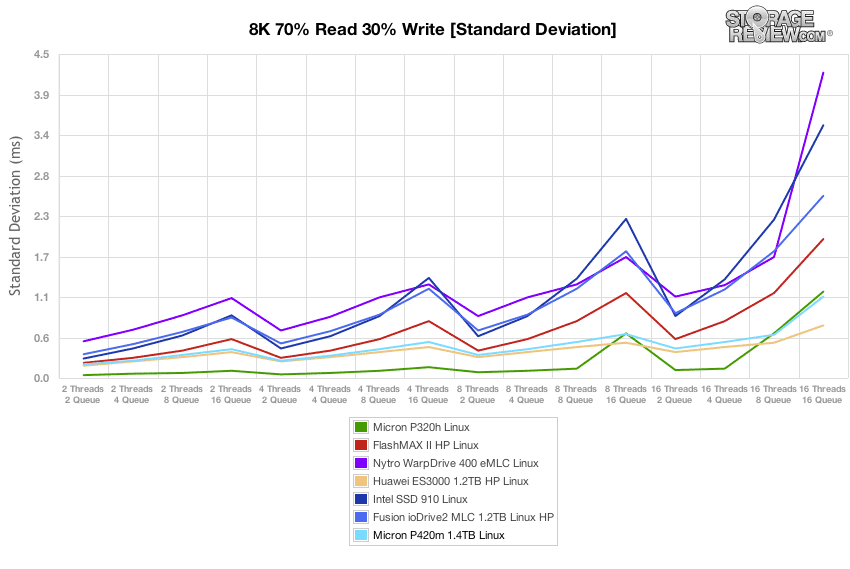
Similar to the tight latency consistency we noted in our Linux environment from the P420m, the Windows Server environment was no different, showing further gains at higher effective queue depths.
Conclusion
The Micron P420m Application Accelerator builds on the success of the Micron P320h PCIe, instead targeting more read-heavy use cases while its sibling is geared for more intensive write-heavy applications. Both cards feature the same custom Micron/IDT ASIC controller that helps the P420m drive sequential performance up to 3.3GB/s read and 630MB/s write with random reads and writes up to 750,000 IOPS and 95,000 IOPS respectively. Another shared feature is that the P420m also ships in two form factors, HHHL PCIe and 2.5", which enables OEMs and customers to have the flexibility they require to pair the best version to a given application. Rounding out selected features, the P420m also adds power-fail capacitors to ensure data integrity, even when there are unplanned power outages.
The P420m differentiates in an increasingly crowded space in a number of ways. Beyond the predictable performance numbers quoted by Micron, the drive is also a universal form factor (PCIe) which is great for standard server deployments. It's also offered of course in the unique 2.5" PCIe form factor that Dell has adopted across their PowerEdge 12G server line. At the end of the day though, the standard PCIe card is dead simple to deploy, fits within PCIe spec (not all cards do) and uses a basic architecture with a single controller and fewer fail points. Tack on the new capacitors for power fail protection and the solution is reliable and compatible, built on a proven architecture.
Turning an eye to performance, the Micron P420m fit into the middle of the pack in write or mixed read/write tests, competing well against the Fusion ioDrive2 single, Intel SSD 910, and LSI Nytro WarpDrive line. When compared to the top-end multi-controller PCIe Application Accelerators such as the Virident FlashMAX II, Huawei ES3000, or the Fusion ioDrive2, the Micron P420m slipped behind in our synthetic benchmarks. This wasn't a huge surprise given the differences in design as well as max power limits and lower cooling requirements that Micron was aiming for with the P420m. In our application tests the P420m stacked up well in our Sysbench benchmark measuring MySQL performance, but slipped to the bottom of the pack in our MarkLogic NoSQL test. For ready-heavy installations, the P420m excelled, offering more than 587k IOPS 4k read in Linux and 636k IOPS read in Windows. Overall the P420m hit the marks Micron was going for, designing a strong performing single-controller PCIe SSD aimed at read-heavy installations available in multiple form factors.
Pros
- Excellent read performance topping 636k IOPS in our random 4k read tests
- Built on a proven architecture with power-fail protection added
- Available in a universal HHHL form factor as well as 2.5" for different server applications
Cons
- Slips behind in performance compared to high-end multi-controller PCIe Application Accelerators
Bottom Line
The Micron P420m PCIe application accelerator provides organizations with flexibility, shipping in both 2.5" and HHHL PCIe form factors, and it also delivers predictable read performance with capacities that range up to 1.4TB for the standard PCIe form factor. Thanks to Micron's 25nm MLC NAND, Micron can reduce cost compared to the SLC model, making the card more affordable, while still providing strong performance in a universally deployable form factor.


 Amazon