

The NetApp AFF A200 is a 2U all-flash storage array that provides an attractive entry point to NetApp's enterprise flash storage portfolio. The AFF A200 features 24 front-mounted 2.5-inch drives managed by dual controllers, and powered by six-core Intel Broadwell-DE processors. The A200 can be accessed with either SAN or NAS workloads (or both). The AFF A200 supports SSDs up to 15TB in capacity, allowing a single array to be outfitted with up to 367TB of raw storage, with additional space available via the DS224C expansion shelf.
When considering the total capacity of a NetApp AFF A200 configuration, it is important to bear in mind that NetApp guarantees the effectiveness of its inline data reduction technologies, including compression, deduplication, and data compaction. NetApp provides guaranteed storage efficiency based on the types of workloads. If clients don’t realize the guaranteed efficiency, NetApp will make up the difference. This guarantee is valid in its current form through April 2018.
Evaluating the AFF A200's data reduction effectiveness falls outside the scope of our review process, but according to NetApp, the AFF A200 should reduce capacity requirements by 2 to 10 times. In brief, NetApp's data compaction technology places multiple logical data blocks from the same volume into a single 4KB block. According to NetApp, this functionality has a "near-zero" impact on performance–which is something that falls well within our review process to evaluate. The A200's architecture leverages the company's FAS2650 array (AFF A200’s architecture is similar to that of the entry-FAS platform), although prior FAS2650 administrators should note that the A200 does not incorporate NVMe FlashCache and only works with SSDs.
Much has changed within the NetApp ecosystem during the three years since our last look at a Netapp product, the FAS2240-2. This includes the debut of the AFF all-flash lineup and the debut of the ONTAP 9 operating system (currently at version 9.2). The AFF A200 is part of the "AFF A" lineup, the second generation of the AFF family. Flash technology and the market for all-flash arrays have also evolved during the intervening time. So it's reasonable to consider the NetApp AFF A200 an indication of where NetApp sees the biggest opportunities for expanding into new markets and consolidating the customer base built in the past with offerings like the FAS2240.
This review takes a comprehensive look at this latest generation entry-level flash storage from NetApp, with a modestly equipped AFF A200 outfitted with 24 960GB SSDs.
NetApp AFF A200 Specifications
- Per HA Pair (active-active controller)
- Form Factor: 2U
- Memory: 64GB
- NVRAM: 8GB
- Storage
- Onboard Bays: 24 2.5" slots
- Maximum SSD: 144
- Maximum Raw Capacity: 2.2PB
- Effective Capacity: 8.8PB (base10)
- SSDs Supported: 15.3TB, 7.6TB, 3.8TB, and 960GB. 3.8TB, and 800GB self-encrypting
- Supported Storage Shelves: DS224C, DS2246
- SAN Scale-Out: 2-8 nodes
- RAID supported: RAID6, RAID4, RAID 6 + RAID 1 or RAID 4 + RAID 1 (SyncMirror)
- OS supported:
- Windows 2000
- Windows Server 2003
- Windows Server 2008
- Windows Server 2012
- Windows Server 2016
- Linux
- Oracle Solaris
- AIX
- HP-UX
- Mac OS
- VMware
- ESX
- Ports:
- 8x UTA2 (16Gb FC, 10GbE/FCoE)
- 4x 10GbE
- 4x 12Gb SAS
- Storage Networking supported:
- FC
- FCoE
- iSCSI
- NFS
- pNFS
- CIFS/SMB
- OS version: ONTAP 9.1 RC2 or later
- Max number of LUNs: 4,096
- Number of supported SAN hosts: 512
Build and Design
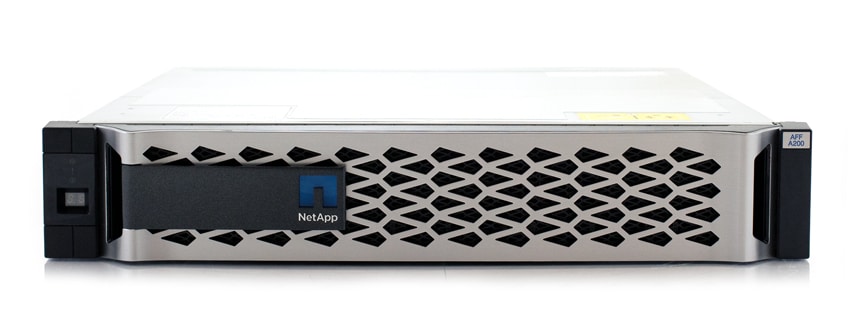
The NetApp AFF A200 is built around a 24-bay chassis supporting 2.5-inch SAS SSDs. This architecture is based on NetApp's DS224C storage shelf, matched with Intel Broadwell-DE 6-core processors and 12Gbps SAS connectivity to internal and external drives. From a design perspective, Netapp over-built everything for the utmost level of redundancy. MP-HA (Multi-path High-Availability) SAS connections route internally and externally, so each controller can talk to every drive through multiple pathways, even if one link is detached or over-utilized. Additionally, the unit sports an NVMEM battery, which when fully charged is able to handle 25 separate power-fail events, giving each controller enough uptime to de-stage in-flight data to an onboard-boot device. Furthermore, even the de-staged data is fully encrypted to protect it, regardless of the event that caused the power failure in the first place. This same level of resilience shows itself in the design of the chassis cooling and power systems, where each power supply alone can fully cool and power the system indefinitely under normal operating conditions.
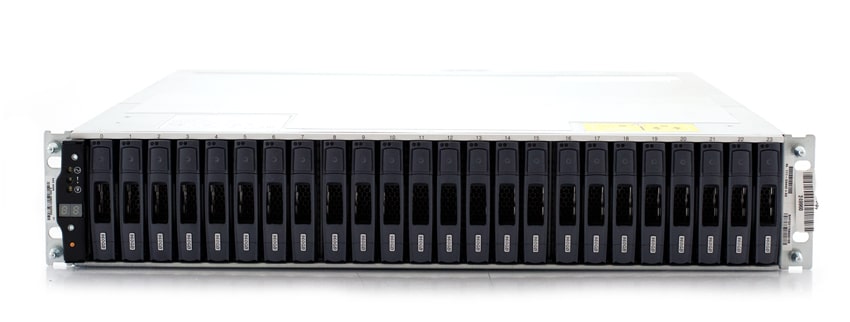
The front of the device is simple enough with a NetApp-branded bezel covering the drive bays. On the left-hand side is the power button, along with an LED display indicating faults and activity status.
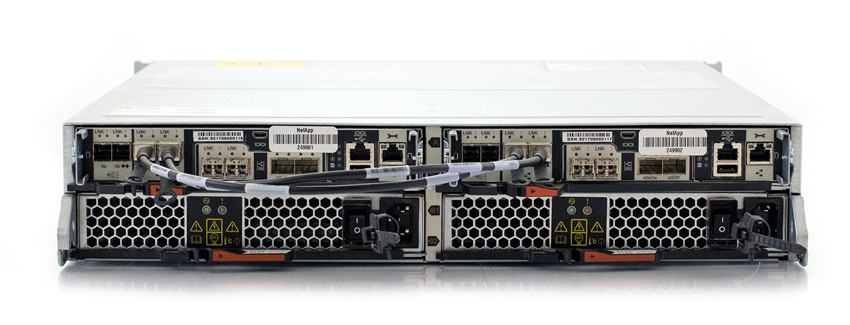
The rear view has a bit more going on with various cable paths, but it's the connectivity that allows most of the redundant magic to happen. There are two nodes and the device is split down the middle with either side being identical to the other. On the left side of each controller are two SAS ports. These are used in conjunction with additional additional storage shelves, as well as also acting as an external redundant link between each controller for HA SAS connectivity. Next to the SAS ports are two 10GbE ports that allow node-to-node connectivity. In a single-pair deployment, both nodes are directly connected to one another, while in a larger cluster (Clustered Data ONTAP), these ports are connected to a dedicated switch for cluster traffic. Next are four UTA2 ports, which can be configured to operate in FC or Ethernet personalities for the primary data or network fabric. Above the UTA2 ports is a console micro-USB port. To the right of the UTA2 ports are a RJ-45 console port and USB port. And on the right-hand side is the management port. Beneath the ports listed are the dual power supplies.
Management
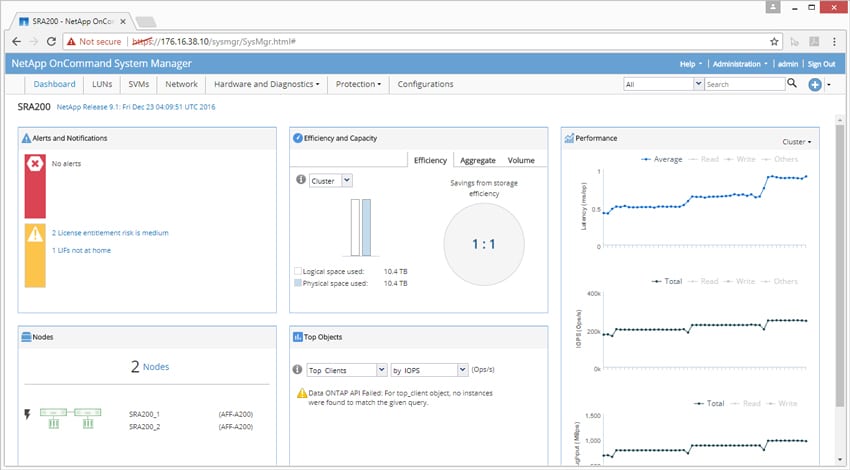
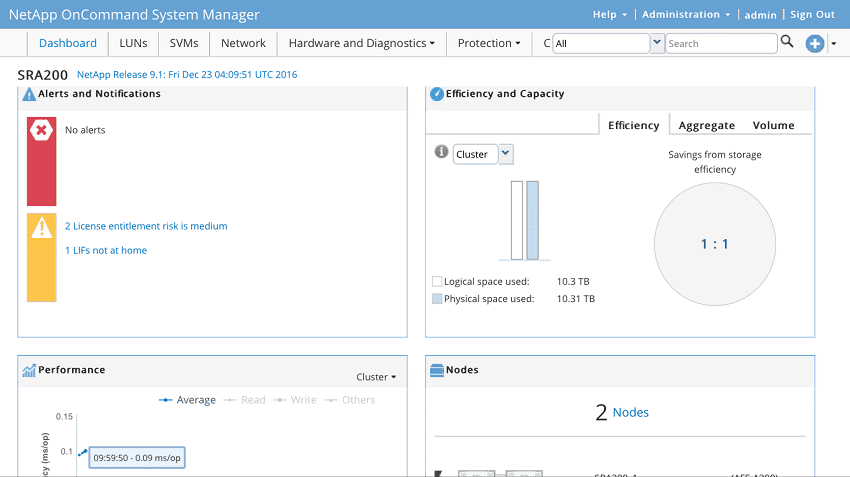
The NetApp AFF A200 runs ONTAP 9.1 and up; 9.2 came out during our review. The UI is NetApp’s OnCommand System Manager. Along the top are several main tabs including Dashboard, LUNs, SVMs, Network, Hardware and Diagnostics, Protection, and Configurations. Through the main dashboard, users are able to easily see alerts and notifications, how man nodes are currently being used (in our case 2), storage efficiency, Top Objects, and a read out on current performance in latency, IOPS, and bandwidth.
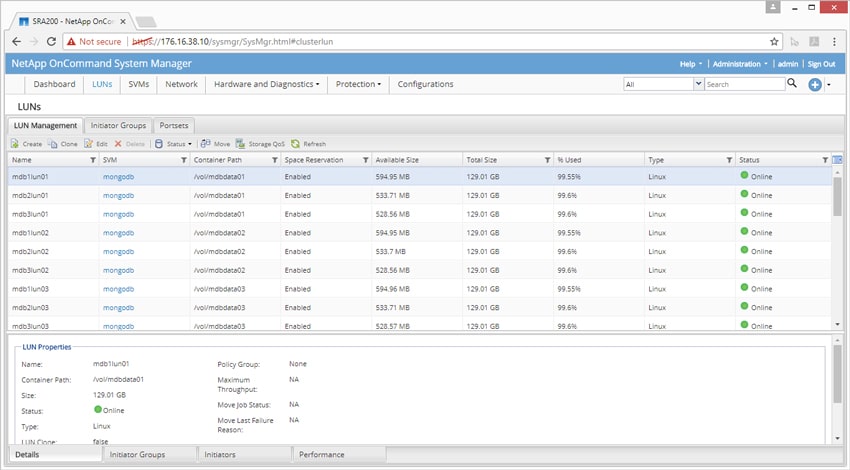
Under the LUN tab, users can easily manage their LUNs as they are listed by name and clicking on one brings up the properties at the bottom of the screen.
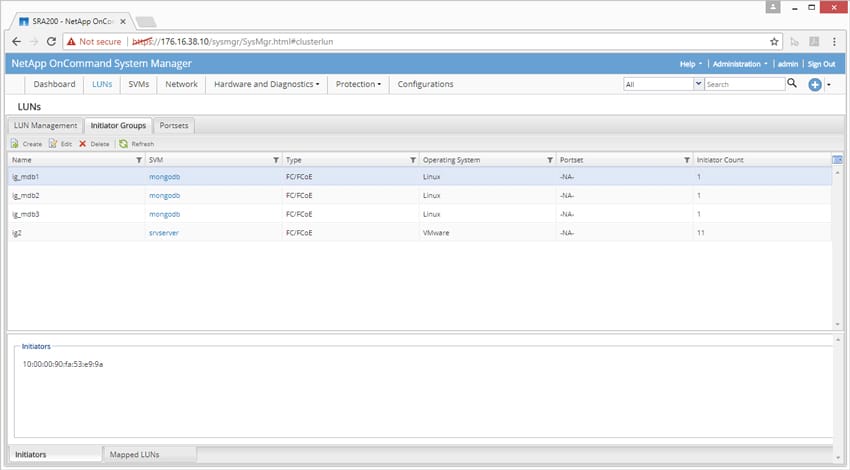
Also under the LUN tab is the sub tab for Initiator groups. Here users can easily see and manage the name, SVM, type, OS, Portset, and count.
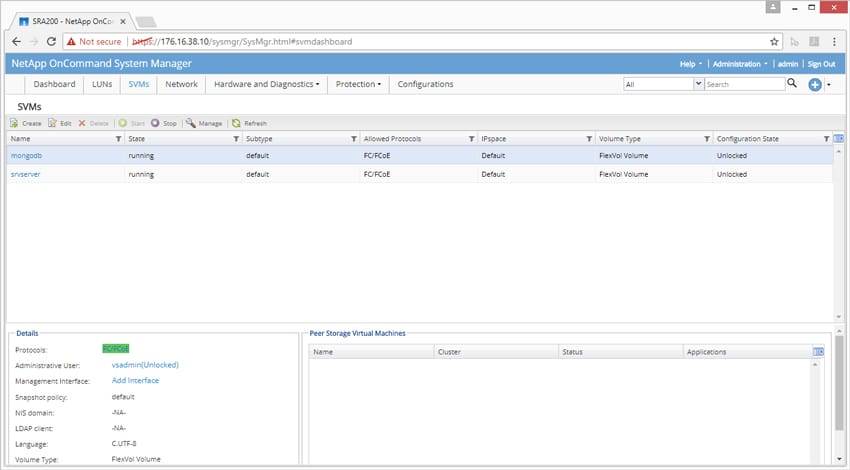
The next main tab is SVM (Storage Virtual Machines). Clicking on this tab gives users a list of SVMs, along with their details in the bottom left-hand corner.
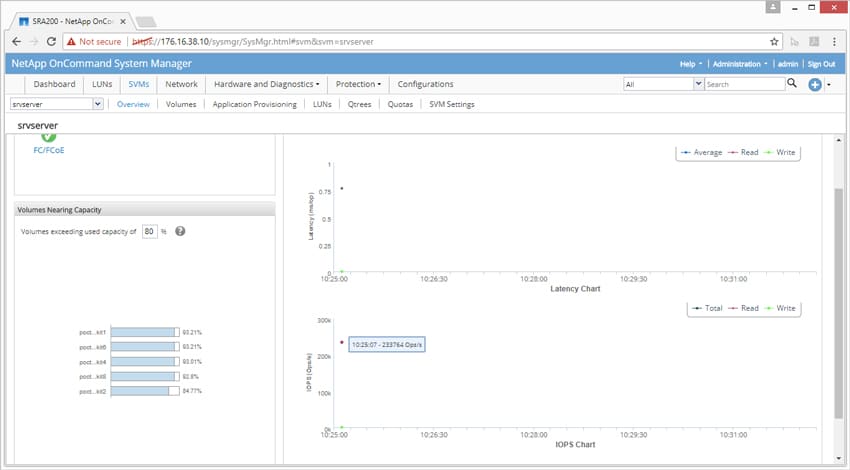
Clicking on a specific SVM gives users several other options such as an overview that shows things such as connection, volumes nearing capacity, and performance of the SVMs.
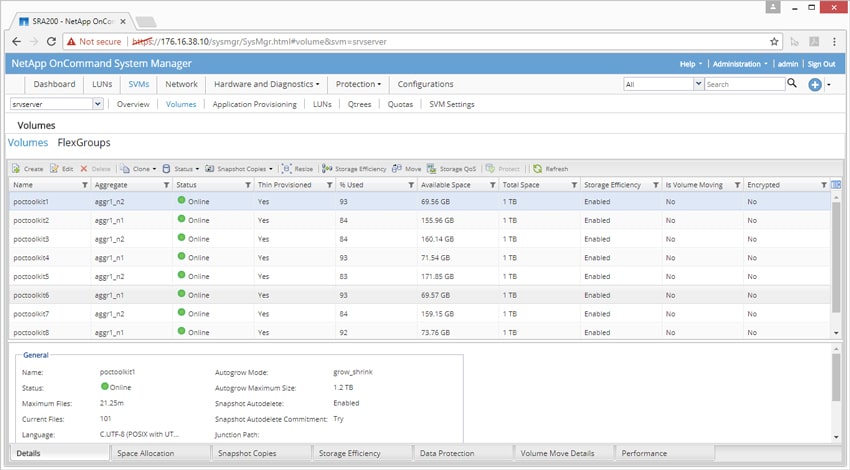
When clicking on an SVM, there are several other sub-tabs including Volumes, Application Provisioning, LUNs, Qtrees, Quotas, and SVM Settings. Under the Volumes sub-tab, users can see the volumes set up, edit or remove them, take a snapshot, and adjust the QoS among other functions.
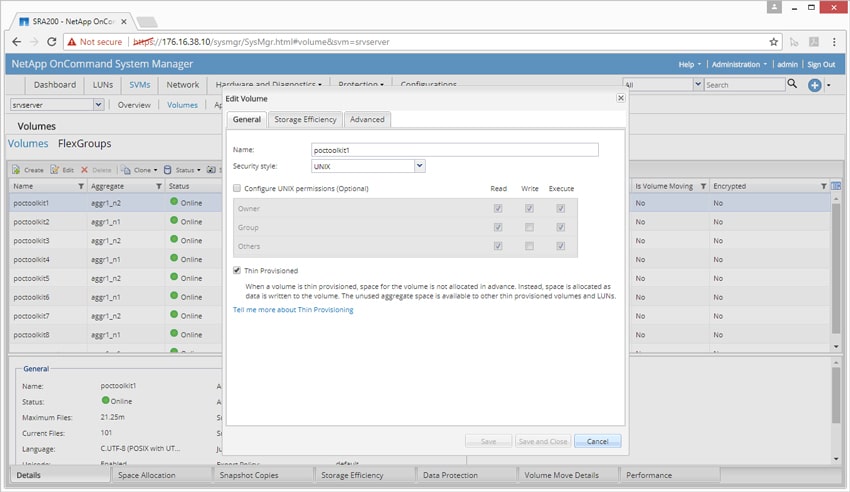
If users want to edit one of the volumes, they need only right click a volume and they are brought to the screen below. Here they are given three tabs to edit including General, Storage Efficiency, and Advanced. As the name implies, the General tab allows general information to be edited including the name, security style, and whether or not the volume is thin provisioned.
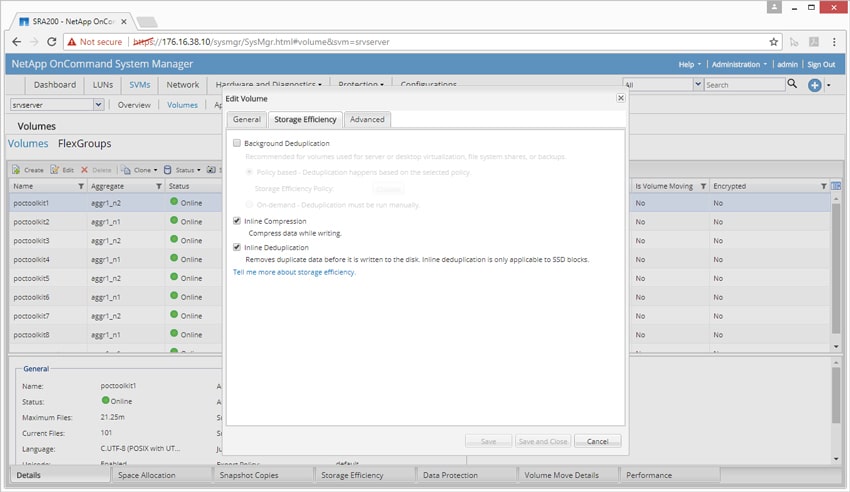
Storage Efficiency allows users to edit the data-reduction capabilities within the volume. This includes turning on or off background deduplication, inline compression, and inline deduplication.
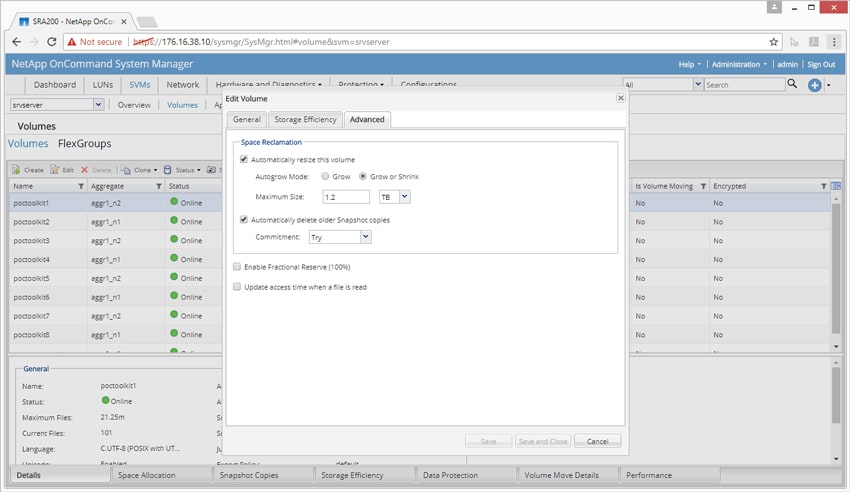
Advanced allows users to set space reclamation, including automatically resizing the volume and deleting old snapshots. Users can also enable fractional reserve and update access time when a file is read.
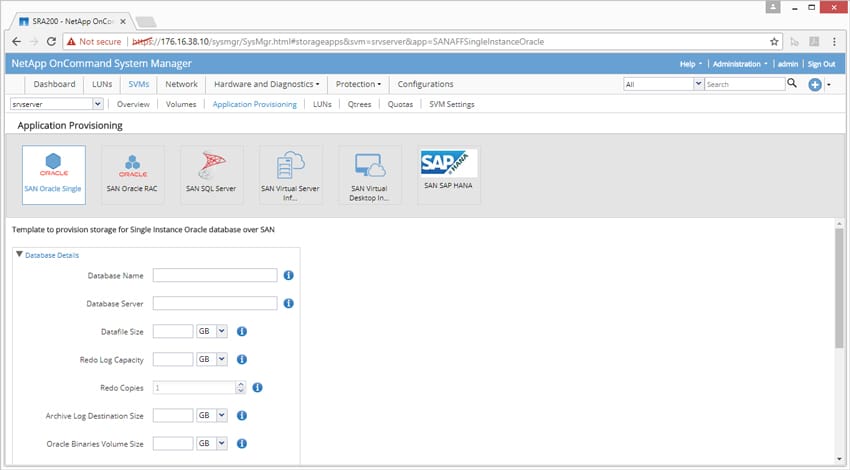
The next sub-tab is Application Provisioning. As the name implies, users are able to provision certain applications for SVMs under this tab. These applications (and their templates) include Oracle SAN Oracle Single, Oracle SAN Oracle RAC, SAN SQL Server, SAN Virtual Desktop Instance, and SAN SAP HANA.
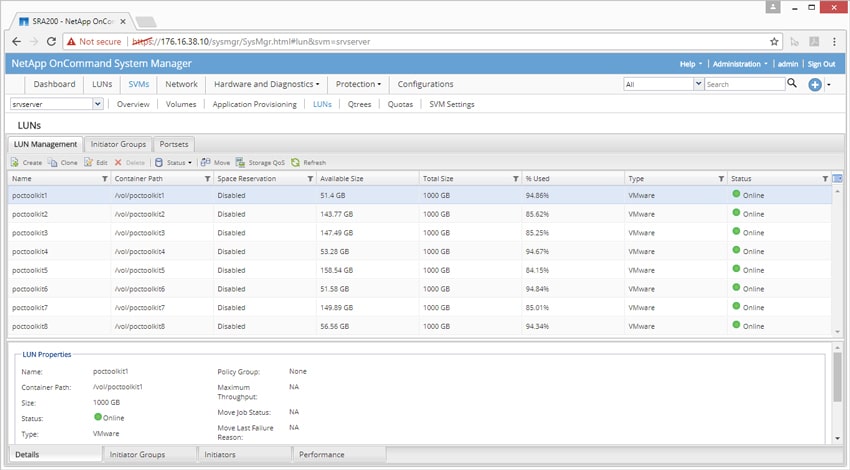
The LUNs sub-tab for SVMs enables users the ability to see, manage, and edit the LUNs for each SVM. The LUNs are listed by name (though this can be adjusted) with general details for each. And if users click on one, they can see more advanced properties at the bottom.
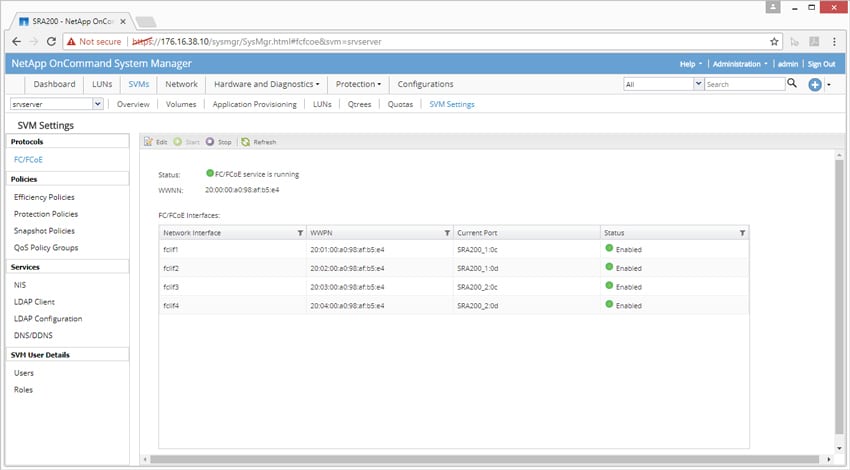
An important sub-tab under SVMs is the Settings tab. This tab allows users to see things such as protocols, policies, services, user details, and the current statuses.
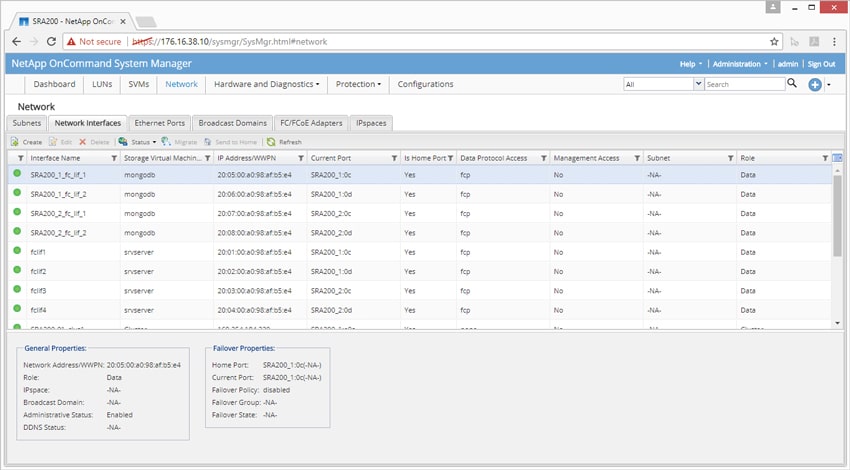
The next main tab we look at is the Network tab. This tab has several sub-tabs including Subnets, Network Interfaces, Ethernet Ports, Broadcast Domains, FC/FoE Adaptors, and IPspaces. The first sub-tab we’ll look at is Network Interfaces. Here users are able to see the Interface name, the SVM, IP address, the current port, whether or not it is a home port, the type of data protocol access, management access, the subnet, and the role. Clicking on an interface also shows general and failover properties.
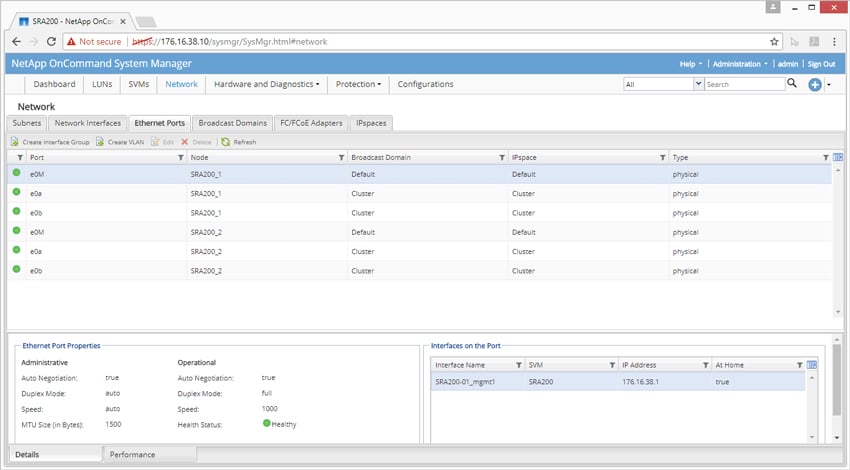
The Ethernet Ports sub-tab lists the different ports, what node they are on, their broadcast domain and IPspace, and what type they happen to be. Clicking on a port also gives users the properties and interfaces.
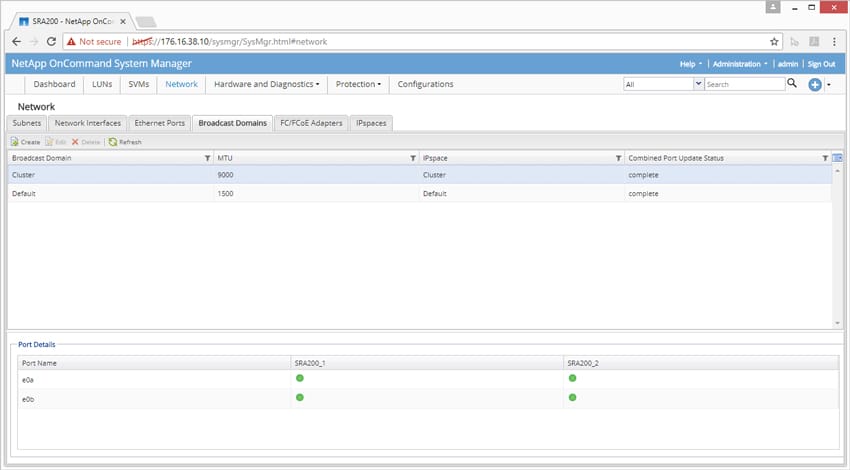
The Broadcast Domain sub-tab tells users whether the broadcast domain is a cluster or default, its maximum transmission units (MTU), its IPspace, and its combined port update status.
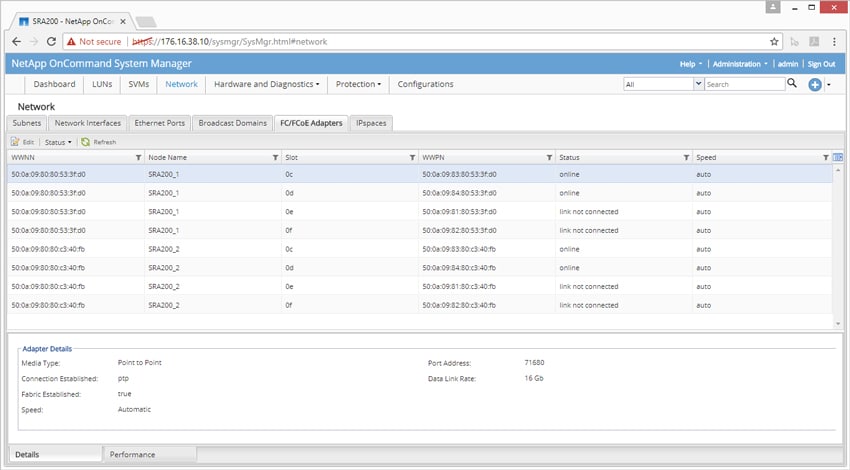
The FC/FoE Adaptors sub-tab shows information about the adaptors such as its WWNN, which node it is on, which slot it is located in, its WWPN, its status, and its speed. Clicking on an adaptor gives users additional details such as media type, connection established, fabric established, speed, port address, and data link rate.
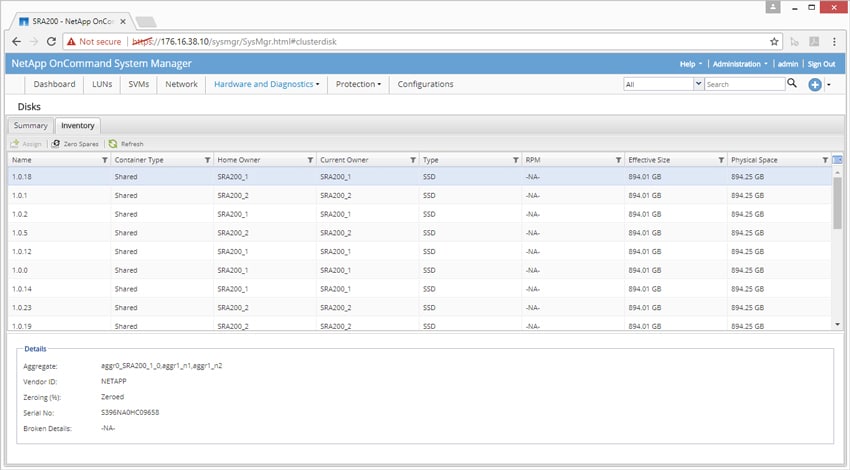
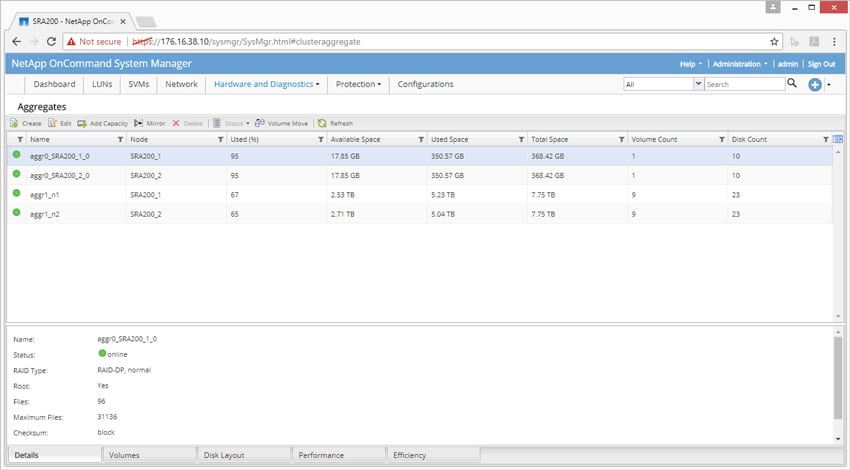
The next main tab is Hardware and Diagnostics. This tab gives user a drop-down menu with several options. One of the options is disk, with two sub-tabs, Summary and Inventory. Under Inventory, users are able to see all the disks in their cluster, the names, container type, home and current owner, type (in this case all SSD), RPM (in this case, none–as the disks are all SSDs), effective size, and physical space. Clicking on a disk also provides additional details such as aggregate, vendor ID, zeroing, serial numbers, and broken details.
Users can look at aggregates in order to see information such as the name, which node they are on, the percentage used, available space, used space, total space, volume count, and disk count.
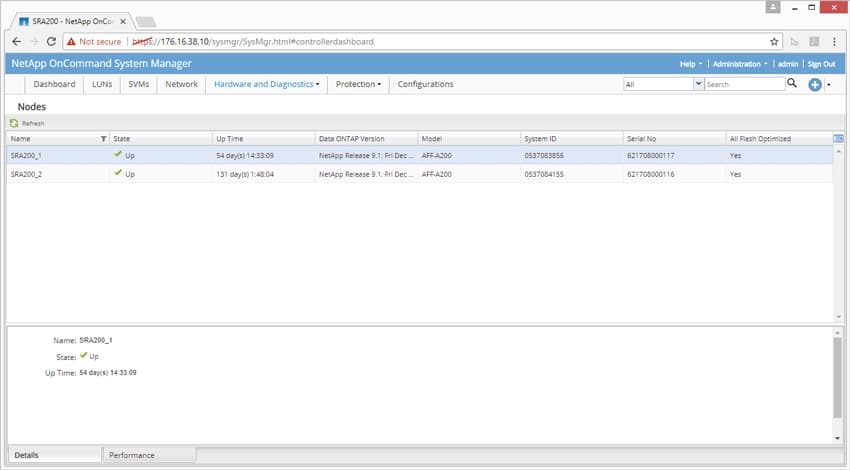
The Diagnostics for nodes gives some general information such as the name, status, up time, ONTAP version, model number, system ID, serial number, and whether or not the node is all-flash optimized.
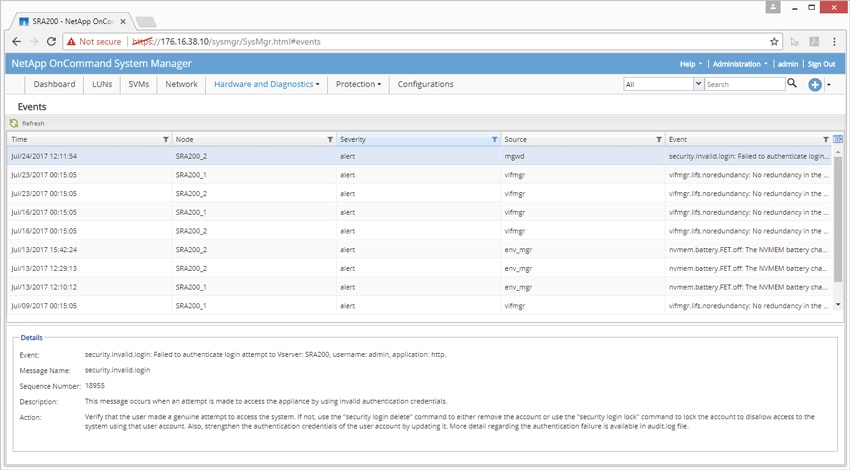
The Diagnostics for Events gives admins a fairly detailed message about events, their severity, where they originated, the node they happened in, the date and time, and other details of the event.
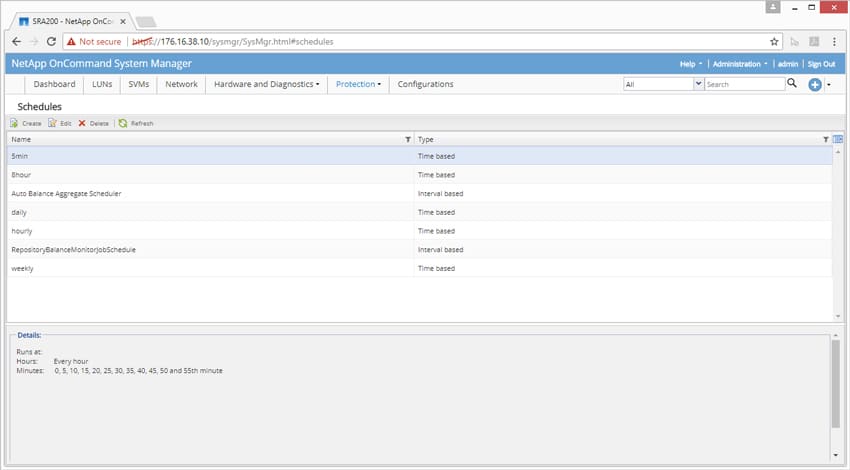
The next main tab is Protection, which gives users a drop-down menu for snapshots. Users are given a screen for scheduling snapshots, with various options being time-based or interval-based.
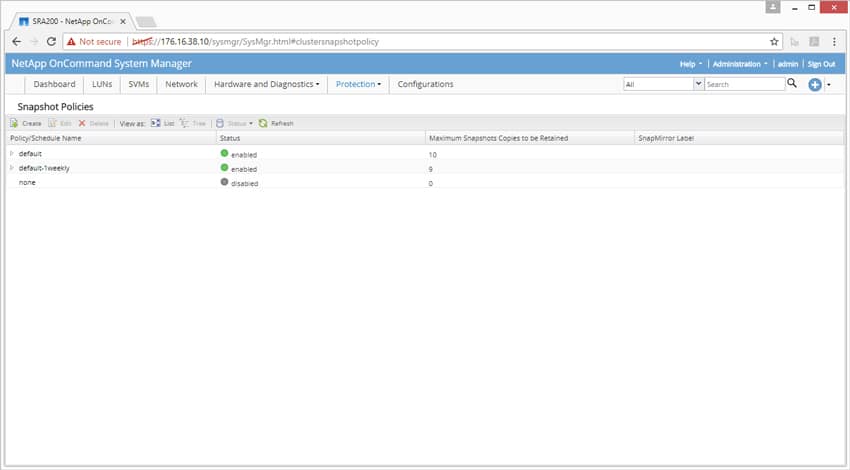
The other screen under the Protection tab allows users to set snapshot policies.
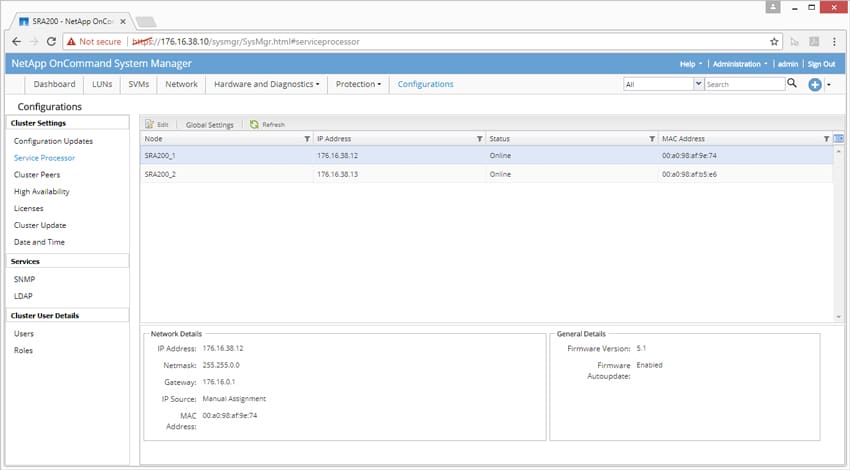
The final main tab is Configuration. The Configuration tab has many subsections on the left-hand side including Configuration Updates, Service Processor, Cluster Peers, High Availability, Licenses, Cluster Updates, Date and Time, SNMP, LDAP, Users, and Roles. Clicking on Service Processor, users see the nodes in the cluster, their IP addresses, status, and MAC address, as well as network and general details.
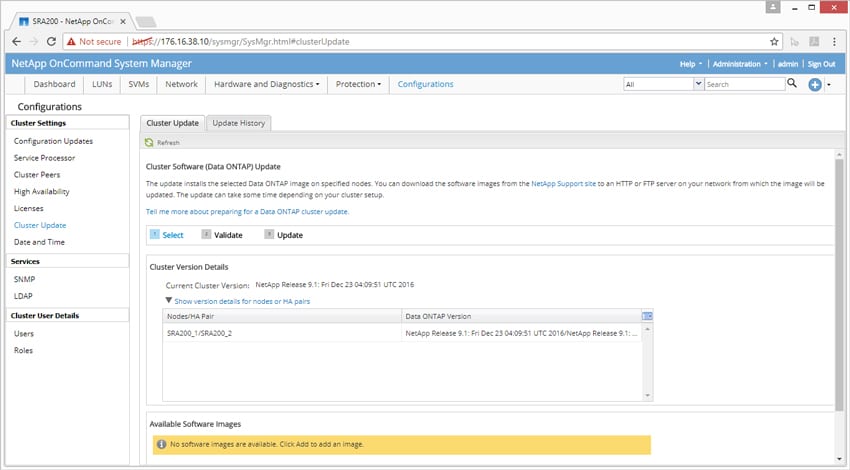
Under Cluster Update, users can see what updates are available through ONTAP for their cluster and what the update entails.
Overall, the management interface on the NetApp AFF A200 is pleasant to use and had no hiccups during our testing. It offers a browser and software-agnostic approach to work on really any type of platform, including an iPhone (screenshot included below). While the mobile interface wasn't the preferred way to manage the system, just the fact that you could if the need came up is impressive. The interface is clean and easy to follow, with all areas we interacted with simple to flow through to manage the array. While some interfaces might have a "newer" look or feel, the ONTAP WebGUI keeps clutter to a minimum, and best of all, is very responsive and easy to jump through.
Application Workload Analysis
The application workload benchmarks for the NetApp AFF A200 consist of the MySQL OLTP performance via SysBench and Microsoft SQL Server OLTP performance with a simulated TPC-C workload.
Testing was performed over FC using four 16Gb links, with two connections per controller.
SQL Server Performance
Each SQL Server VM is configured with two vDisks: 100GB volume for boot and a 500GB volume for the database and log files. From a system resource perspective, we configured each VM with 16 vCPUs, 64GB of DRAM and leveraged the LSI Logic SAS SCSI controller. While our Sysbench workloads tested previously saturated the platform in both storage I/O and capacity, the SQL test is looking for latency performance.
This test uses SQL Server 2014 running on Windows Server 2012 R2 guest VMs, and is stressed by Quest's Benchmark Factory for Databases. While our traditional usage of this benchmark has been to test large 3,000-scale databases on local or shared storage, in this iteration we focus on spreading out four 1,500-scale databases evenly across the A200 (two VMs per controller).
SQL Server Testing Configuration (per VM)
- Windows Server 2012 R2
- Storage Footprint: 600GB allocated, 500GB used
- SQL Server 2014
- Database Size: 1,500 scale
- Virtual Client Load: 15,000
- RAM Buffer: 48GB
- Test Length: 3 hours
- 2.5 hours preconditioning
- 30 minutes sample period
SQL Server OLTP Benchmark Factory LoadGen Equipment
- Dell PowerEdge R730 Virtualized SQL 4-node Cluster
- Eight Intel E5-2690 v3 CPUs for 249GHz in cluster (Two per node, 2.6GHz, 12-cores, 30MB Cache)
- 1TB RAM (256GB per node, 16GB x 16 DDR4, 128GB per CPU)
- 4 x Emulex 16GB dual-port FC HBA
- 4 x Emulex 10GbE dual-port NIC
- VMware ESXi vSphere 6.5 / Enterprise Plus 8-CPU
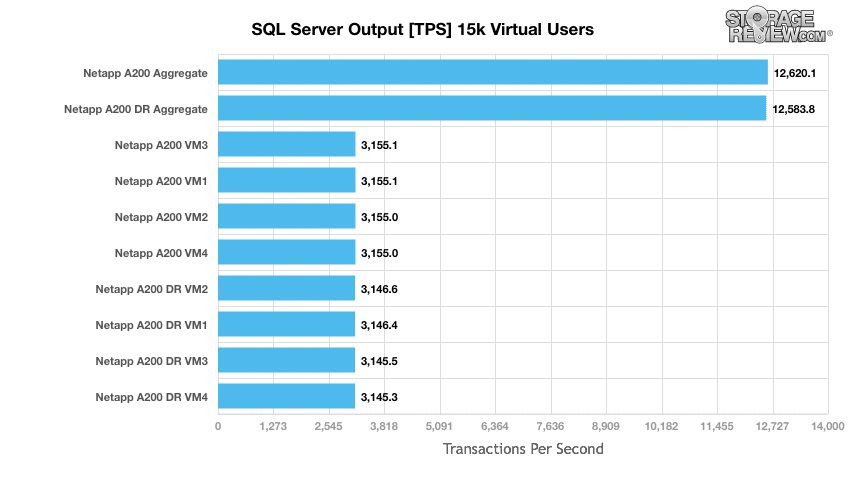
Looking at transactional performance of the NetApp AFF A200 in our SQL Server test, the AFF A200 achieved results of 12,620.15 TPS with individual VMs ranging from 3,154.95 TPS to 3,155.113 TPS. In data reduction mode, we saw similar results with the NetApp A200 hitting an aggregate score of 12,583.81 TPS, with individual VMs ranging from 3,145.29 TPS to 3,146.43 TPS.
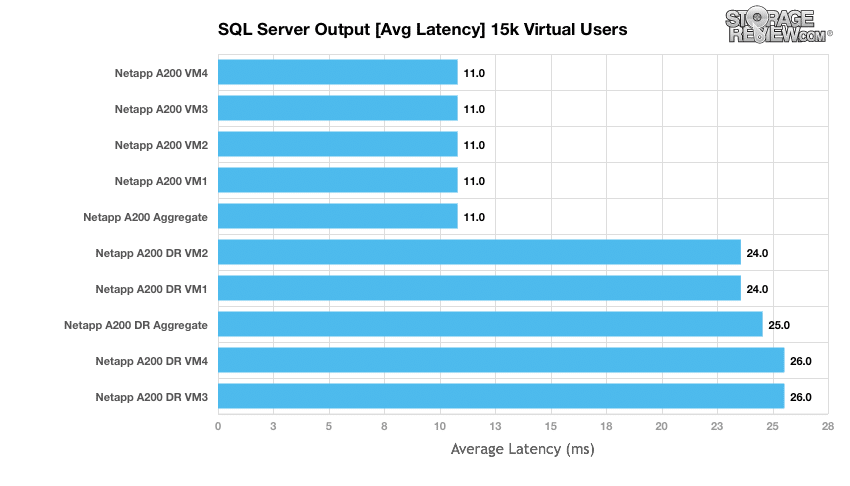
When looking at average latency, the A200 hit 11ms in all VMs, giving it an aggregate of 11ms as well. In DR mode, the latency went up some, though that is to be expected with individual VMs ranging from 24ms to 26ms, giving an aggregate score of 25ms.
Sysbench Performance
Each Sysbench VM is configured with three vDisks, one for boot (~92GB), one with the pre-built database (~447GB), and the third for the database under test (270GB). From a system resource perspective, we configured each VM with 16 vCPUs, 60GB of DRAM and leveraged the LSI Logic SAS SCSI controller. Load gen systems are Dell R730 servers; we range from four to eight in this review, scaling servers per 4VM group.
Dell PowerEdge R730 Virtualized MySQL 4-5 node Cluster
- 8-10 Intel E5-2690 v3 CPUs for 249GHz in cluster (Two per node, 2.6GHz, 12-cores, 30MB Cache)
- 1-1.25TB RAM (256GB per node, 16GB x 16 DDR4, 128GB per CPU)
- 4-5 x Emulex 16GB dual-port FC HBA
- 4-5 x Emulex 10GbE dual-port NIC
- VMware ESXi vSphere 6.5 / Enterprise Plus 8-CPU
Sysbench Testing Configuration (per VM)
- CentOS 6.3 64-bit
- Storage Footprint: 1TB, 800GB used
- Percona XtraDB 5.5.30-rel30.1
- Database Tables: 100
- Database Size: 10,000,000
- Database Threads: 32
- RAM Buffer: 24GB
- Test Length: 3 hours
- 2 hours preconditioning 32 threads
- 1 hour 32 threads
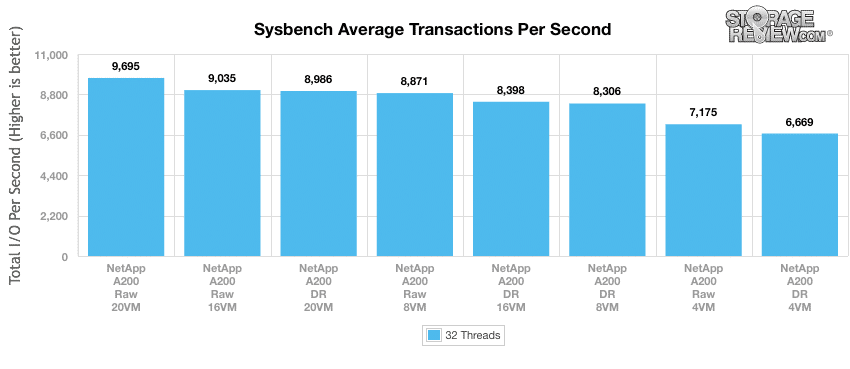
For Sysbench, we tested several sets of VMs including 4, 8, 16, and 20, and we ran Sysbench with both the data reduction "On" and in the "Raw" form. For transactional performance, the NetApp A200 showed its best performance with 20VMs and the data reduction off, resulting in 9,695 TPS. With the DR on, the A200 still hit 8,986 TPS at 20VMs.
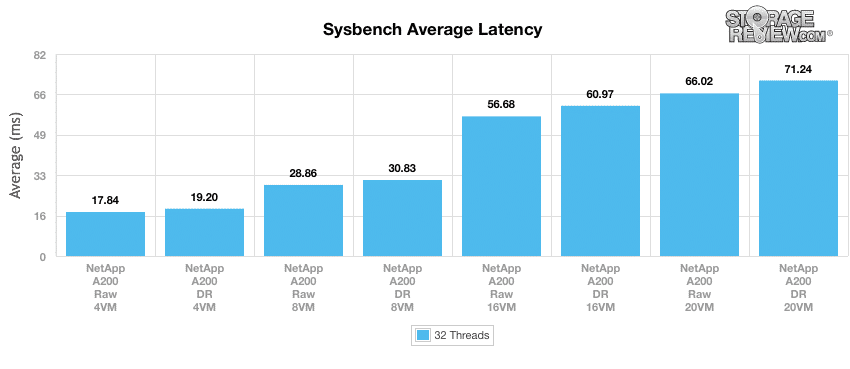
As far as average latency goes, obviously it is lower with fewer VMs, so the 4VM benchmarks had 17.84ms for the Raw and only 19.2ms for the DR. What is interesting is that at 20VMs, the difference in the Raw and data reduction version was only about 5ms (66.02ms to 71.24ms).
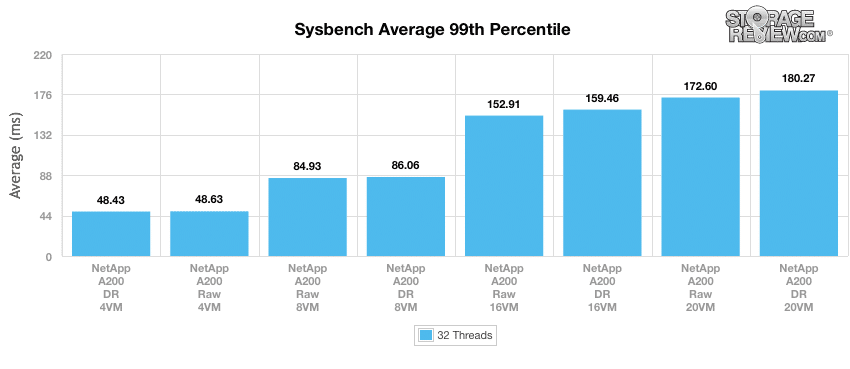
In our worst-case scenario latency benchmark, the A200 also had strong performance with the data reduction version of 4VMs having the lowest latency at 48.43ms (though the Raw was only at 48.63ms). When raising the VM count to 20, the data reduction version only hit 180.27ms and the Raw hit 172.6ms.
VDBench Workload Analysis
When it comes to benchmarking storage arrays, application testing is best, and synthetic testing comes in second place. While not a perfect representation of actual workloads, synthetic tests do help to baseline storage devices with a repeatability factor that makes it easy to do apples-to-apples comparison between competing solutions. NetApp shared their POC Toolkit with us during the review of the AFF A200, which offers a range of different testing profiles ranging from "four corners" tests, common database transfer size tests, as well as trace captures from different VDI environments. All of these tests leverage the common vdBench workload generator, with a scripting engine to automate and capture results over a large compute testing cluster. This allows us to repeat the same workloads across a wide range of storage devices, including flash arrays and individual storage devices. On the array side, we use our cluster of Dell PowerEdge R730 servers:
Profiles:
- 4k Random Read: 100% Read, 128 threads, 0-120% iorate
- 4k Random Write: 100% Write, 64 threads, 0-120% iorate
- 64k Sequential Read: 100% Read, 16 threads, 0-120% iorate
- 64k Sequential Write: 100% Write, 8 threads, 0-120% iorate
- Synthetic Database: SQL and Oracle
- VDI Full Clone and Linked Clone Traces
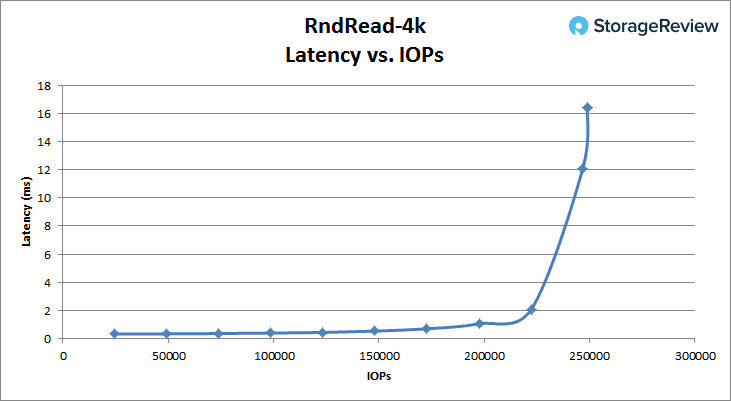
Looking at peak read performance, the NetApp AFF A200 offered exceptional low-latency 4k read performance, measuring 0.31ms at the start, and staying below 1ms up to around 190k IOPS. At its peak, the A200 measured 249k IOPS at a latency of 16.4ms.
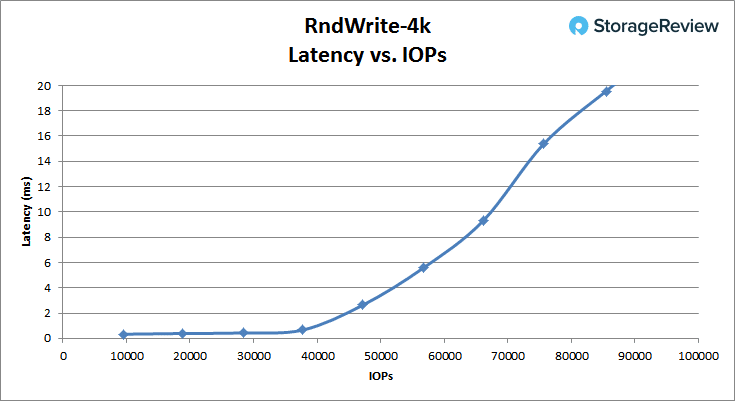
Looking at 4k peak write performance, the A200 started off with a latency of 0.34ms and stayed below 1ms until it hit between 40K and 50K IOPS. At its peak, the A200 hit over 85K IOPS at 19.6ms
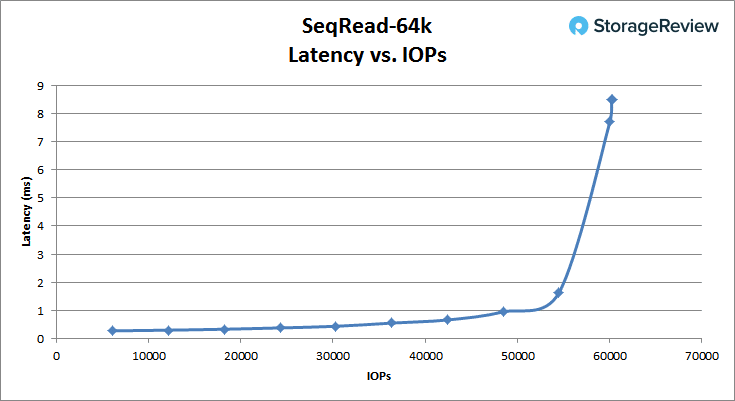
Switching to 64k peak read, the A200 started off at 0.27ms latency and stayed below 1ms until it hit above 48.5K IOPS. It peaked just over 60K IOPS with 8.5ms of latency. The A200 finished with a bandwidth of 3.75GB/s.
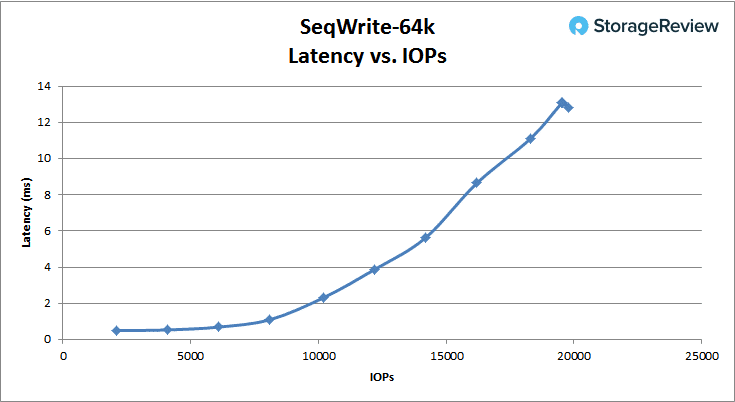
For 64k sequential peak write, the A200 started off at 0.49ms and stayed under 1ms until it hit just over 6K IOPS. The A200 hit its peak at 19.7K IOPS with a latency of 12.85ms. The A200 also had a bandwidth of 1.22GB/s at its peak.
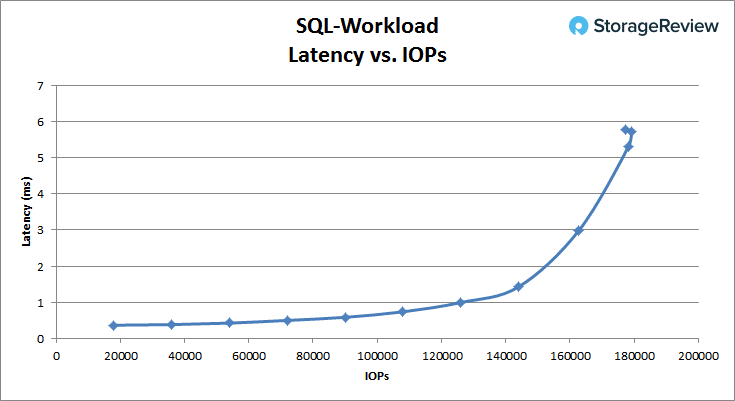
In our SQL workload, the A200 started its latency at 0.37ms and stayed under 1ms until just over 120K IOPS. It peaked at 179K IOPS and 5.7ms.
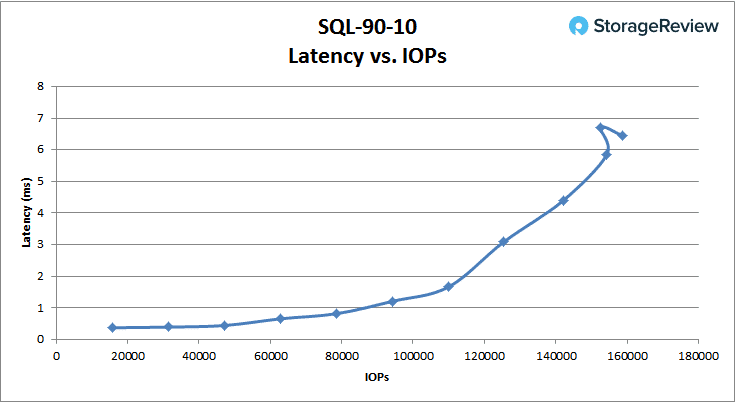
In the SQL 90-10 benchmark, the A200 started with a latency of 0.37ms and stayed under 1ms until it hit between 80K and 100K IOPS. The A200 peaked at 159K IOPS with 6.5ms latency.
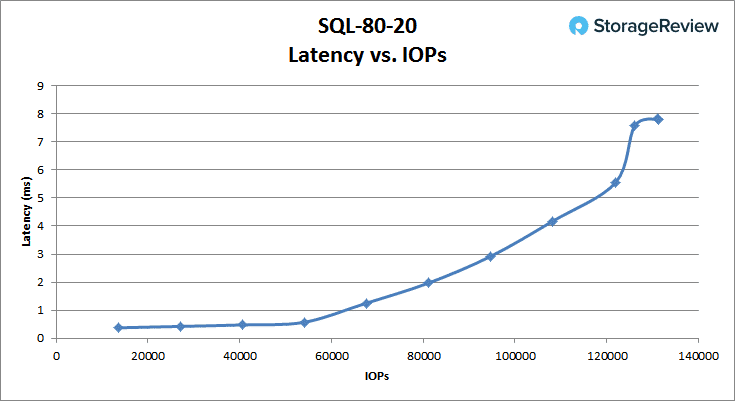
The SQL 80-20 saw the A200 start with a latency of 0.38ms and stay under 1ms until it moved over 60K IOPS. The A200 peaked at 131K IOPS with 7.8ms latency.
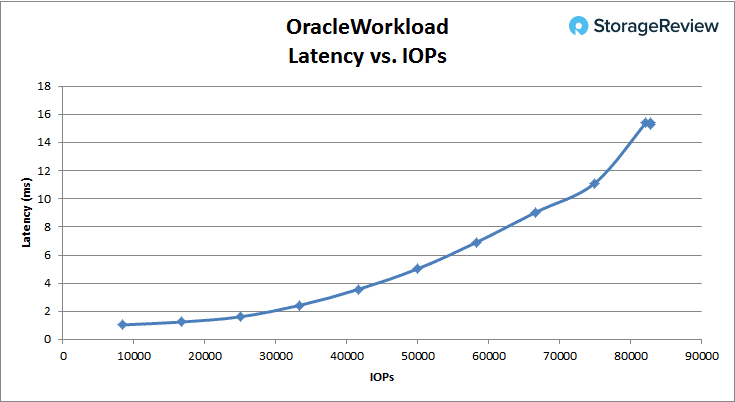
With the Oracle Workload, the A200 started with a latency of 0.39ms and stayed under 1ms until it went over 50K IOPS. The A200 peaked at 125K IOPS with a latency of 10.2ms.
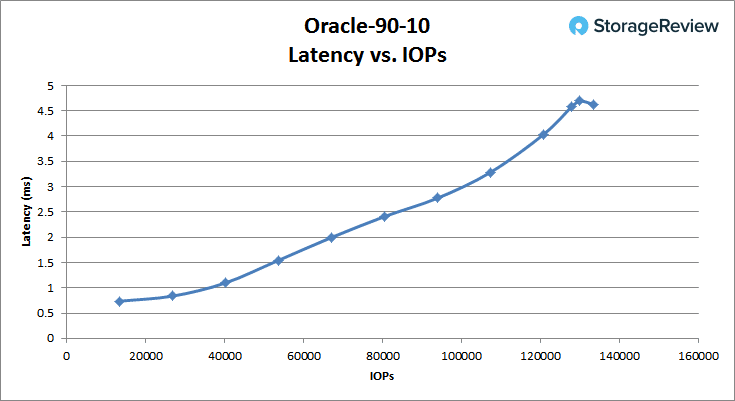
With the Oracle 90-10, the A200 started off at a latency of 0.37ms and stayed under 1ms until it was just under 100K IOPS. It peaked at 155K IOPS with a latency of 4.2ms.
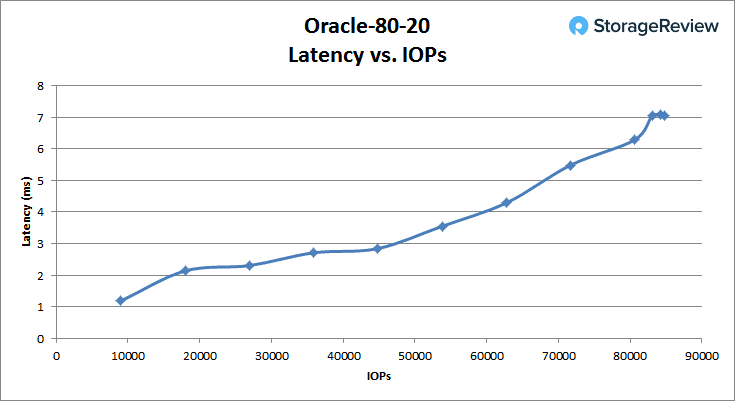
With the Oracle 80-20, the A200 started off at a latency of 0.38ms and stayed under 1ms until it was just under 65K IOPS. It peaked at 129K IOPS with a latency of 4.9ms.
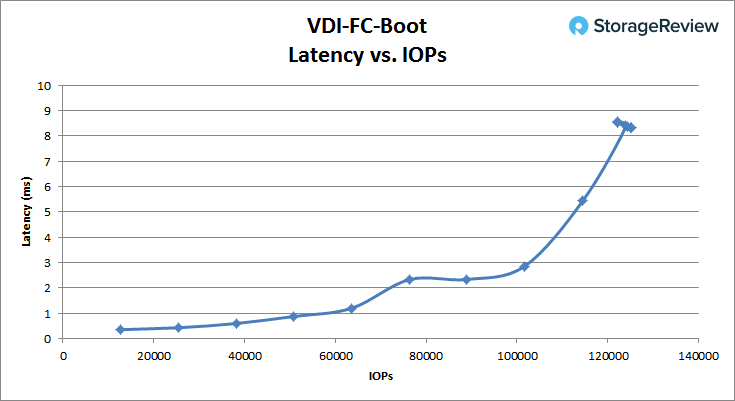
Switching over to VDI Full Clone, the boot test showed the A200 starting with a latency of 0.35ms and staying under 1ms until around 52K IOPS. The A200 peaked at 122K IOPS with a latency of 8.6ms.
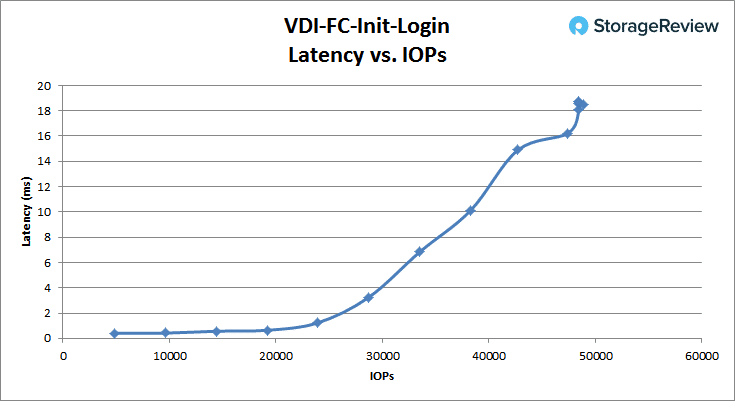
The VDI Full Clone initial login started off at 0.41ms latency and stayed under 1ms until around 22K IOPS. The A200 peaked at 48K IOPS with a latency of 18.6ms.
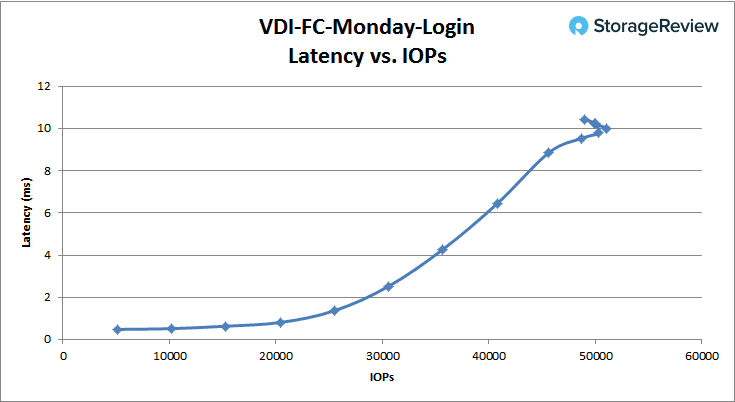
The VDI Full Clone Monday login started off at 0.48ms latency, staying under 1ms until over 20K IOPS. It peaked at 49K IOPS with 10.4ms.
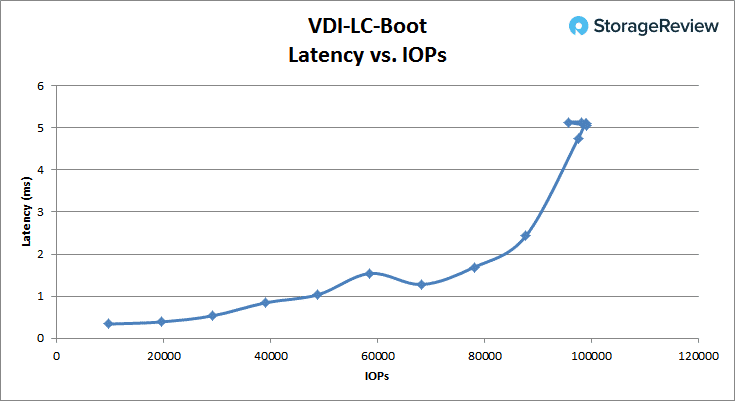
Moving over to VDI Full Clone, the boot test showed performance staying under 1ms up to roughly 49k IOPS, and later topping out at a peak of 95.7k IOPS with an average latency of 5.13ms.
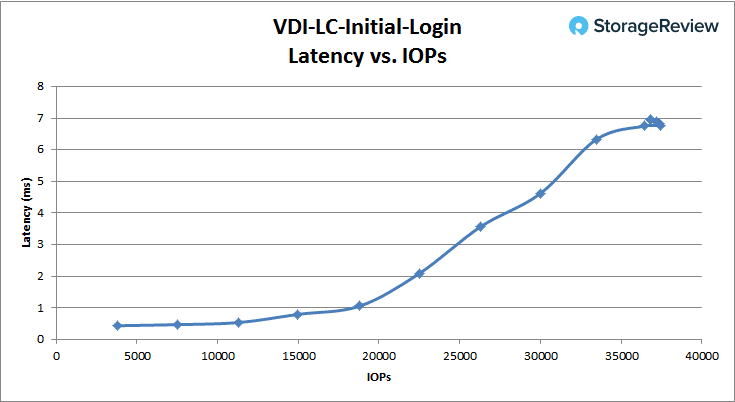
In the Linked Clone VDI profile measuring Initial Login performance, we saw sub-ms latency up till around 18.8k IOPS, where it further increased to 36.8k IOPS at 6.95ms at its peak.
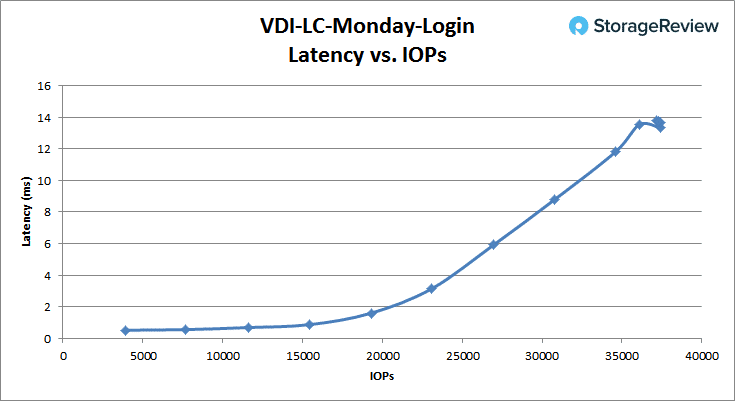
In our last profile looking at VDI Linked Clone Monday Login performance, we see the 1ms barrier transition happening at around 17.5k IOPS, where the workload continued to increase to its peak at 37.4k IOPS and 13.3ms average latency.
VMmark 3
Update 1/31/18: At the time of this initial review, our VMmark testing was not yet finalized. This has since come online and we have posted additional detail about the A200's virtualization performance as a result. The data further enhances our enthusiasm for the unit as it did very well with minimal hit when data reduction services were enabled.
Conclusion
The NetApp AFF A200 is an entry-level array for small organizations that are either looking to begin with or migrate to all-flash storage, or as a nice option for remote/branch offices. The A200 is a dual-controller platform powered by six-core Intel Broadwell-DE processors and upward of 64GB of memory. From a capacity perspective, the A200 has 24 2.5” bays for SAS flash drives. The array supports up to 15TB drives, bringing a total raw capacity up to 367TB, although effective capacity is much higher with data reduction. Moreover, NetApp offers a guaranteed storage efficiency reduction of 4:1. The A200 also can add capacity through a DS224C expansion shelf. The array runs on NetApp’s ONTAP operating system.
Looking at performance, we ran both our usual application workload analyses including SQL Server and Sysbench application workloads, as well as newly introduced VDBench Workload Analysis synthetic benchmarks. NetApp shared their POC Toolkit with us for the review, giving us an easier way to kick off workloads across multiple servers, and making it easier to test faster arrays in a consistent manner going forward.
With our application workloads, we test the array both with and without the inline data reduction services (DR) turned on. In our transactional benchmark for SQL Server, the impact of the DR was minimal with the aggregate score being 12,620.1 TPS raw and 12,583.8 TPS with the DR on. Individual VMs ranged from 3,145.3 TPS to 3,155.1 TPS. With SQL Server average latency, we saw the latency doubling with the DR on; the raw running 11ms (both individual and in aggregate), and the DR having an aggregate of 25ms. With Sysbench, we ran several sets of VM scaling including 4, 8, 16, and 20. At the lowest scale of 4VMs, the NetApp performed quite well, offering strong performance without having to fully saturate the array. The raw performance at 4VMs was 7,175 TPS, with an average latency of 17.84ms and worst-case latency of 48.63ms. On the other end with 20VMs, the raw hit 9,695 TPS with a latency of 66.02ms and a worst-case latency of 172.6ms. Again, there wasn’t a tremendous difference with the DR on, though the raw performed better in all the tests.
Looking at VDBench tests performed with data reduction services turned on, it was impressive to see such strong performance at sub-millisecond latency. In random 4K, the A200 hit 40K IOPS before going over 1ms of latency in write, and in read, the A200 made it to 190K before going over 1ms of latency. This trend continued throughout the rest of the benchmarks. In 64K sequential tests, the A200 was able to hit 48K IOPS below 1ms latency in read, and in write, it hit almost 20K IOPS below 1ms latency (the test also finished with bandwidth speeds of 3.75GB/s read and 1.22GB/s write). We ran three SQL workloads at 100% read, 90% read and 10% write, and 80% read and 20% write, with the A200 hitting scores of 120K IOPS, 80K IOPS, and 60K IOPS respectively, all under 1ms of latency. Running the same three tests with an Oracle workload, we saw the A200 hit 50K IOPS, 100K IOPS, and 65K IOPS under 1ms of latency. We also ran VDI Full Clone and Linked Clone benchmarks for Boot, Initial Login, and Monday Login. The A200 was able to hit 52K IOPS, 22K IOPS, and 20K IOPS under 1ms latency in Full Clone, and 49K IOPS, 18K IOPS, and 17K IOPS under 1ms latency in Linked Clone. NetApp is quick to comment how much optimization goes on behind the scenes to tune for workloads, and you can see this play out in every test we ran on the A200–even with full inline data reduction in play.
After all of these workloads and the many weeks of testing in our lab, one thing is patently clear: the migration to all-flash systems has been transformational for NetApp. Some of the improvement is the uplift flash offers, but a lot of it is thanks to ONTAP improvements. Wherever the credit lies, the end product is absolutely fantastic. The midmarket segment for storage is amazingly competitive; there are a smattering of startups, software-defined options, and the rest of the usual suspects. If you're looking to spend under six figures on storage, you could be forgiven for not looking at NetApp past a casual glance in this segment. That would, however, be a tragic mistake, as the A200 simply crushes. Delivering phenomenal performance under a millisecond is one thing, but here's the important part: NetApp is doing it with data reduction services turned on to get to that 4:1 capacity guarantee. This is not trivial; many other arrays either fall very flat with data reduction on, or simply don't offer it. Our entry-level A200 with the lowest capacity drives offered up 15.5TB across two 7.75TB pools, meaning we'd have a top-end capacity of 62TB if we hit that 4:1 target and over a petabyte with the 15TB drives NetApp offers. Pretty impressive reach for a 2U midmarket box. Performance, combined with a deep and mature set of data services, makes the A200 an easy choice as our second Editor's Choice winner of 2017.
Pros
- Up to 367TB in a 2U footprint (before 4:1 data efficiency)
- Data reduction technologies had minimal impact on application workload benchmarks
- Tremendous performance at sub-millisecond latencies in VDBench
- Mature set of data services and integrations
Cons
- Missing a 1.92TB SSD option to hit the price gap between the 960GB and 3.8TB configurations
The Bottom Line
The NetApp AFF A200 is an ideal unified storage solution for the mid-market that requires an uncompromising mix of application responsiveness, backed by an extensive list of thoroughbred data services.


 Amazon