

The NetApp C190 is an all-flash unified storage array targeted toward SMBs and edge use cases that comes in a compact 2U form-factor. The C190 uses NetApp’s feature-rich ONTAP software, delivering the robust data services NetApp users have come to appreciate. The array is designed specifically for the channel, giving resellers a low-cost option in the crowded entry-storage market, without needing to skimp on premium features such as data reduction.
The NetApp C190 launched last summer in an attempt to accomplish two goals. First, the C190 helps NetApp’s large customers service data storage needs at the edge. It’s a cost-effective solution that runs the full ONTAP stack. The second objective for the C190 was to appeal to smaller customers that viewed NetApp solutions as potentially too expensive. In both cases, NetApp appears to be executing well with the C190. It sounds like somewhere around half of C190 sales are net new customers for NetApp. This clearly splits the difference in NetApp’s dual-mode strategy.
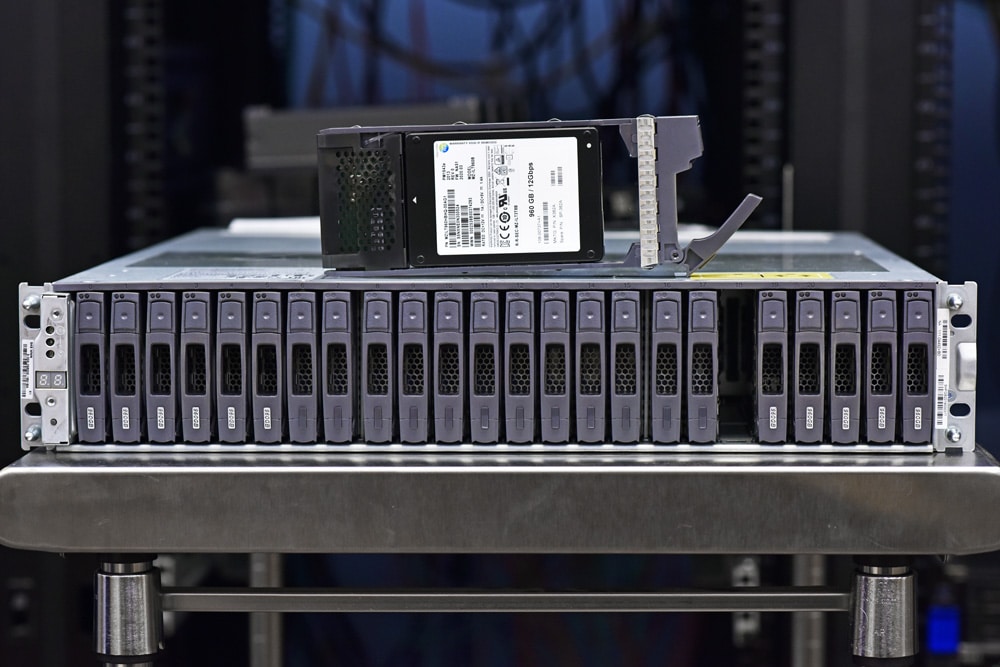
To help keep the C190 cost effective, NetApp has done a few things. First, they’ve standardized on 960GB NVMe SSDs, meaning they don’t need to stock and support a number of SKUs. Second, while it runs ONTAP and no services have been removed, the C190 can’t be expanded physically beyond its 24 bays. This provides some buffer between it and NetApp’s mainline A-Series arrays, like the A200 family. Even so, assuming a 3:1 data reduction rate, customers can still expect to get ~55TB of capacity out of a C190 filled with 24 SSDs. The C190 can be configured with fewer drives as well though, as 8, 12, and 18 drive configs are also available.
Should capacity be a concern, NetApp has plenty of options including support for cloud tiering and cloud-based volumes. The C190 supports all major public clouds such as Google Cloud, Amazon Web Services (AWS), Microsoft Azure, IBM Storage Cloud, and Alibaba Cloud. The net result is that customers can leverage low-cost cloud offerings to extend their C190’s capacity, mitigating worries that their data growth may outpace what the C190 can handle physically.
Given the target and the fact that so many customers for the C190 are new to NetApp, setup and management simplicity are key. Even if the channel partner does the initial installation, making the process of onboarding a C190 simple is important to grease the wheels to reduce the friction. NetApp claims workloads can be provisioned in under 10 minutes and they provide a three-page poster to get systems online. Our lab may not be the best to compare against since we’ve seen a half-dozen ONTAP systems here in the lab, so we went from unboxing to LUN-provisioned a little faster. NetApp provides a wizard to get online quickly, along with built-in workflows for popular applications like Oracle, Microsoft SQL, MySQL, MongoDB, and VMware.
For our review system, we have a C190 that’s half-populated with the 960GB SSDs. The dual controllers are cabled together with 10GbE (switchless) and we’re sharing storage over the eight onboard 16GB FibreChannel ports, four per controller. While NetApp doesn’t list a suggested price for these systems, we’re told these can be had for under $20,000.
NetApp AFA C190 Specifications
| Form Factor | 2U |
| CPU | 16 cores |
| Memory | 64GB |
| Max Effective capacity | 55TB with 3:1 compression |
| Drives | Up to 24 bays with 960GB SSDs |
| Network Configurations | Ethernet (10GbE): 4x 10BASE-T (RJ45) ports or Unified (16Gb FC or 10GbE): 4x UTA2 ports |
| Management | ONTAP 9.6GA or greater |
| I/O Ports | 1 x micro-B USB console port 1x 1GbE management port 1x Type-A USB port |
| Protocols | FC, FCoE, iSCSI, NFS, pNFS, SMB |
| Host OS version | Windows 2000, Windows Server 2003, Windows Server 2008, Windows Server 2012, Windows Server 2016, Linux, Oracle Solaris, AIX, HPE UX, macOS, VMware, ESX |
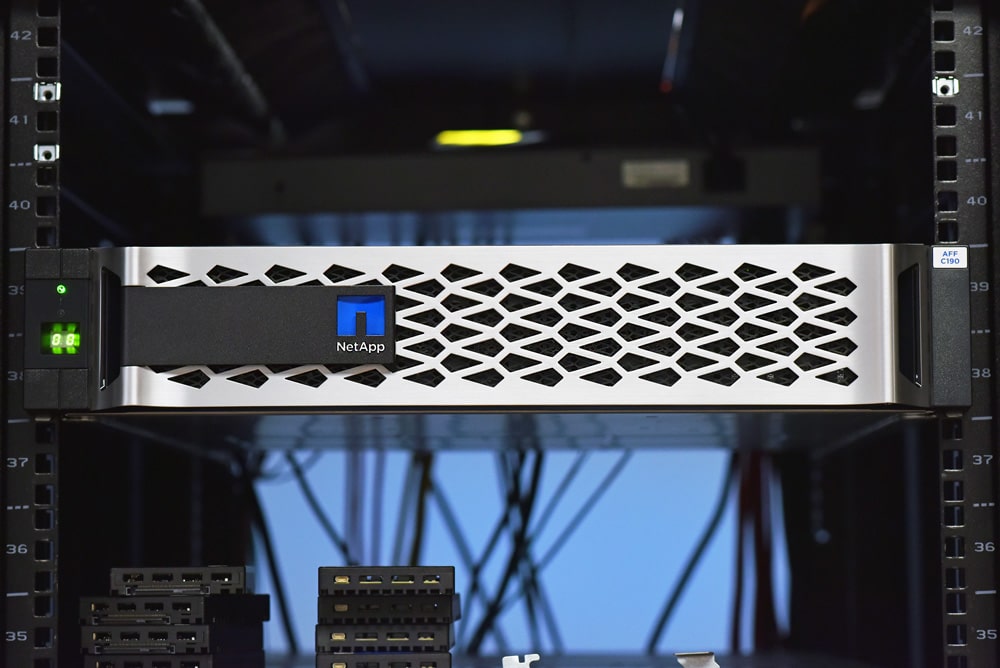
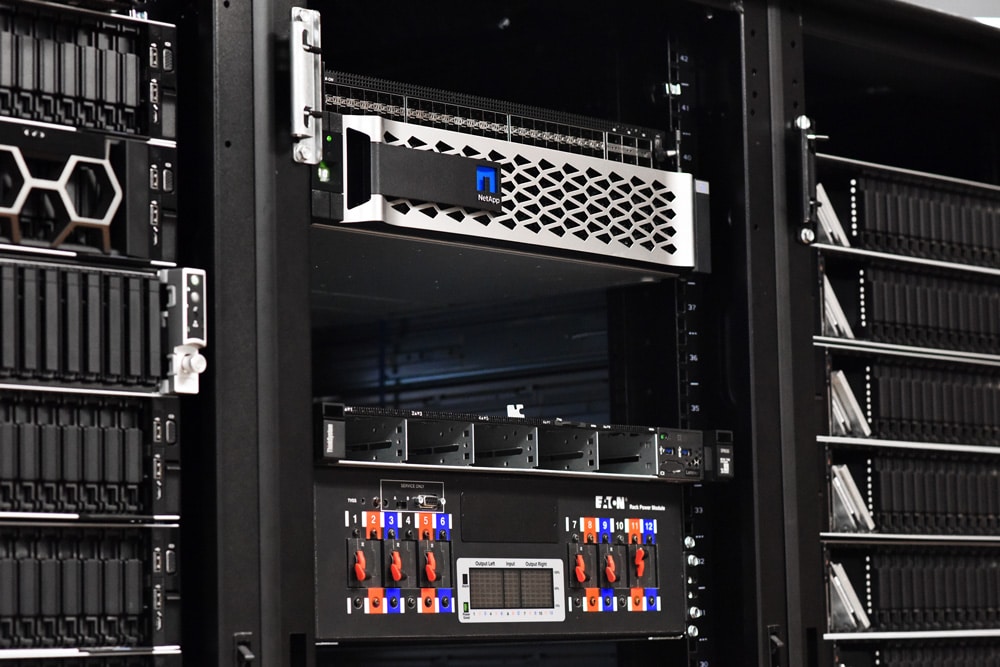
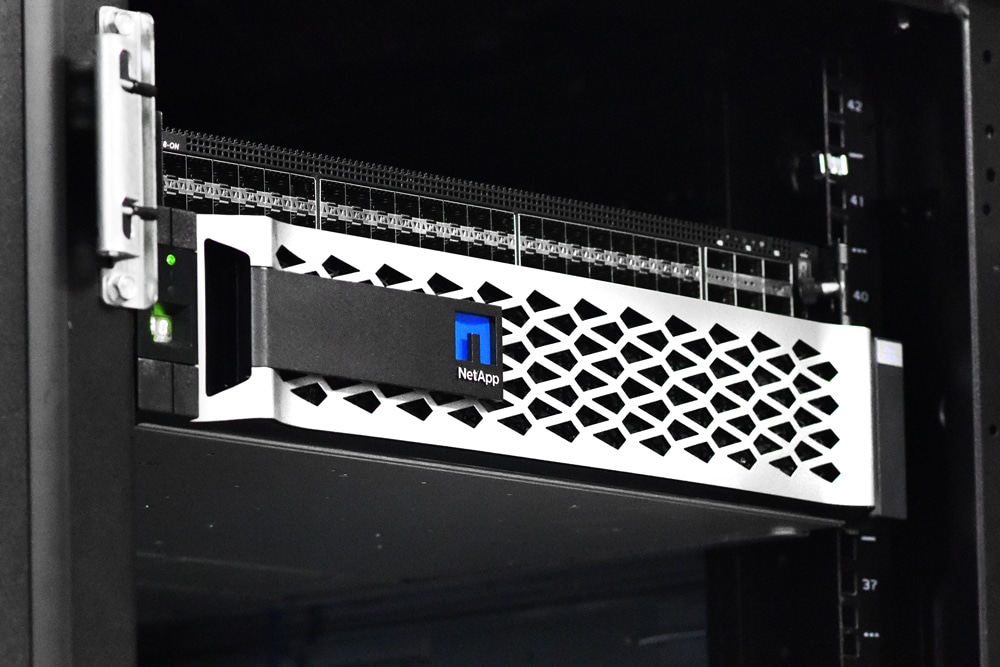
NetApp C190 Design and Build
When NetApp picks a design they like, they really stick to it. The front of the array has the distinct gray drive bays that NetApp has become known for. The 24-bay configuration has the bays filled up in the front of the array, although depending on how many SSDs a customer opts to purchase for their model, you will find a mix of populated versus blank drive caddies.
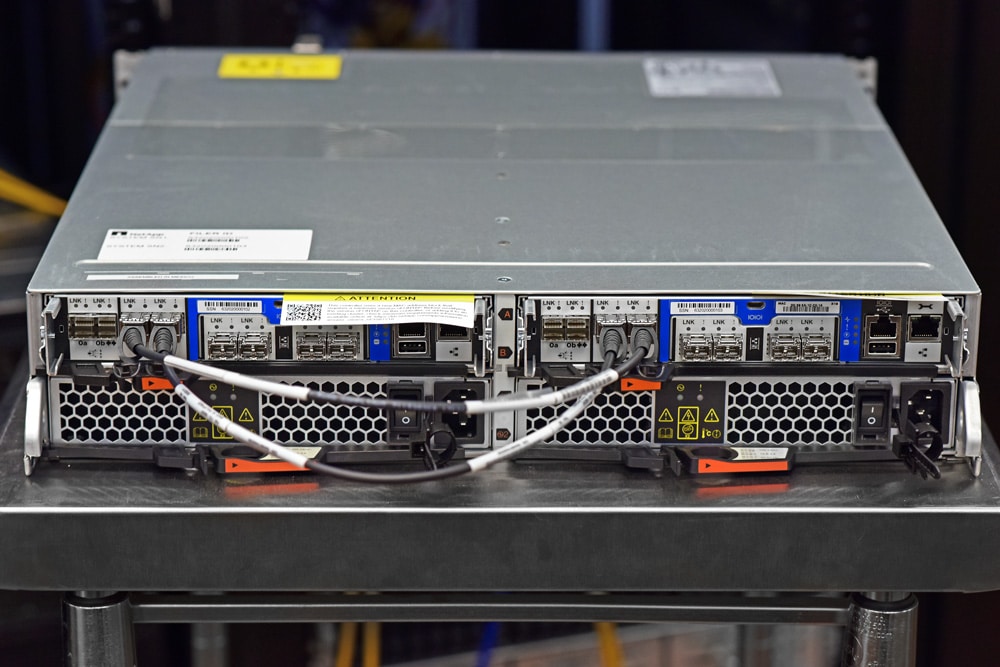
Flipping around to the rear, there are two different designs depending on how the networking is configured; we used the unified, switchless, configuration. The back has a split down the middle for each host with a mirror image on either side. The bottom has the fans and PSUs. At the top of each side are the networking and interconnects, as well as the management ports and USB Ports on the right side.
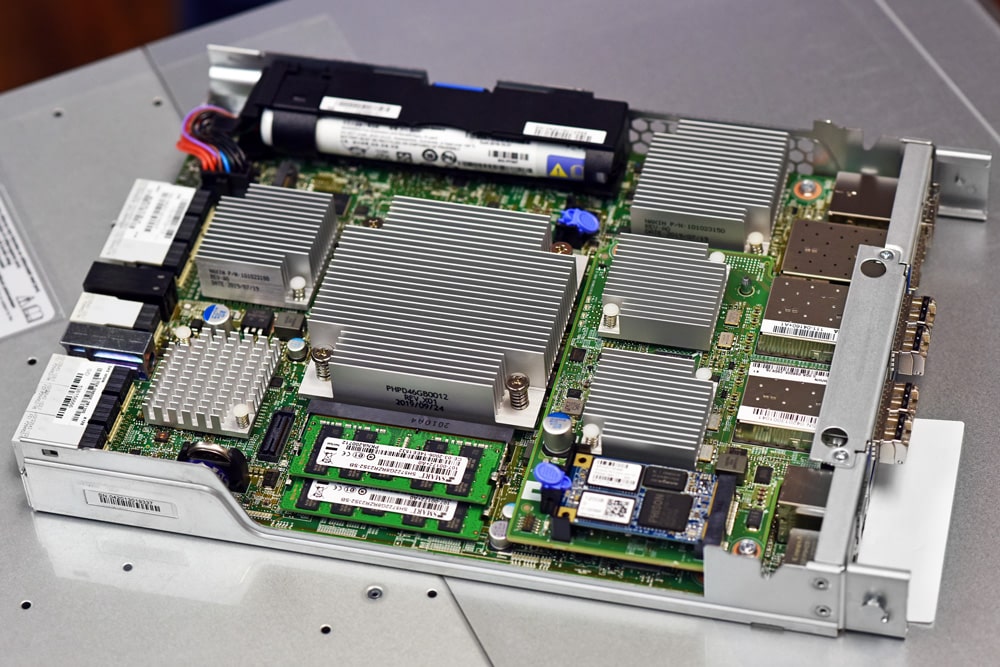
 Inside each controller, we see the dense, yet compact design NetApp and other Tier1 vendors are known for. No space is left unused, with attention to cooling, thermal management, and power protection visible. For an entry all-flash array, customers won’t need to worry about platform stability under a wide range of operating conditions.
NetApp C190 Performance
NetApp AFF C190 Test Configuration
- ONTAP 9.7P6
- 12 x 960GB SSDs (Two RAID-DP Aggregates)
- 8 x 16Gb FC Connectivity
SQL Server Performance
StorageReview’s Microsoft SQL Server OLTP testing protocol employs the current draft of the Transaction Processing Performance Council’s Benchmark C (TPC-C), an online transaction processing benchmark that simulates the activities found in complex application environments. The TPC-C benchmark comes closer than synthetic performance benchmarks to gauging the performance strengths and bottlenecks of storage infrastructure in database environments.
Each SQL Server VM is configured with two vDisks: 100GB volume for boot and a 500GB volume for the database and log files. From a system-resource perspective, we configured each VM with 16 vCPUs, 64GB of DRAM, and leveraged the LSI Logic SAS SCSI controller. While our Sysbench workloads tested previously saturated the platform in both storage I/O and capacity, the SQL test looks for latency performance.
This test uses SQL Server 2014 running on Windows Server 2012 R2 guest VMs and is stressed by Dell’s Benchmark Factory for Databases. While our traditional usage of this benchmark has been to test large 3,000-scale databases on local or shared storage, in this iteration we focus on spreading out four 1,500-scale databases evenly across our servers.
SQL Server Testing Configuration (per VM)
- Windows Server 2012 R2
- Storage Footprint: 600GB allocated, 500GB used
- SQL Server 2014
-
- Database Size: 1,500 scale
- Virtual Client Load: 15,000
- RAM Buffer: 48GB
- Test Length: 3 hours
-
- 2.5 hours preconditioning
- 30 minutes sample period
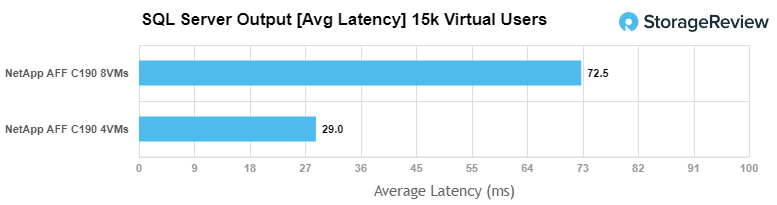
For our average latency SQL Server benchmark, we tested both 4VMs and 8VMs and saw aggregate scores of 29ms and 72.5ms respectively.
Sysbench MySQL Performance
Our first local-storage application benchmark consists of a Percona MySQL OLTP database measured via SysBench. This test measures average TPS (Transactions Per Second), average latency, and average 99th percentile latency as well.
Each Sysbench VM is configured with three vDisks: one for boot (~92GB), one with the pre-built database (~447GB), and the third for the database under test (270GB). From a system resource perspective, we configured each VM with 16 vCPUs, 60GB of DRAM, and leveraged the LSI Logic SAS SCSI controller.
Sysbench Testing Configuration (per VM)
- CentOS 6.3 64-bit
- Percona XtraDB 5.5.30-rel30.1
-
- Database
- Tables: 100
- Size: 10,000,000
- Threads: 32
- RAM Buffer: 24GB
- Database
- Test Length: 3 hours
-
- 2 hours preconditioning 32 threads
- 1 hour 32 threads
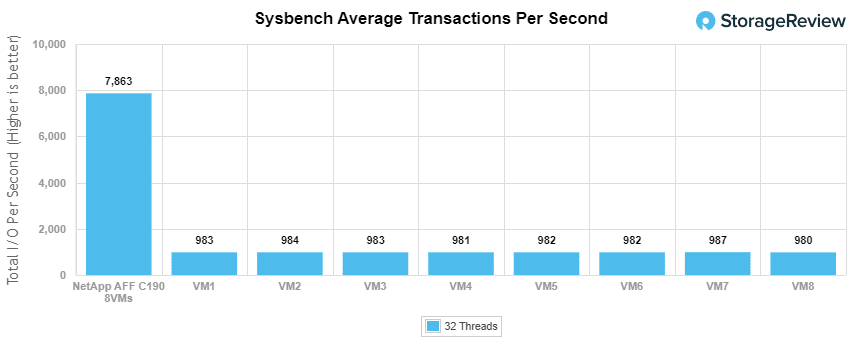
With the Sysbench OLTP, we tested 8VMs for an aggregate score of 7,863 TPS with individual VMs running from 980 TPS to 987 TPS.
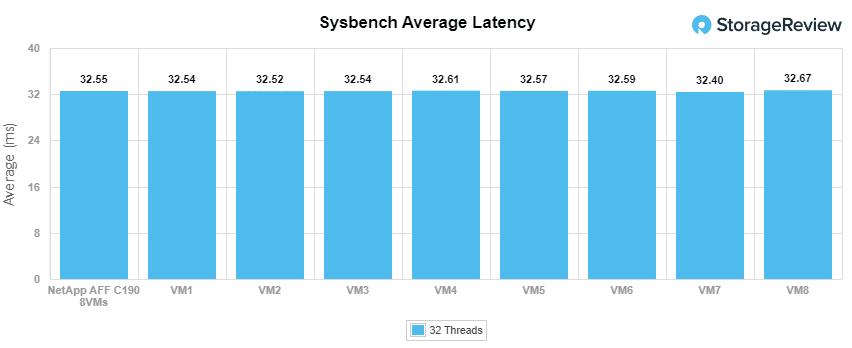
For Sysbench average latency, we saw an aggregate score of 32.6ms with individual VMs ranging from 32.4ms to 32.67ms.
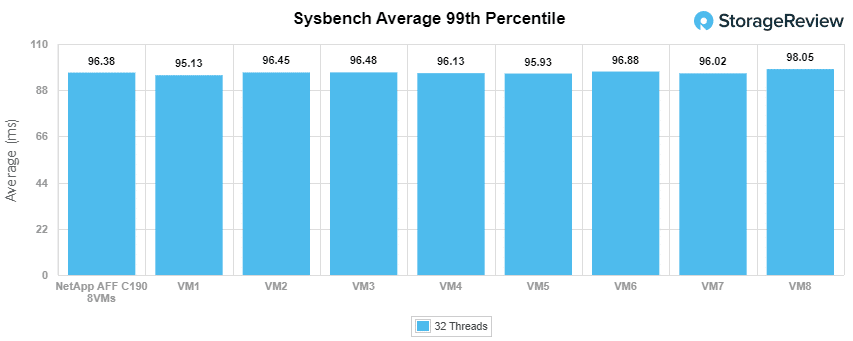
For our worst-case scenario latency (99th percentile), the C190 had an aggregate latency of 96.4ms with individual VMs ranging from 95.13ms to 98.05ms.
VDBench Workload Analysis
When it comes to benchmarking storage arrays, application testing is best, and synthetic testing comes in second place. While not a perfect representation of actual workloads, synthetic tests do help to baseline storage devices with a repeatability factor that makes it easy to do apples-to-apples comparison between competing solutions. These workloads offer a range of different testing profiles ranging from “four corners” tests, common database transfer size tests, as well as trace captures from different VDI environments. All of these tests leverage the common vdBench workload generator, with a scripting engine to automate and capture results over a large compute testing cluster. This allows us to repeat the same workloads across a wide range of storage devices, including flash arrays and individual storage devices.
Profiles:
- 4K Random Read: 100% Read, 128 threads, 0-120% iorate
- 4K Random Write: 100% Write, 64 threads, 0-120% iorate
- 32K Random Read: 100% Read
- 32K Random Write: 100% Write
- 64K Sequential Read: 100% Read, 16 threads, 0-120% iorate
- 64K Sequential Write: 100% Write, 8 threads, 0-120% iorate
- Synthetic Database: SQL and Oracle
- VDI Full Clone and Linked Clone Traces
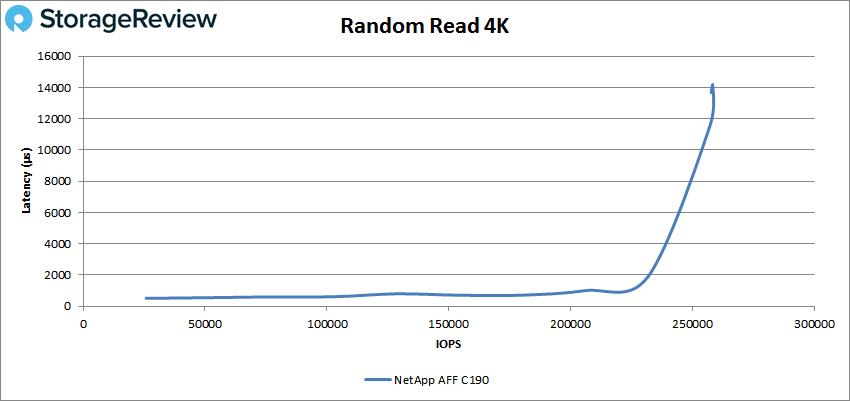
With random 4K read, the NetApp C190 started off with sub-millisecond latency until about 200K IOPS and went on to peak at about 260K IOPS and 13ms latency before dropping off a bit.
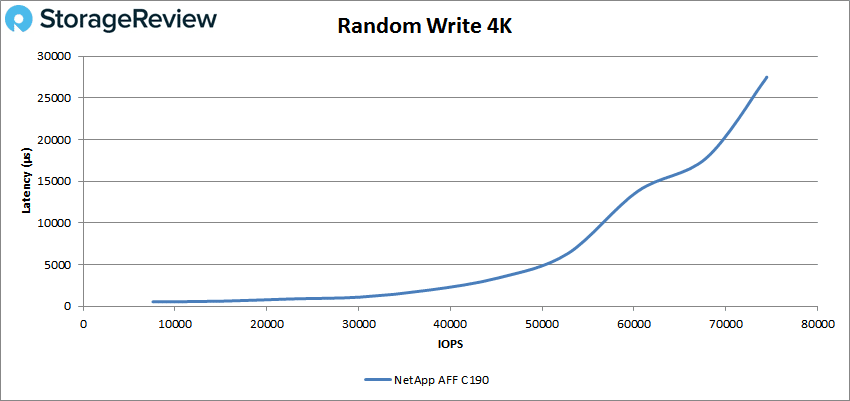
4K random write started off below 1ms as well, before going over at about 25K IOPS and going on to peak at 74,410 IOPS at a latency of 27.4ms.
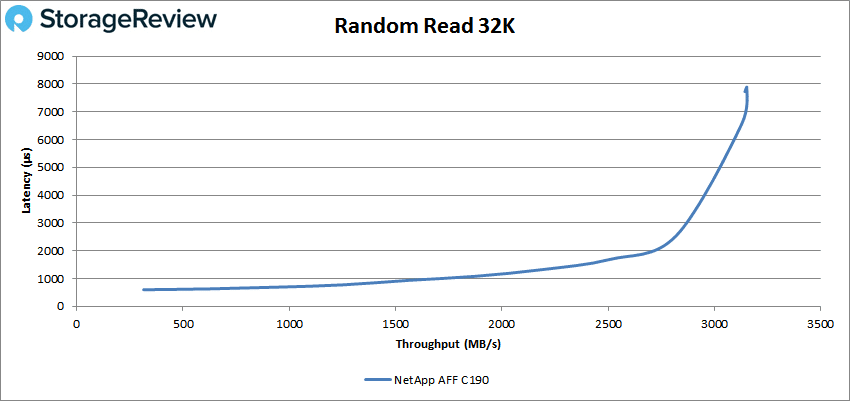
Next we look at our 32K random I/O test. For read, the C190 had sub-millisecond latency performance until about 50K IOPS and went on to peak at 100,894 IOPS with a latency of 7.7ms.
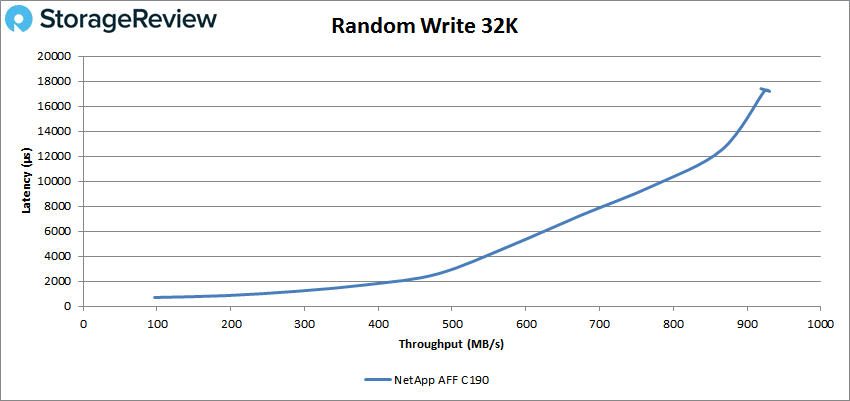
32K random write briefly saw latency under 1ms and went on to peak at 29,772 IOPS at a latency of 17.2ms.
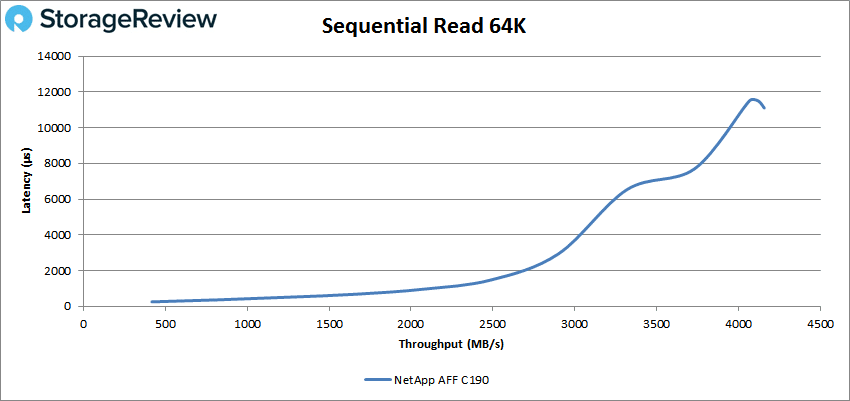
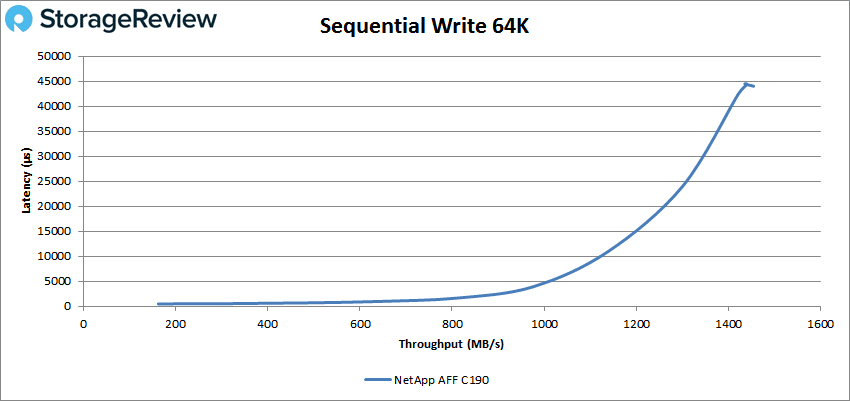
Next up was sequential workloads where we looked at 64K. For 64K read, the array stayed under 1ms until roughly 35K IOPS or 2.2GB/s. The C190 peaked at 66,472 IOPS or 4.2GB/s at 11.1ms for latency.
With 64K write, we saw a peak of 23,365 IOPS or 1.5GB/s with a latency of 44ms.
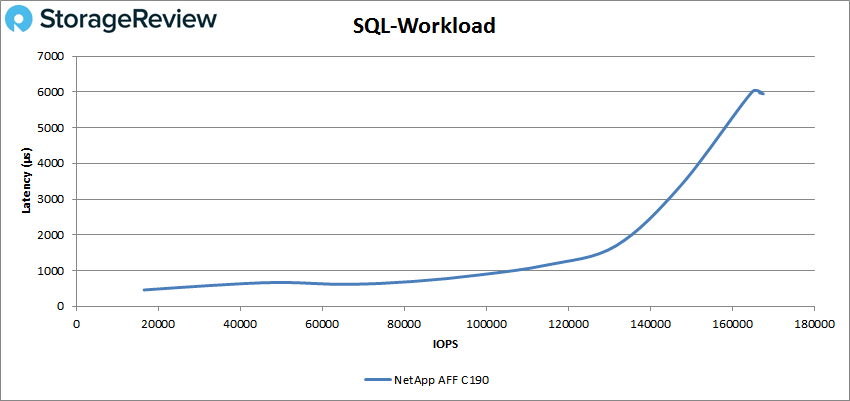
Our next set of tests are our SQL workloads: SQL, SQL 90-10, and SQL 80-20. Starting with SQL, the NetApp C190 stayed under 1ms until over 100K IOPS and went on to peak at 167,531 IOPS and a latency of 5.9ms.
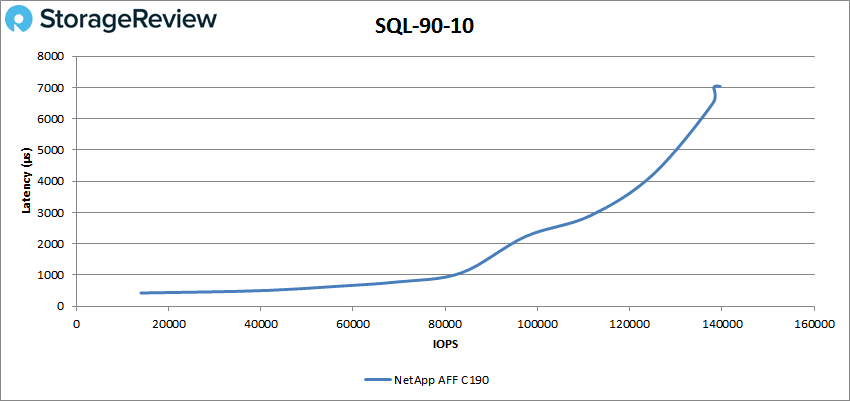
SQL 90-10 saw a peak of 139,602 IOPS with a latency of 7.03ms. The C190 had sub-millisecond latency here until about 80K IOPS.
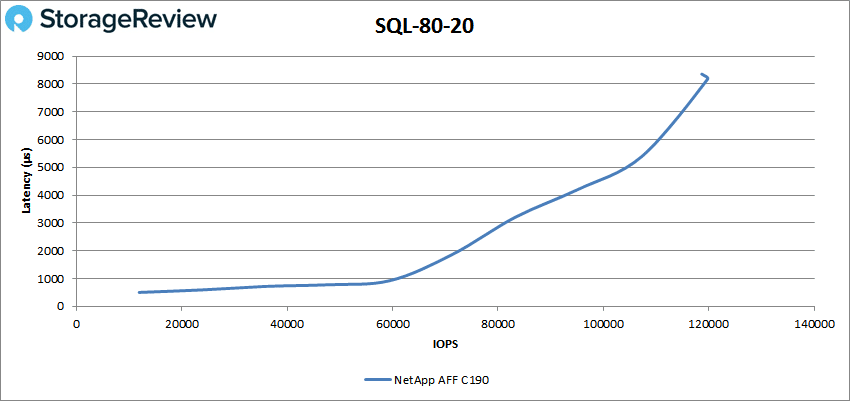
With SQL 80-20, we saw sub-millisecond latency performance until about 60K IOPS and a peak of 119,757 IOPS with a latency of 8.2ms.
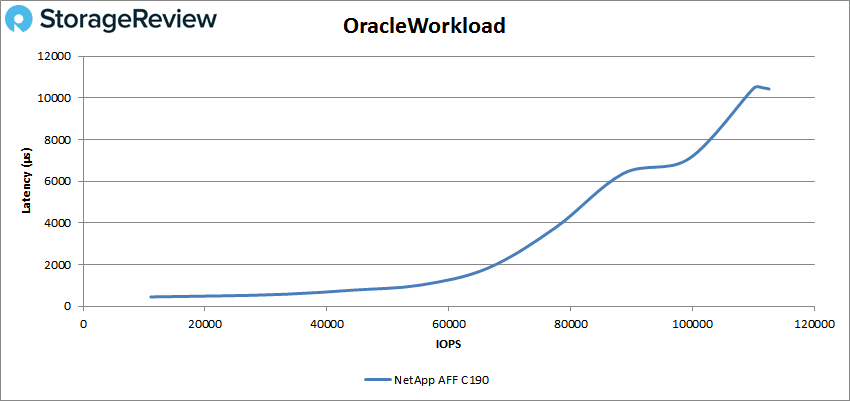
Next up are our Oracle workloads: Oracle, Oracle 90-10, and Oracle 80-20. Starting with Oracle, the C190 stayed under 1ms latency until about 50K IOPS and went on to peak at 112,597 IOPS with a latency of 10.4ms.
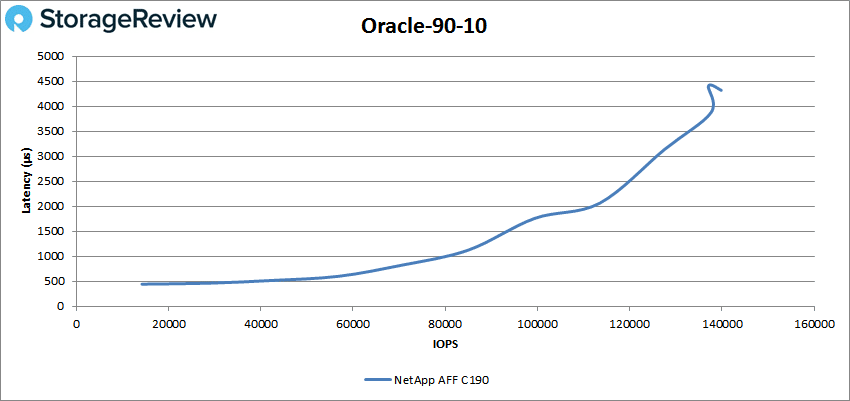
Oracle 90-10 saw sub-millisecond latency until about 80K IOPS and a peak of 139,851 IOPS at a latency of 4.3ms.
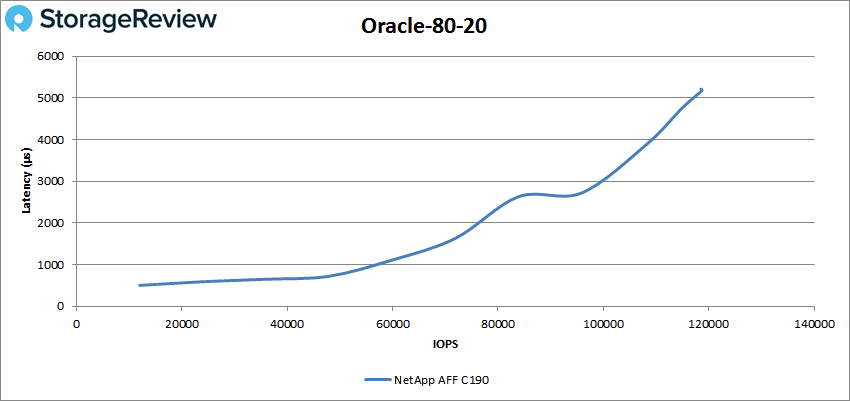
For Oracle 80-20, the array ran with latency under 1ms until just shy of 60K IOPS and went on to give us a peak performance of 118,669 IOPS and 5.2ms for latency.
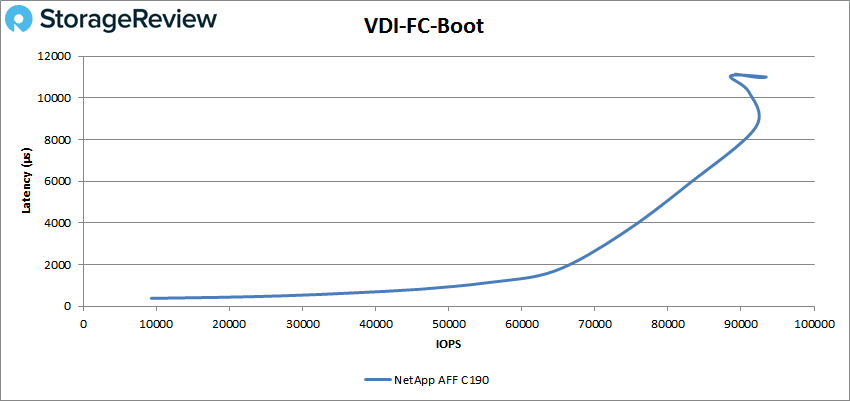
Next, we switched over to our VDI clone test, Full and Linked. For VDI Full Clone (FC) Boot, the NetApp C190 peaked at 93,335 IOPS with a latency of 11ms.
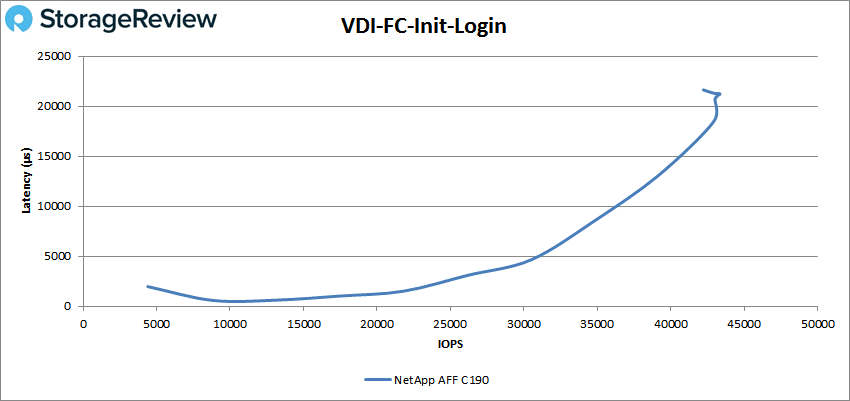
For the VDI FC Initial Login, the array peaked at 43,024 IOPS with a latency of 20.7ms.
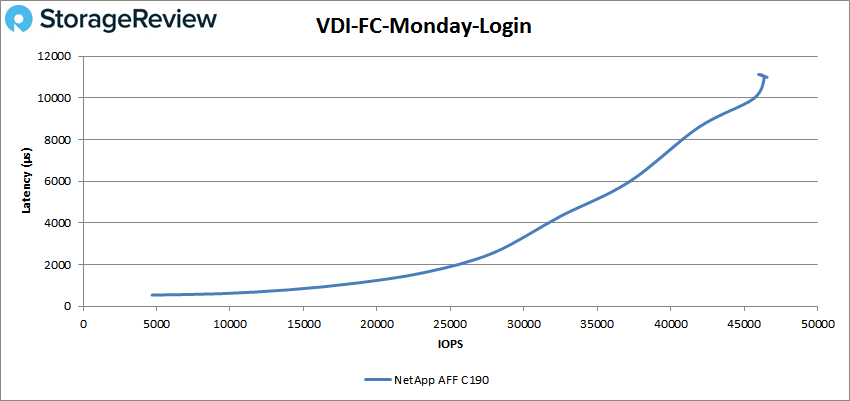
Our last VDI FC benchmark is Monday Login where we saw a peak of 46,567 IOPS with a latency of 11ms.
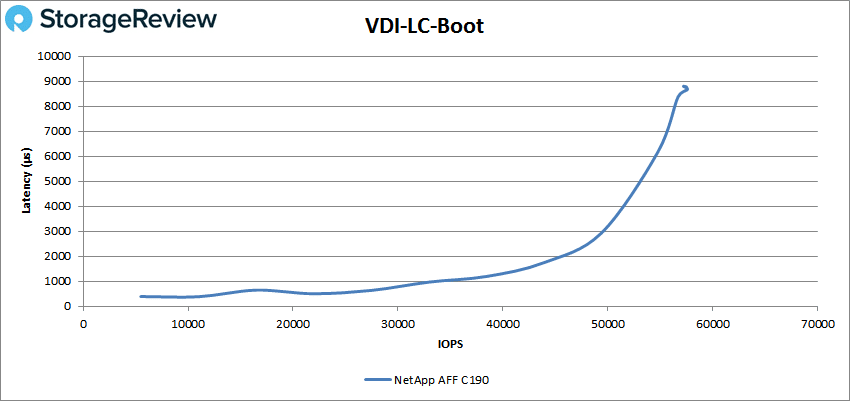
Switching to VDI Linked Clone (LC) Boot, the C190 started and stayed under 1ms until it was north of 30K IOPS and peaked at 57,573 IOPS with a latency of 8.7ms.
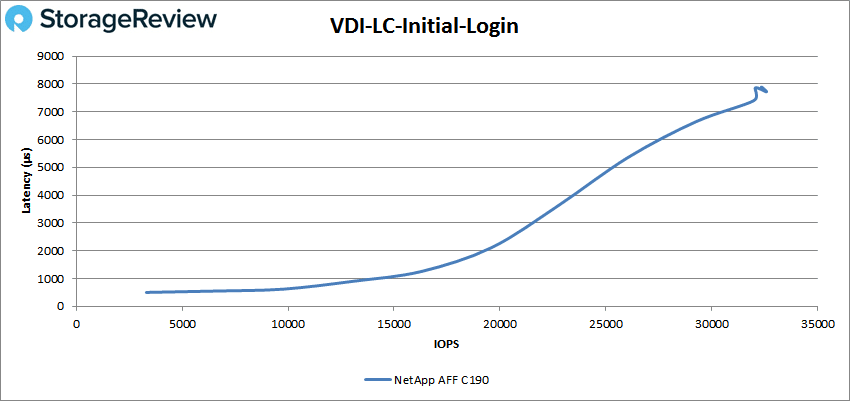
VDI LC Initial Login again saw sub-millisecond performance, this time until about 15K IOPS. The array went on to peak at 32,579 IOPS and 7.7ms for latency.
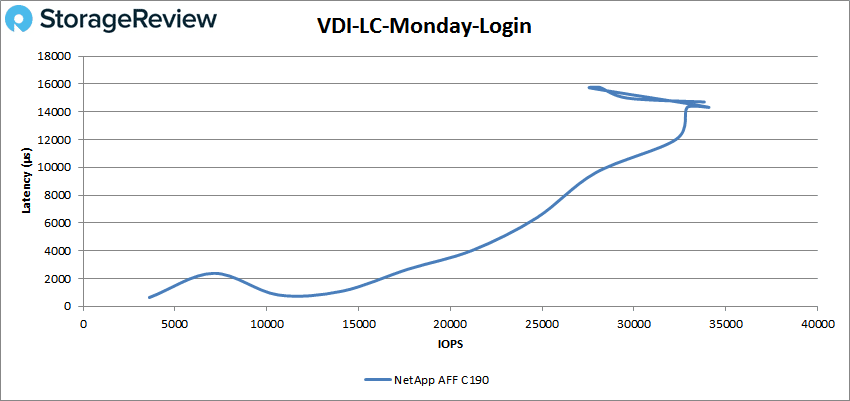
Finally, VDI Monday Login saw a peak of 33,976 IOPS and a latency of 14.4ms.
Conclusion
The NetApp C190 is the company’s all-flash unified storage array aimed at both SMBs and edge use cases. The C190 is a 2U dual-controller platform that features everything ONTAP has to offer. Smaller and new customers will be pleased to find that the C190 is easy to set up and manage with the company claiming workloads can be provisioned in fewer than 10 minutes.
As far as performance goes, we ran our Application Analysis Workloads as well as our VDBench tests. For Application Analysis Workloads, we ran our SQL Server average latency test and the C190 hit 72.5ms with 8VMs, and 29ms with 4VMs. With Sysbench, we saw aggregate scores of 7,863 TPS, and an average latency of 32.55ms and a worst-case scenario latency of 96.38ms.
For VDBench, the array started most benchmarks off with sub-millisecond latency and but all tests finished over 1ms. In our random 4K tests, we saw a peak of 260K IOPS read and 74K IOPS write. For 32K random, we saw peaks of 101K IOPS read and 30K IOPS write. For sequential, we ran our 64K tests and saw 2.2GB/s read and 1.5GB/s write.
With SQL we saw 168K IOPS, 80K IOPS in SQL 90-10, and 120K IOPS in SQL 80-20. Turning to Oracle, we saw peaks of 113K IOPS, 140K IOPS for Oracle 90-10, and 119K IOPS in Oracle 80-20. In our VDI Clone tests, we ran Full Clone and Linked Clone. For Full Clone, we saw peaks of 93K IOPS for boot, 43K IOPS for Initial Login, and 47K IOPS for Monday Login. In Linked clone, we saw 58K IOPS for boot, 33K IOPS for Initial Login, and 34K IOPS for Monday Login.
The NetApp AFF C190 brings the deep and long-standing enterprise data features from ONTAP to a new, smaller capacity platform. The C190 is designed as a channel play, getting NetApp solutions out to a much wider audience. This is a pretty big deal for NetApp for a variety of reasons. Primary amongst them is that many don’t realize that a system like this can be purchased for under $20K. NetApp channel partners now have an enterprise system to go fight in the crowded entry-storage marketing place that’s dominated by NAS systems or rebadged storage controllers. For existing NetApp customers, the C190 gives them a low-cost solution to place at the edge, while maintaining the same ONTAP platform for management.
The only knock on the C190 is that NetApp has reduced its ability to expand, buffering the C190 from the A200 family that sits above. The C190 offers limited SSD options and can’t be expanded past 24 drives. That said, with data reduction, a fully populated chassis can deliver around 55TB of effective capacity (3:1 reduction). The C190’s capacity can also be expanded easily via the cloud thanks to cold-data tiering with FabricPools.
At the end of the day, the C190 is a really smart release from NetApp. It’s not going to get the attention that a glitzy high-end NVMe array would garner. That’s not the C190’s job. The C190 was designed to give the channel ammo in the wildly competitive entry-storage space. The C190 delivers here with a platform that’s inexpensive, yet rich in data services. This combo, paired with strong performance, makes the C190 one of our favorites in the entry-storage market.


 Amazon