

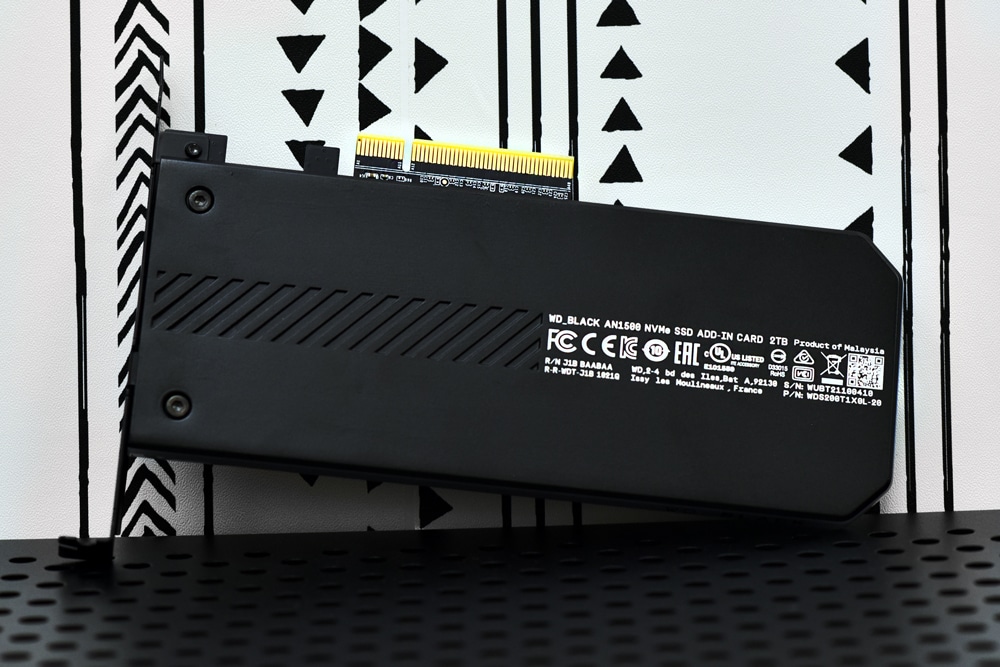
Today Western Digital expanded its WD_Black gaming portfolio with even more drives to speed up games and give gamers more capacity for storing content. Of the items released, one aimed particularly at PC gamers is the WD_Black AN1500. The AN1500 is an AIC SSD that fits in a PCIe slot and is compatible with over 35 gaming motherboards. While the AN1500 is a PCIe Gen3 SSD, the company promises Gen4-like performance.
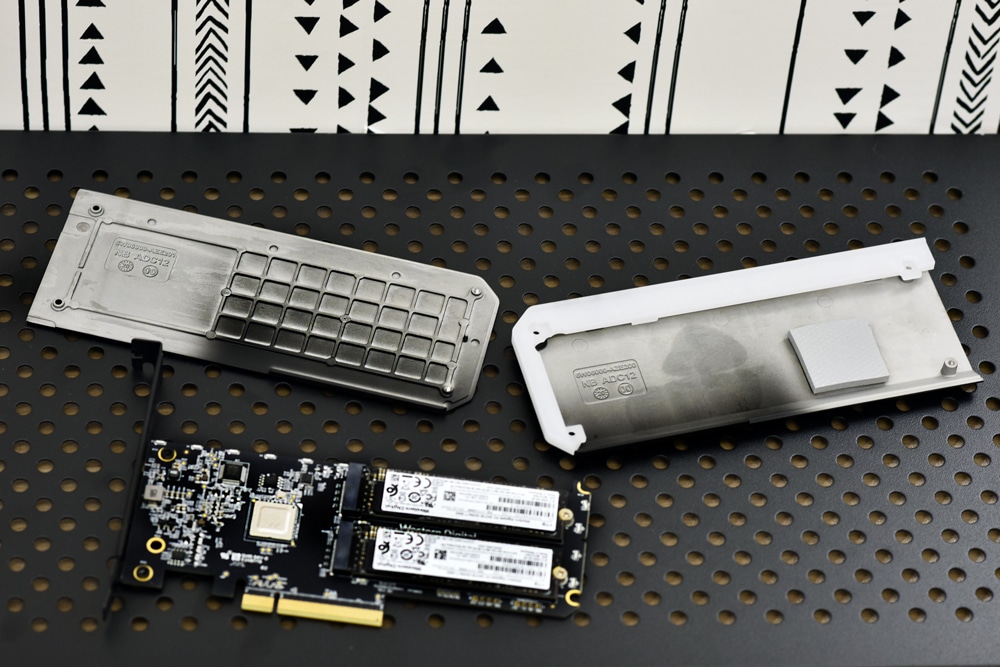
This NVMe AIC SSD brings much faster speeds to gaming to cut down on wait times (assuming you are not waiting on something on the other end in an online game). The WD_Black AN1500 has claimed speeds of 6.5GB/s read and 4.1GB/s write, which is close to PCIe Gen4 levels of performance while staying on a Gen3 platform. With up to 4TB of capacity, users can store their most played games locally for faster load times. The card slots into a PCIe slot on the user’s rig, and leverages RAID0 over two SSDs to help it hit the max speeds. There is an integrated heatsink to help maintain peak performance and users can leverage WD_Black Dashboard software to customize their games.
The Drive is available in 1TB, 2TB, and 4TB for $229.99, $449.99, and $849.99 respectively. For this review we will be looking at the 2TB version.
WD_Black AN1500 Specifications
| Capacities | 1TB, 2TB, 4TB |
| Form Factor | PCI Express Card |
| Dimensions (H x W x L) | 13mm X 72mm X 176mm |
| Weight | 0.21 kg (0.47 lb) |
| Operating Temperature | 5°C to 35°C |
| Non-operating Temperature | -20°C to 65°C |
| Interface | PCIe Gen3 x8 |
| Power | |
| Power Consumption Read Up to (Active) (W) | 15.7 |
| Power Consumption Write Up to (Active) (W) | 12.8 |
| Power Consumption Up to (Idle) (W) | 8.5 |
| Certifications | FCC, CE, CB, UL |
| Limited Warranty | 5 Years |
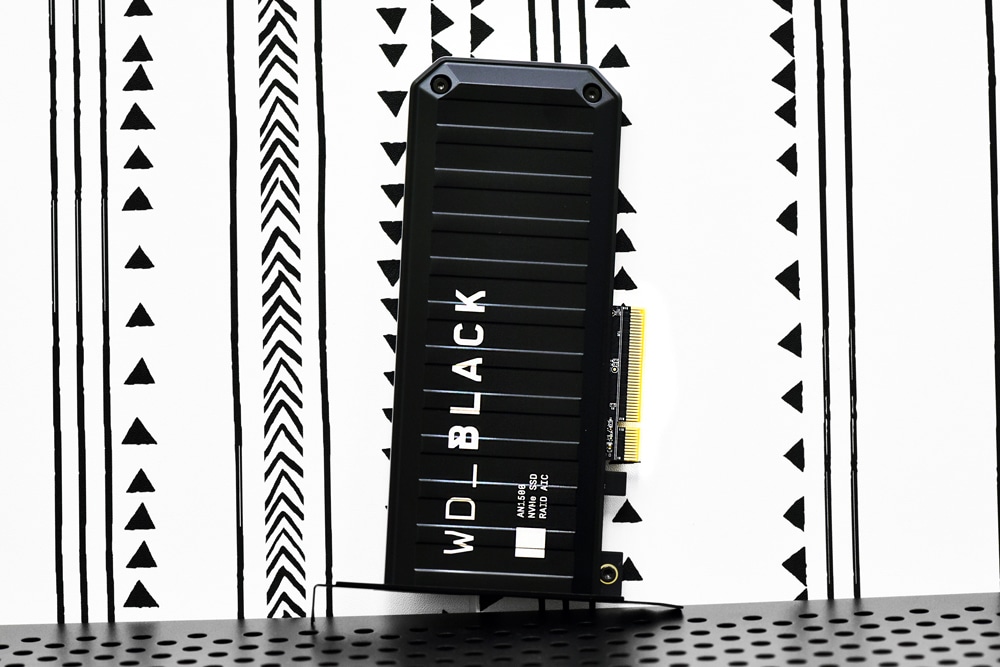
Design and Build
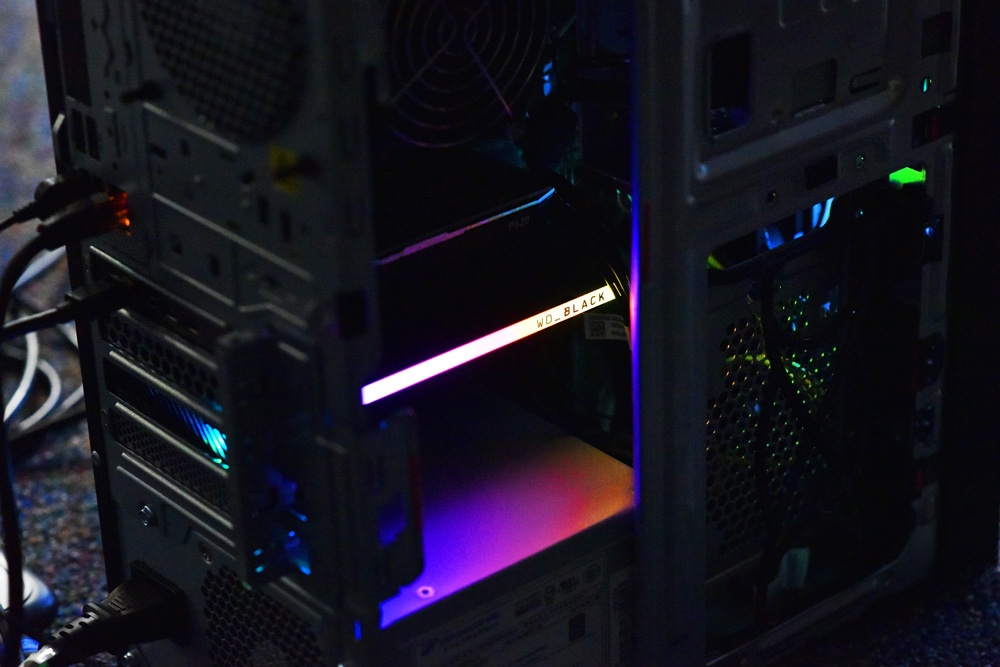
For an internal drive, the WD_Black AN1500 has the motif of the rest of the WD_Black line. An interesting feature of the drive is a customizable RGB lighting. Users can choose from 13 LED patterns that are programable from the above mentioned WD_Black Dashboard.
Performance
Testbed
The test platform leveraged in these tests is a Dell PowerEdge R740xd server. We measure SATA performance through a Dell H730P RAID card inside this server, although we set the card in HBA mode only to disable the impact of the RAID card cache. NVMe is tested natively through an M.2 to PCIe adapter card. The methodology used better reflects the end-user workflow with the consistency, scalability, and flexibility testing within virtualized server offers. A large focus is put on drive latency across the entire load range of the drive, not just at the smallest QD1 (Queue-Depth 1) levels. We do this because many of the common consumer benchmarks don’t adequately capture end-user workload profiles.
SQL Server Performance
Each SQL Server VM is configured with two vDisks: 100GB volume for boot and a 500GB volume for the database and log files. From a system resource perspective, we configured each VM with 16 vCPUs, 64GB of DRAM, and leveraged the LSI Logic SAS SCSI controller. While our Sysbench workloads tested previously saturated the platform in both storage I/O and capacity, the SQL test is looking for latency performance.
This test uses SQL Server 2014 running on Windows Server 2012 R2 guest VMs and is stressed by Quest’s Benchmark Factory for Databases. StorageReview’s Microsoft SQL Server OLTP testing protocol employs the current draft of the Transaction Processing Performance Council’s Benchmark C (TPC-C), an online transaction-processing benchmark that simulates the activities found in complex application environments. The TPC-C benchmark comes closer than synthetic performance benchmarks to gauging the performance strengths and bottlenecks of storage infrastructure in database environments. Each instance of our SQL Server VM for this review uses a 333GB (1,500 scale) SQL Server database and measures the transactional performance and latency under a load of 15,000 virtual users.
SQL Server Testing Configuration (per VM)
- Windows Server 2012 R2
- Storage Footprint: 600GB allocated, 500GB used
- SQL Server 2014
- Database Size: 1,500 scale
- Virtual Client Load: 15,000
- RAM Buffer: 48GB
- Test Length: 3 hours
- 2.5 hours preconditioning
- 30 minutes sample period
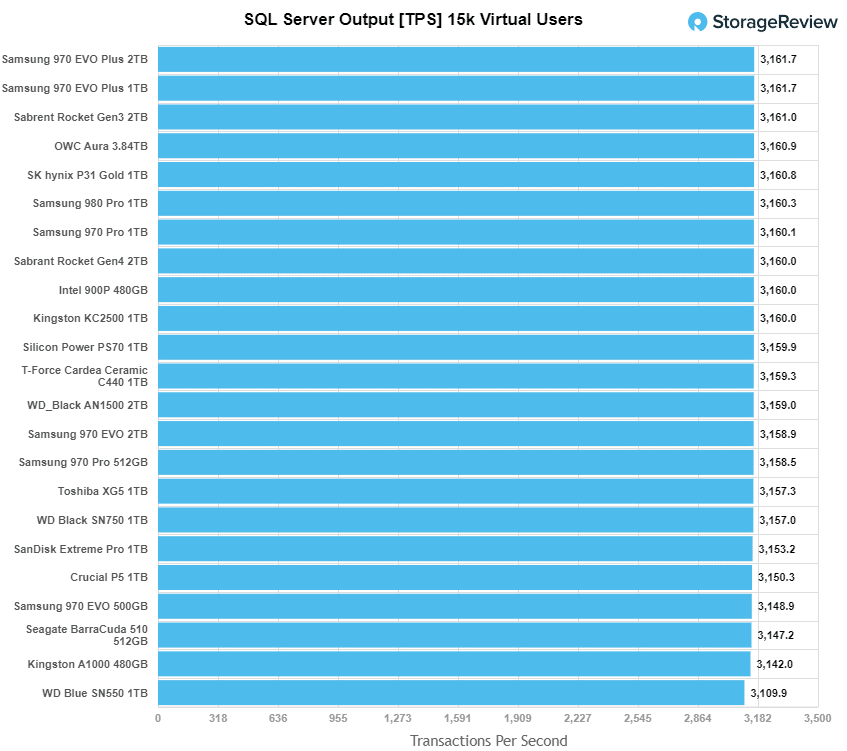
For our SQL Server transactional benchmark, the WD_BLACK AN1500 had a score of 3,159 TPS putting it squarely in the middle.
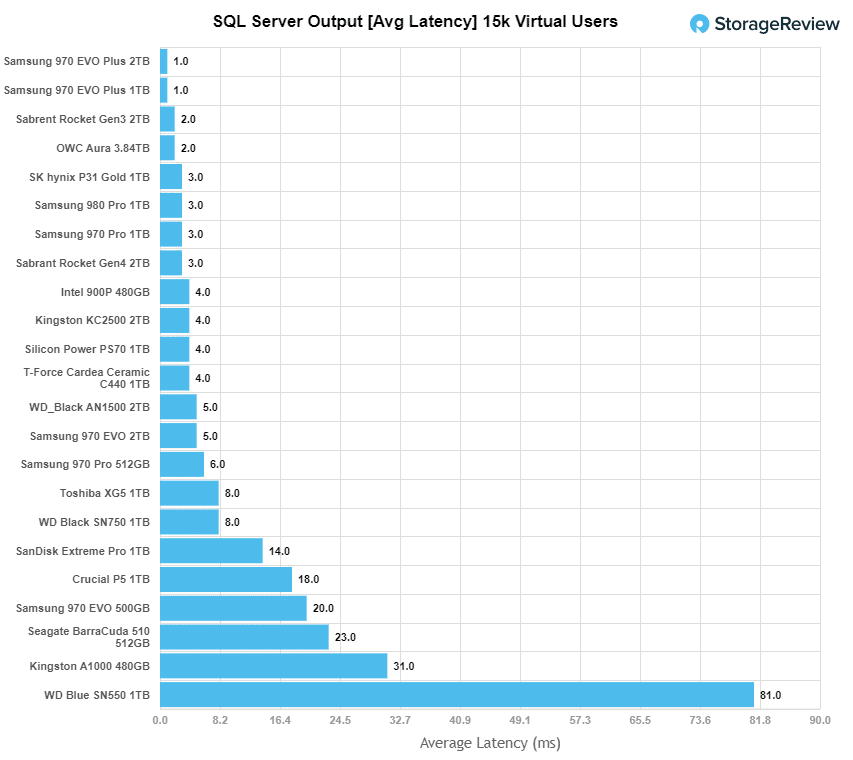
With SQL Server average latency the drive hit 5ms. While still fairly good, the drive has a slightly higher latency than other class-leading single SSDs.
Houdini by SideFX
The Houdini test is specifically designed to evaluate storage performance as it relates to CGI rendering. The testbed for this application is a variant of the core Dell PowerEdge R740xd server type we use in the lab with dual Intel 6130 CPUs and 64GB DRAM. In this case, we installed Ubuntu Desktop (ubuntu-16.04.3-desktop-amd64) running bare metal. The output of the benchmark is measured in seconds to complete, with fewer being better.
The Maelstrom demo represents a section of the rendering pipeline that highlights the performance capabilities of storage by demonstrating its ability to effectively use the swap file as a form of extended memory. The test does not write out the result data or process the points in order to isolate the wall-time effect of the latency impact on the underlying storage component. The test itself is composed of five phases, three of which we run as part of the benchmark, which is as follows:
- Loads packed points from disk. This is the time to read from disk. This is single-threaded, which may limit overall throughput.
- Unpacks the points into a single flat array in order to allow them to be processed. If the points do not have a dependency on other points, the working set could be adjusted to stay in-core. This step is multi-threaded.
- (Not Run) Processes the points.
- Repacks them into bucketed blocks suitable for storing back to disk. This step is multi-threaded.
- (Not Run) Writes the bucketed blocks back out to disk.
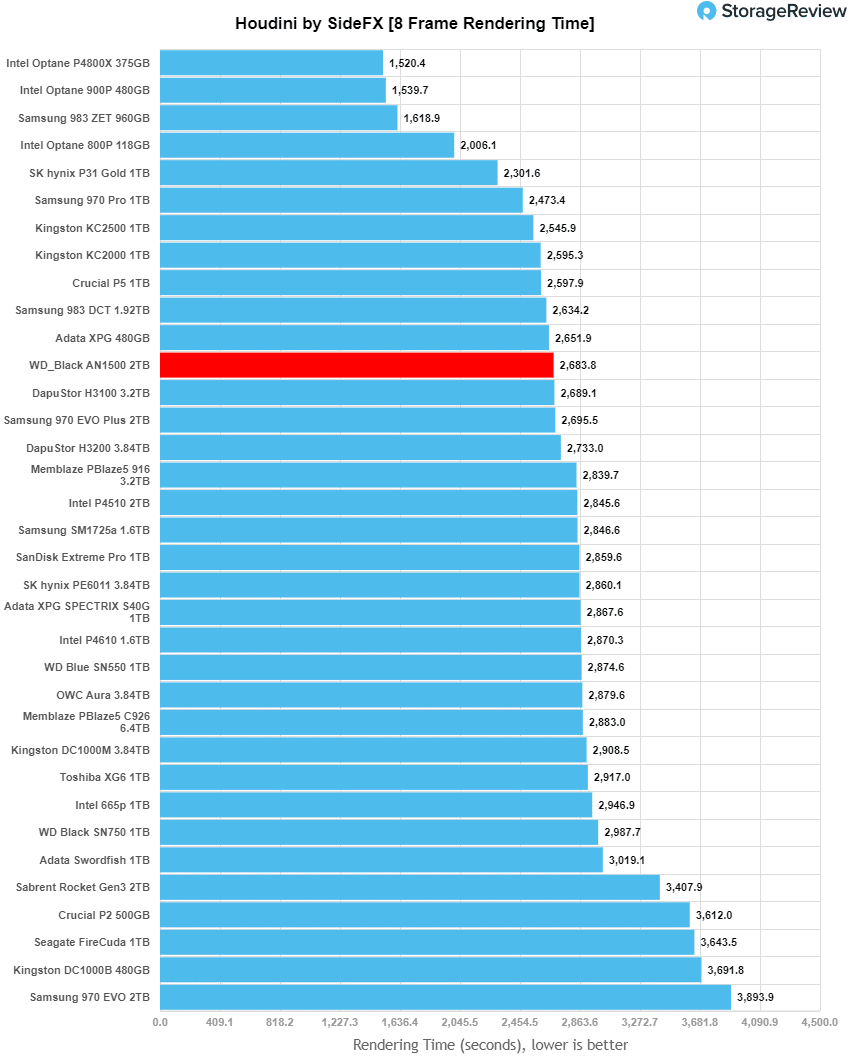
Here, we see the AN1500 hit 2,683.8 seconds in the upper third of the non-octane drives.
VDBench Workload Analysis
When it comes to benchmarking storage devices, application testing is best, and synthetic testing comes in second place. While not a perfect representation of actual workloads, synthetic tests do help to baseline storage devices with a repeatability factor that makes it easy to do apples-to-apples comparison between competing solutions. These workloads offer a range of different testing profiles ranging from “four corners” tests, common database transfer size tests, to trace captures from different VDI environments. All of these tests leverage the common vdBench workload generator, with a scripting engine to automate and capture results over a large compute testing cluster. This allows us to repeat the same workloads across a wide range of storage devices, including flash arrays and individual storage devices. Our testing process for these benchmarks fills the entire drive surface with data, then partitions a drive section equal to 5% of the drive capacity to simulate how the drive might respond to application workloads. This is different than full entropy tests which use 100% of the drive and take them into steady state. As a result, these figures will reflect higher-sustained write speeds.
Profiles:
- 4K Random Read: 100% Read, 128 threads, 0-120% iorate
- 4K Random Write: 100% Write, 64 threads, 0-120% iorate
- 64K Sequential Read: 100% Read, 16 threads, 0-120% iorate
- 64K Sequential Write: 100% Write, 8 threads, 0-120% iorate
Comparables for this review:
- Crucial P5 1TB
- Seagate FireCuda 510 1TB
- Sabrent Rocket Gen3 2TB
- Samsung 970 Pro 1TB
- Samsung EVO Plus 2TB
- SK hynix Gold P31 1TB
- Toshiba XG6 1TB
- WD Black 1TB
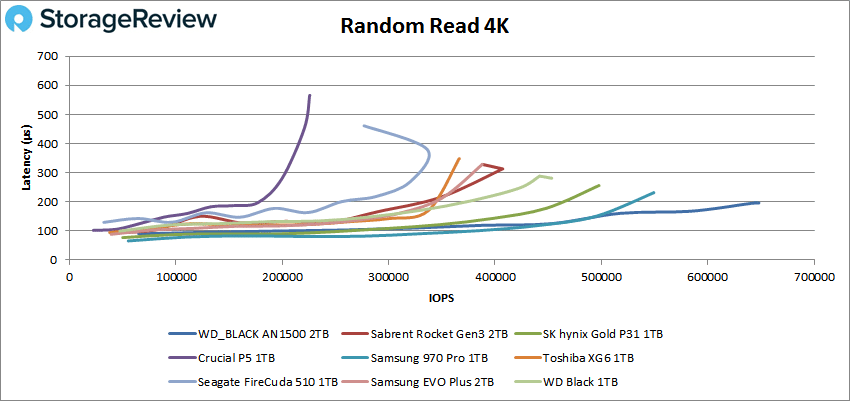
In 4K random read the WD_BLACK AN1500 took the lead by a large margin with a peak performance of 648,010 IOPS and a latency of 195.9µs.
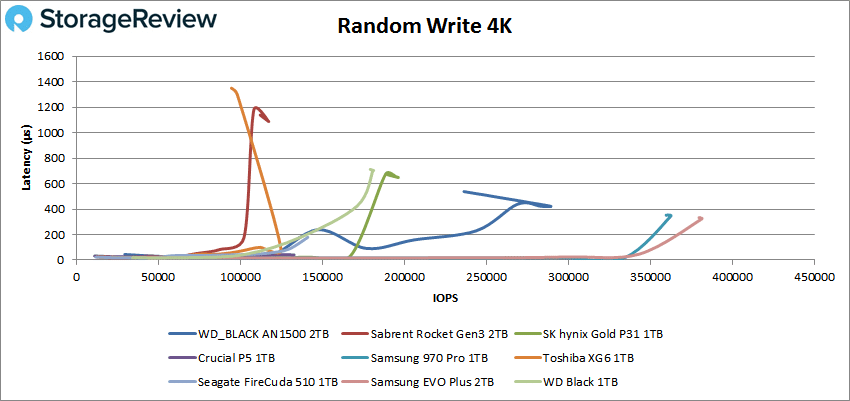
With 4K random write the AN1500 fell to third with a peak score of 288,886 IOPS with a latency of 424µs.
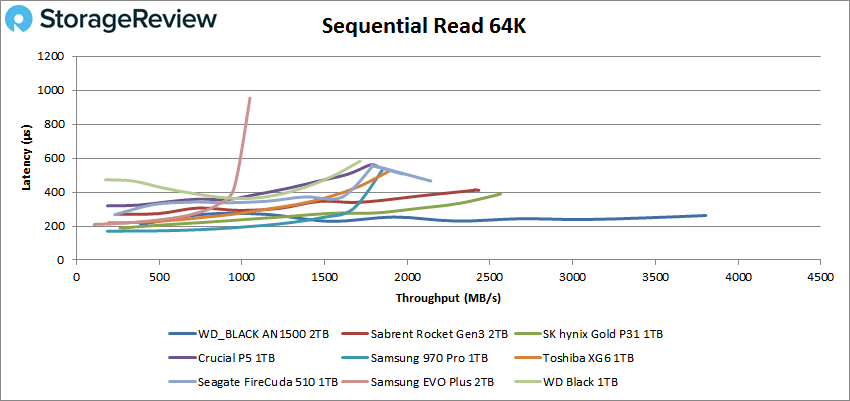
Switching over to sequential workloads, we ran our 64K tests. For read we saw another huge jump into first place with a peak of 60,830 IOPS or 3.8GB/s at a latency of 262.5µs.
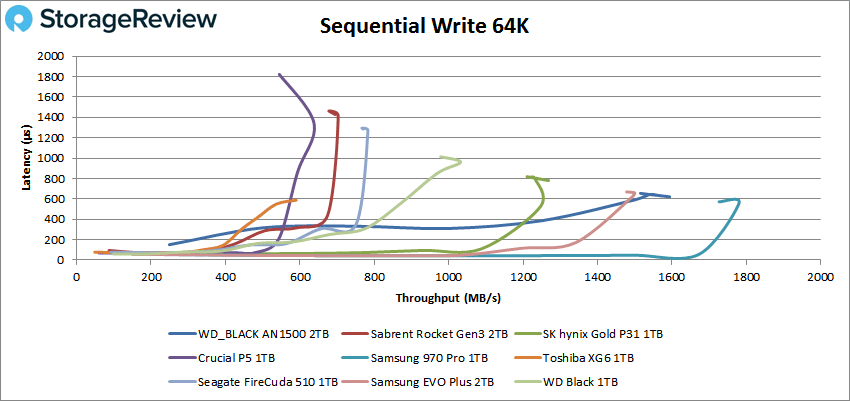
64K write saw the AN1500 take second with a peak of 25,499 IOPS or 1.6GB/s at a latency of 621.5µs.
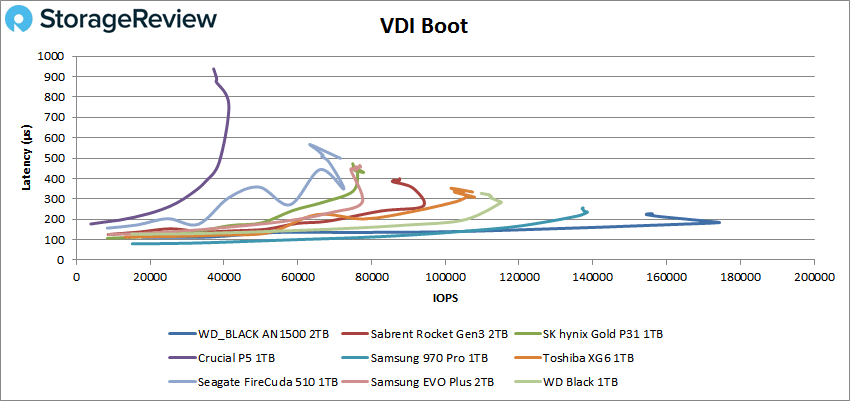
Next, we looked at our VDI benchmarks, which are designed to tax the drives even further. Here, the WD_BLACK AN1500 continued to give us strong numbers. In Boot, the AN1500 came in first by a wide margin yet again with 174,143 IOPS with a latency of 183.8µs.
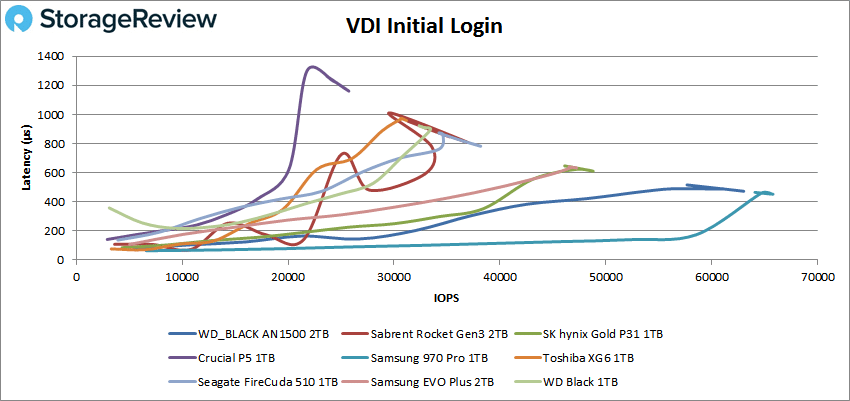
Next up is VDI Initial Login where the AN1500 took second with a peak of 63,032 IOPS and 465.6µs for latency.
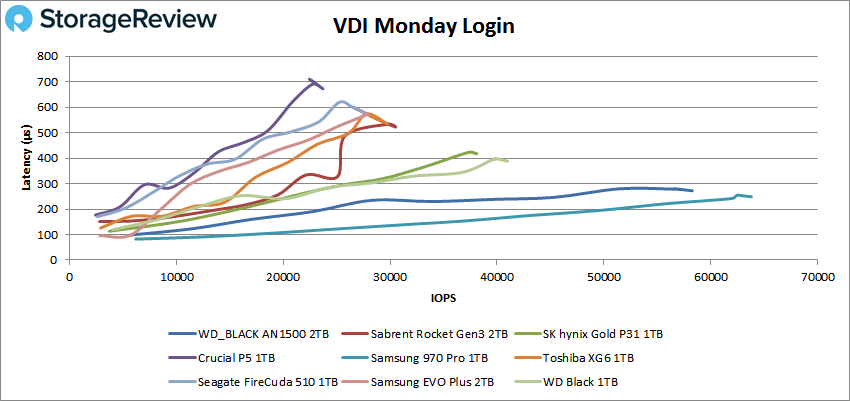
Finally, our VDI Monday Login saw a second-place finish with 58,249 IOPS and a latency of 272.4µs.
Conclusion
Western Digital has expanded its WD_BLACK gaming line with several entries. This review we focus on the AIC SSD, WD_BLACK AN1500. This drive leverages the NVMe interface with the promise of speeds as high as 6.5GB/s read and 4.1GB/s write and up to 4TB of capacity. The drive hits these speeds through a combination of the NVMe interface, RAID0 over two SSDs (in the 2TB and 4TB models), as well as an integrated heatsink. The SSD comes with WD_BLACK Dashboard software that can also control the built in customizable RGB lighting.
For performance we ran our Application Workload Analysis (in the form of SQL Server), Houdini by SFX, and VDBench. In our SQL server the drive landed in the middle with a TPS of 3,159. With average latency the drive hit 5ms, though this had more to do with running RAID0 over two SSDs. With Houdini we saw the WD land in the upper third with 2,683.8 seconds. Both of these areas showed some low-latency weakness compared to the other leading native SSD solutions.
With VDBench performance the WD_BLACK AN1500 was either in first or second in all of our tests. Highlights include 648K IOPS in 4K read, 289K IOPS in 4K write, 3.8GB/s in 64K read, and 1.6GB/s in 64K write. For out VDI we saw 174K IOPS for boot, 63K IOPS for initial login, and 58K IOPS for Monday login. It had a strong advantage in total bandwidth, but its latency profile was higher in many tests.
Overall the WD_BLACK AN1500 is a drive that can give gamers a boost without needing to go to a PCIe Gen4 platform yet. While not the only option out there, it does have a pretty significant read boost that should translate into less time waiting and more time playing.


 Amazon