

The OCZ Deneva 2 is an enterprise-class SSD that interfaces over SATA 6GB/s and has several different models utilizing an array of NAND. Our test model incorporates eMLC NAND to offer users more write cycles than standard MLC, and simultaneously it provides economics closer to MLC than the more expensive SLC. The Deneva 2 also comes in two different series to provides users flexibility in their choices. The R series includes a similar feature set to the C series but with a couple of additional features including power loss data protection and over-provisioning. The over-provisioning is geared more toward heavier write scenarios and is noticeable when users check capacity differences between the C and R models. Our test model is the OCZ Deneva 2 R eMLC NAND 200GB capacity drive. One more design note is that architecturally, the Deneva 2 comes in a 2.5" form factor, but OCZ can tailor it per application.
While the OCZ Talos 2 that we recently reviewed was a SAS-based SSD, the Deneva 2 R is a SATA based drive. SATA drives benefit from more flexible form factors and price points, though the SAS-based SSDs offer greater performance. As for performance figures on the Deneva 2 R, OCZ claims that it doubles speed compared to the previous generation. OCZ also says that Deneva 2 R’s figures max out at 550MB/s read and 500MB/s write with up to 80,000 4K random write and 55,000 read IOPS. These numbers are quite impressive given the class.
The Deneva 2 R-Series eMLC comes in capacities of 100GB, 200GB, and 400GB. OCZ does accept custom orders if customers want to modify interface options, form factors, etc.
OCZ Deneva 2 Specifications
- Capacities (R-Series)
- 100GB (D2RSTK251E19-0100)
- 200GB (D2RSTK251E19-0200)
- 400GB (D2RSTK251E19-0400)
- Performance
- Read Bandwidth up to 550 MB/s
- Write Bandwidth up to 500 MB/s
- Random Operations (4kB) 55,000 IOPS (read); 80,000 IOPS (write)
- NAND Components Synchronous-Mode Enterprise Multi-Level Cell (eMLC)
- NAND Controller SandForce 2582
- Interface Serial ATA (SATA) 6Gb/s
- 2.5" Form Factor
- Environmental
- Power Consumption Idle: 1.3 Watts; Active: 2.85 Watts
- Operating Temperature 0°C ~ 55°C
- Storage Temperature -45°C ~ 85°C
- Certifications RoHS, CE, FCC
- Reliability and Security
- Power Fail Protection DataWrite Assurance™ Technology (capacitance power back-up to ensure data hardening)
- Data Fail Recovery Recovers data from up to one NAND flash block
- Data Path Protection ECC: Up to 55 bits correctable per 512-byte sector
- Data Reliability Read Unrecoverable Bit Error Rate (UBER) 10e-17
- Data Encryption 128-bit AES-compliant
- Product Health Monitoring Self-Monitoring, Analysis and Reporting Technology (SMART) Support
- Operating Systems Windows XP 32-bit / 64-bit; Windows Vista 32-bit / 64-bit; Windows 7 32-bit / 64-bit; Linux; Mac OS X
- Dimensions (L x W x H) 100.00 x 69.75 x 9.20 mm
- Weight 83g (may vary slightly due to capacity)
Design and Build
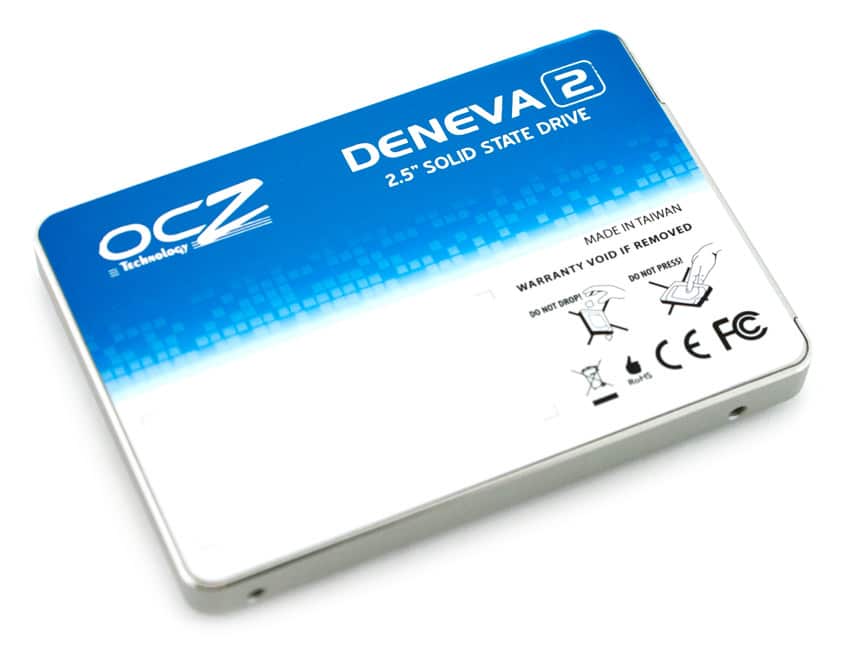
The OCZ Deneva 2 R has a much different appearance than the OCZ Talos 2 SAS model we reviewed, with a full label covering the top and a metallic gray casing for the body. The top-side sticker labels the drive with OCZ Deneva 2 branding on a blue backdrop and also provides white space for the drive to be user-labeled. On the bottom of the drive is the Deneva 2 R’s barcode sticker with drive information.
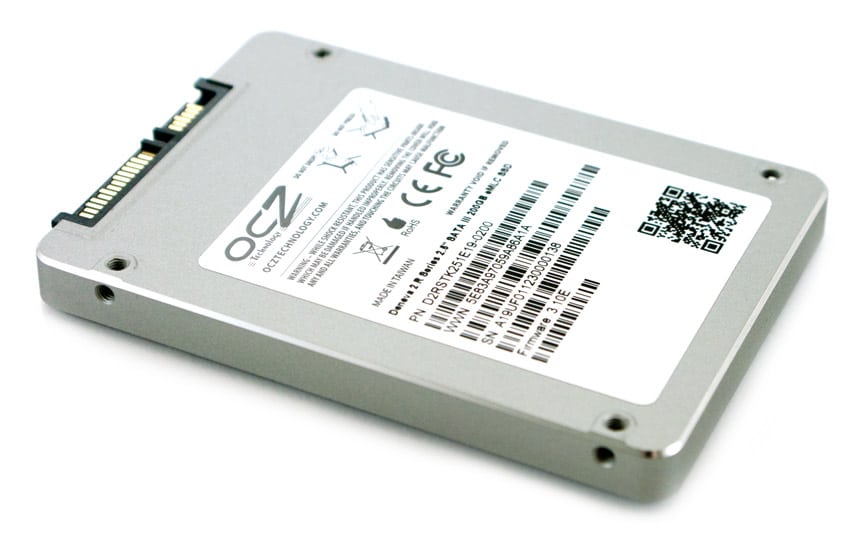
As with other SSDs, the side profile presents the screw holes that enable the drive to be mounted. The drive comes in a 2.5" form factor, and the spec sheet dimensions place it near 9.5mm for standard applications. The remaining feature on the drive is its standard SATA power and data connectors on the front.

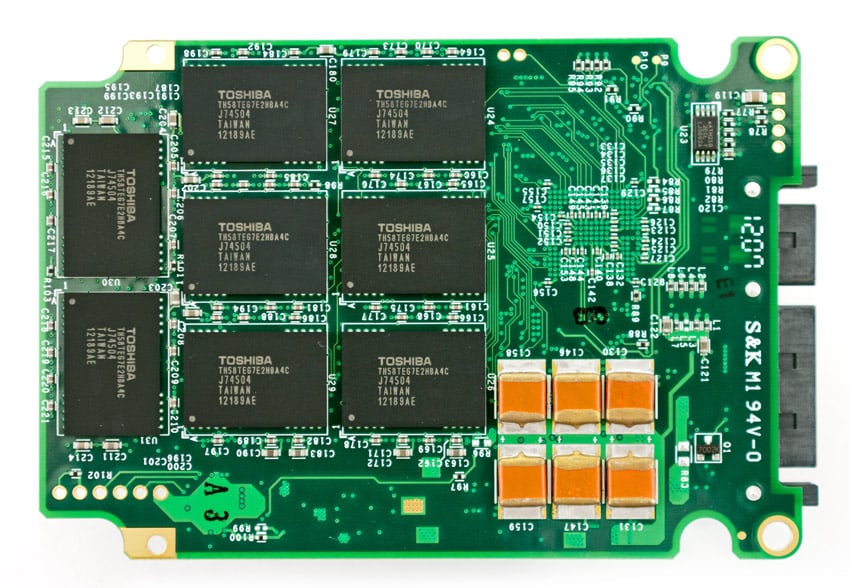
The 200GB OCZ Deneva 2 R model utilizes a SandForce SF-2582 controller and 16 NAND die in 16GB NAND packages. This gives the SSD a total capacity of 256GB, with 200GB usable which has been over-provisioned for users. The eMLC 24nm NAND helps to increase the endurance and long-term viability of the SSD, while giving a substantial cost benefit over SLC-based SSDs.
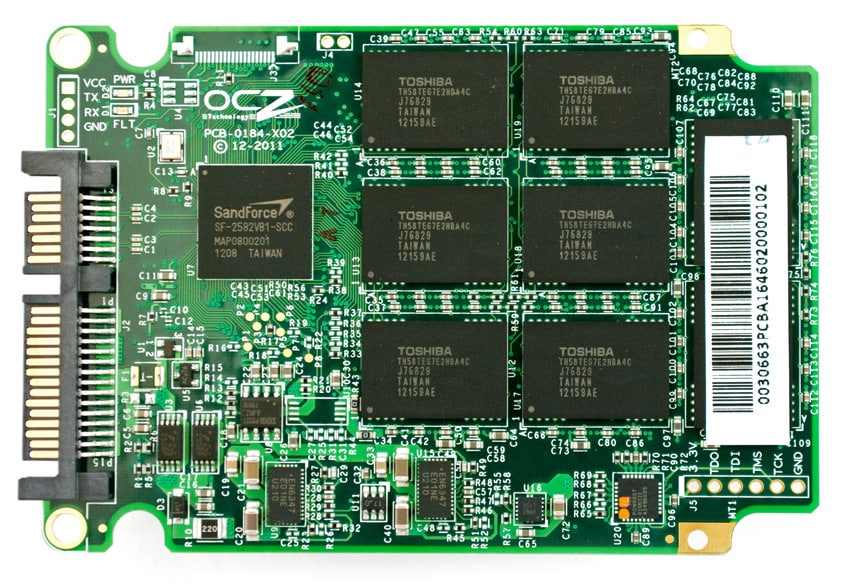
As seen in our Deneva 2 R sample, this version includes power-fail capacitors to allow data in flight to be written to NAND in the event power on the host system is lost.
Testing Background and Comparables
The OCZ Deneva uses Toshiba 24nm MLC NAND and a SandForce SF-2582 controller with a SATA 6.0Gb/s interface.
Comparables for this review:
- Intel SSD DC S3700 (200GB, Intel PC29AS21CA0 controller, Intel 25nm HET MLC NAND, 6.0Gb/s SATA)
- Kingston SSDNow E100 (200GB, SandForce SF-2500 controller, Toshiba 32nm eMLC NAND, 6.0Gb/s SATA)
- Micron P400m (200GB, Marvell 9187 controller, Micron 25nm eMLC NAND, 6.0Gb/s SATA)
All SAS/SATA enterprise SSDs are benchmarked on our second-generation enterprise testing platform based on a Lenovo ThinkServer RD630. This new Linux-based testing platform includes the latest interconnect hardware such as the LSI 9207-8i HBA as well as I/O scheduling optimizations geared towards best-case flash performance. For synthetic benchmarks, we utilize FIO version 2.0.10 for Linux and version 2.0.12.2 for Windows.
- 2 x Intel Xeon E5-2620 (2.0GHz, 15MB Cache, 6-cores)
- Intel C602 Chipset
- Memory – 16GB (2 x 8GB) 1333Mhz DDR3 Registered RDIMMs
- Windows Server 2008 R2 SP1 64-bit, Windows Server 2012 Standard, CentOS 6.3 64-Bit
- 100GB Micron RealSSD P400e Boot SSD
- LSI 9211-4i SAS/SATA 6.0Gb/s HBA (For boot SSDs)
- LSI 9207-8i SAS/SATA 6.0Gb/s HBA (For benchmarking SSDs or HDDs)
- Mellanox ConnectX-3 10GbE PCIe 3.0 Adapter
- Mellanox ConnectX-3 InfiniBand PCIe 3.0 Adapter
Application Performance Analysis
In the enterprise market there is a huge difference between how products perform on paper and how they perform in a production environment. At StorageReview we understand the importance of expanding into Application testing, with our first test being our MarkLogic NoSQL Database Storage Benchmark. While synthetic tests will continue to be an important part of our reviews, we plan on expanding our application tests to cover a wide range of areas, including VDI performance, VM load generation, expanded database performance tests, and many other areas.
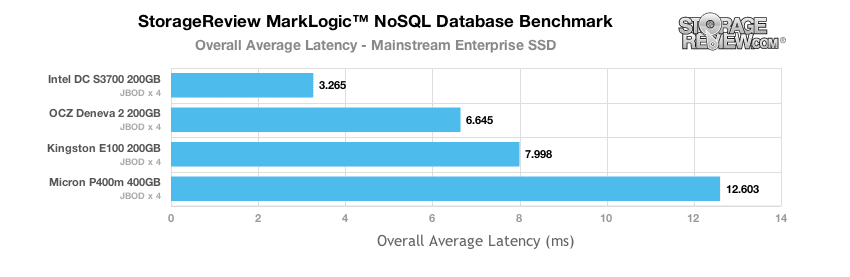
In our MarkLogic NoSQL Database environment, we test groups of four SATA or SAS SSDs with a usable capacity greater than or equal to 200GB. Our NoSQL database requires roughly 650GB of free space to work with, evenly divided between four database nodes. In our testing environment, we use an SCST host and present each individual SSD in JBOD, with one allocated per database node. The test repeats itself over 24 intervals, requiring between 30-36 hours total for the SSDs in this category. Measuring the internal latencys seen by the MarkLogic software, we record both total average latency, as well as interval latency for each SSD.
Comparing average total latency from each mainstream-enterprise SSD, the OCZ Deneva 2 performed up towards the top of the pack, although trailed the leader in this group by a wide margin. Compared to the Kingston E100, which offers a similar controller and NAND configuration, the OCZ Deneva 2 pulled ahead and offered 17% lower overall average latency.
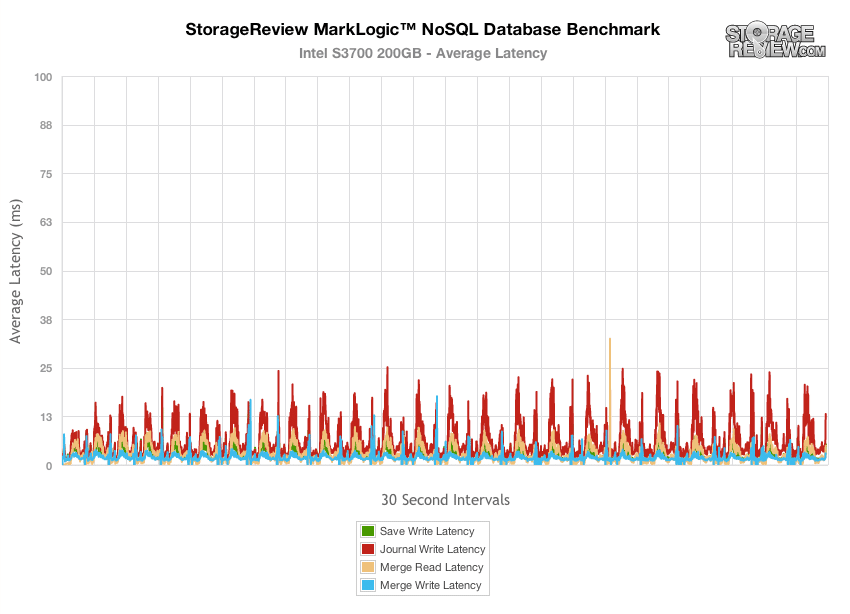
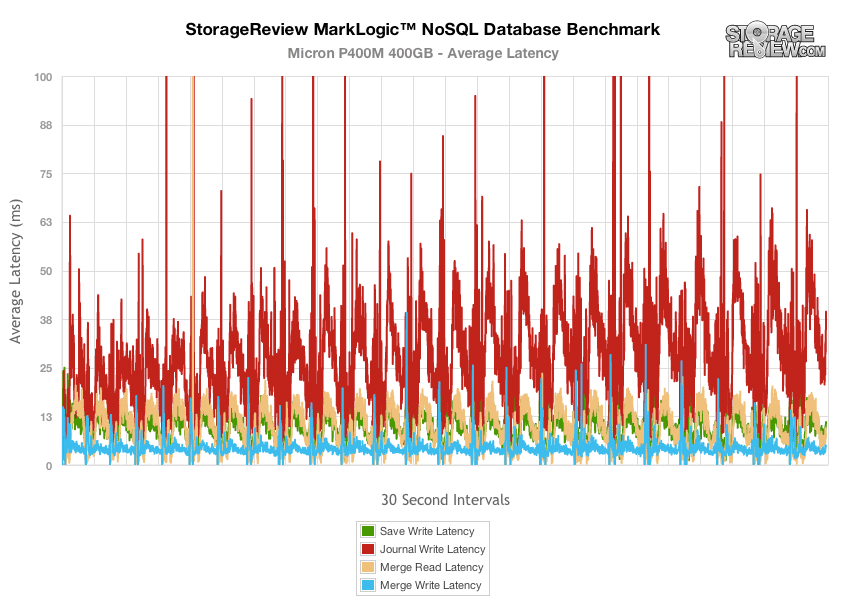
With the overall average latency chart showing how well each drive performed over the course of the 30-36 hours of testing, its also helpful to see how well the drive performed over the entire testing period. Since so much information is collected in each test run, we chart each drive individually, with Save Write, Journal Write, Merge Read, and Merge Write latency plotted against one another. The Intel S3700 ranked at the top of the pack with the peak measured latency measuring around 25ms, made up in bulk by the Journal Writes.
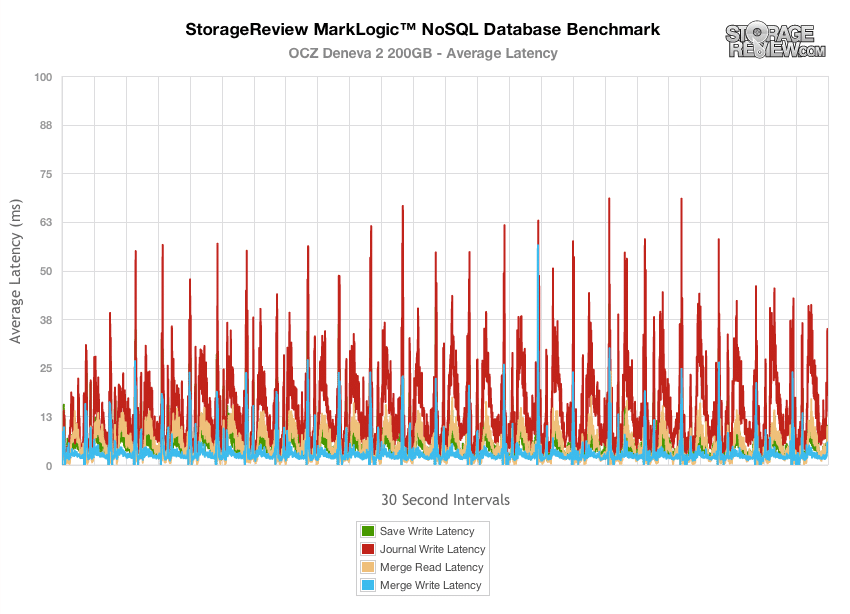
Next in line is the OCZ Deneva 2, which saw larger peak response times measuring 70ms and below.
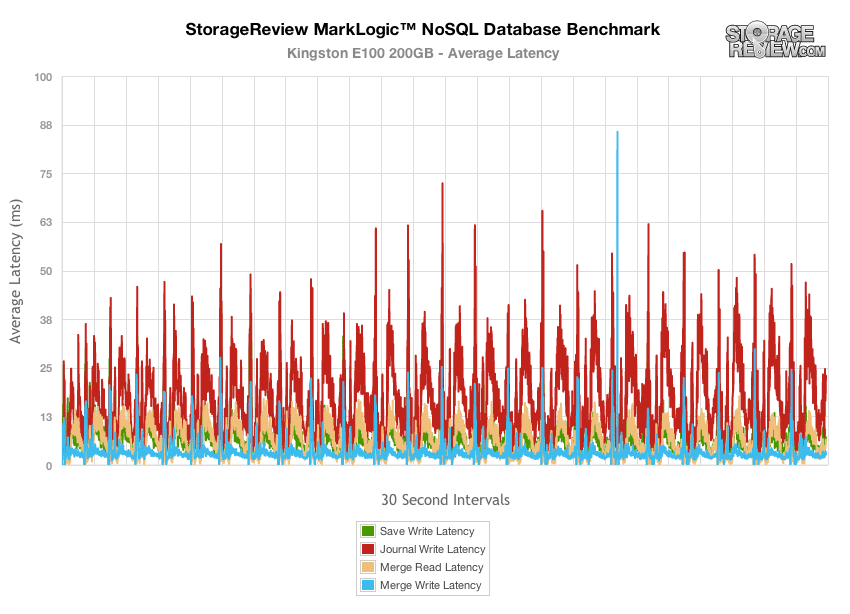
The Kingston E100 performed very similarly to the OCZ Deneva 2, although each latency group measured slightly higher over the course of the test.
The Micron P400m ranked towards the bottom of this SSD group in our MarkLogic NoSQL test, with higher Journal Write latency than others in this group. We measured peaks as high as 387ms, with many peaks measuring between 100-150ms.
Enterprise Synthetic Workload Analysis
Flash performance varies throughout the preconditioning phase of each storage device. Our enterprise storage benchmark process begins with an analysis of the way the drive performs during a thorough preconditioning phase. Each of the comparable drives are secure erased using the vendor’s tools, preconditioned into steady-state with the same workload the device will be tested with under a heavy load of 16 threads with an outstanding queue of 16 per thread, and then tested in set intervals in multiple thread/queue depth profiles to show performance under light and heavy usage.
Preconditioning and Primary Steady-State Tests:
- Throughput (Read+Write IOPS Aggregate)
- Average Latency (Read+Write Latency Averaged Together)
- Max Latency (Peak Read or Write Latency)
- Latency Standard Deviation (Read+Write Standard Deviation Averaged Together)
Our Enterprise Synthetic Workload Analysis includes four profiles based on real-world tasks. These profiles have been developed to make it easier to compare to our past benchmarks as well as widely-published values such as max 4K read and write speed and 8K 70/30, which is commonly used for enterprise drives. We also included two legacy mixed workloads, the traditional File Server and Webserver, each offering a wide mix of transfer sizes.
- 4K
- 100% Read or 100% Write
- 100% 4K
- 8K 70/30
- 70% Read, 30% Write
- 100% 8K
- File Server
- 80% Read, 20% Write
- 10% 512b, 5% 1k, 5% 2k, 60% 4k, 2% 8k, 4% 16k, 4% 32k, 10% 64k
- Webserver
- 100% Read
- 22% 512b, 15% 1k, 8% 2k, 23% 4k, 15% 8k, 2% 16k, 6% 32k, 7% 64k, 1% 128k, 1% 512k
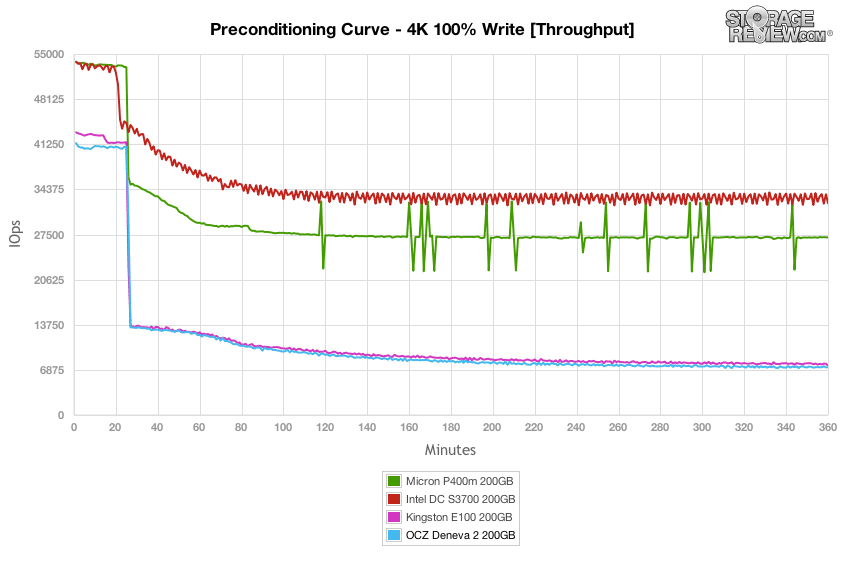
Our first test measures 100% 4K random write performance with a load of 16T/16Q. In this workload, burst speeds from the OCZ Deneva 2 R 200GB tested at 41,500 IOPS, which places it near the Kingston. The Deneva 2 then leveled off near 7,300 IOPS as it entered steady-state. The Intel model came in at the top, with the Deneva 2 staying at the bottom.
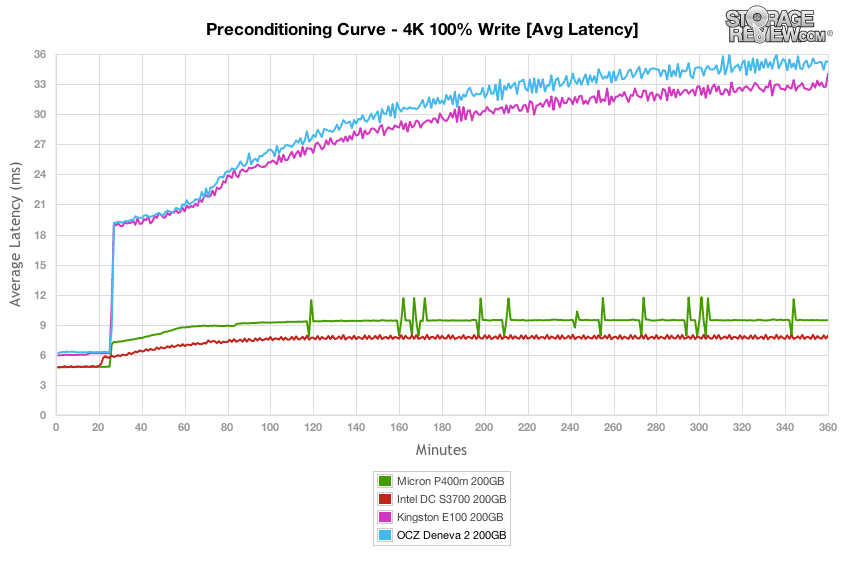
With a heavy 16T/16Q load, the Deneva 2 R 200GB measured 6.17ms in burst and scaled up to 35.225ms as it neared steady-state.
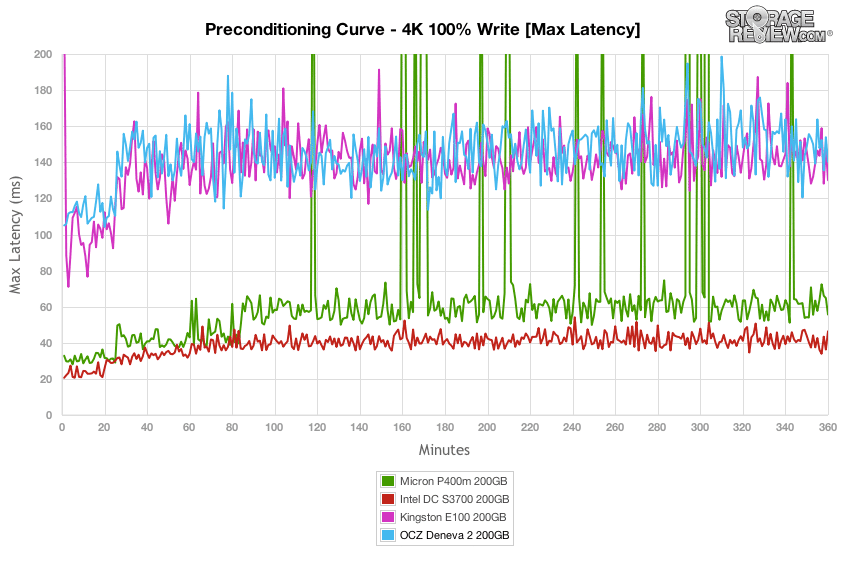
When we compared max latency between the 200GB SSDs, the Deneva 2 R had max response times ranging between 130-170ms in steady-state, which placed it in the middle of the pack.
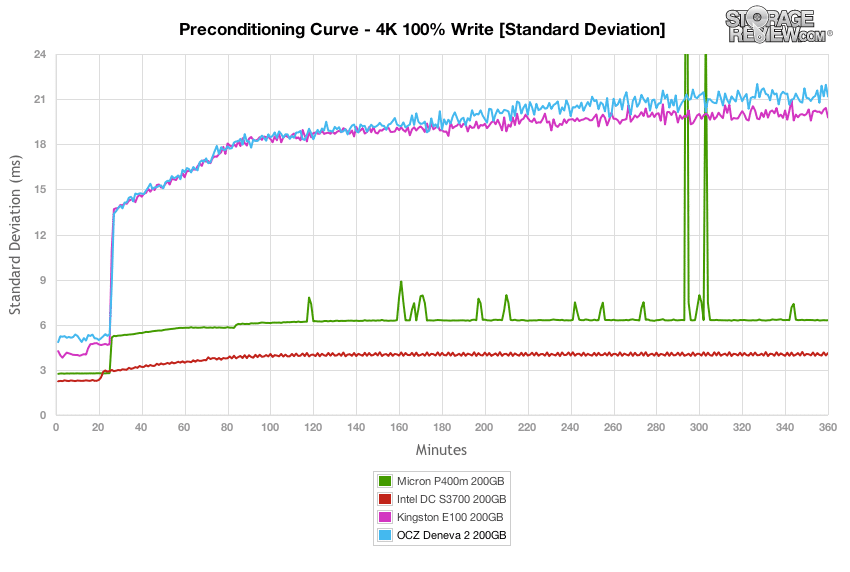
Looking even closer at the latency consistency in our 4k random write workload, the OCZ Deneva 2 R found itself near the bottom of the pack.
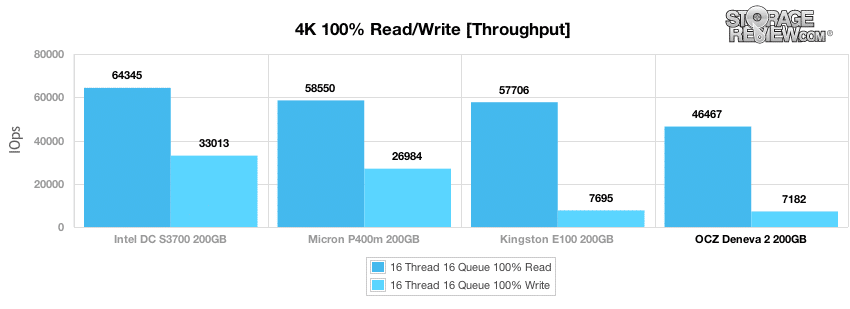
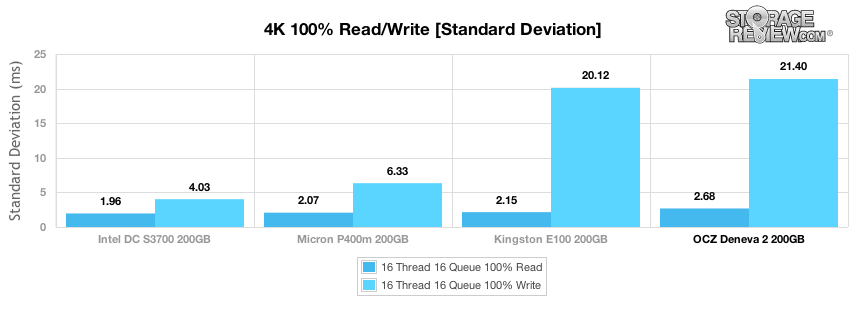
After 6 hours of preconditioning, the Deneva 2 R offered the lowest 4K random read performance at 46,500 IOPS, and its write speed was comparable to the Kingston at around 7,200 IOPS.
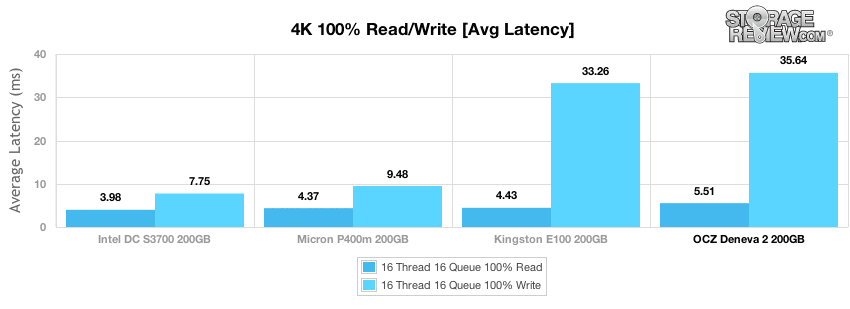
With a heavy load of 16T/16Q, the Deneva 2 R offered more read latency than the others in the group we compared. Write latency was more comparable to the Kingston at 35.64ms.
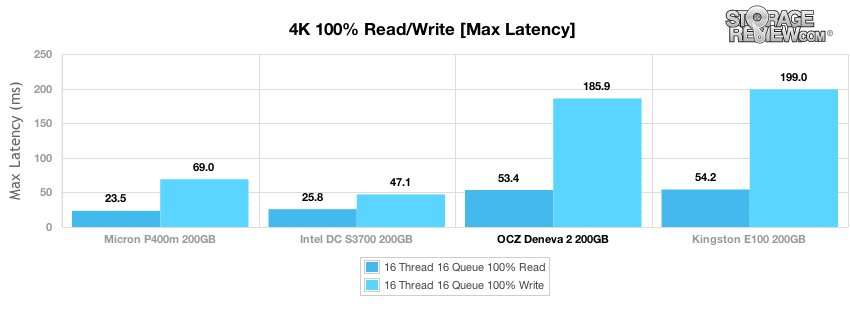
As we look at max latency in our 4k test, the Deneva 2 R had slightly better performance than the Kingston E100 with read activity measuring 53.4ms and write activity at 185.9ms.
The OCZ Deneva 2 R read latency standard deviation was higher by comparison but close to the competition, and the writes at 21.40ms were close to the Kingston E100.
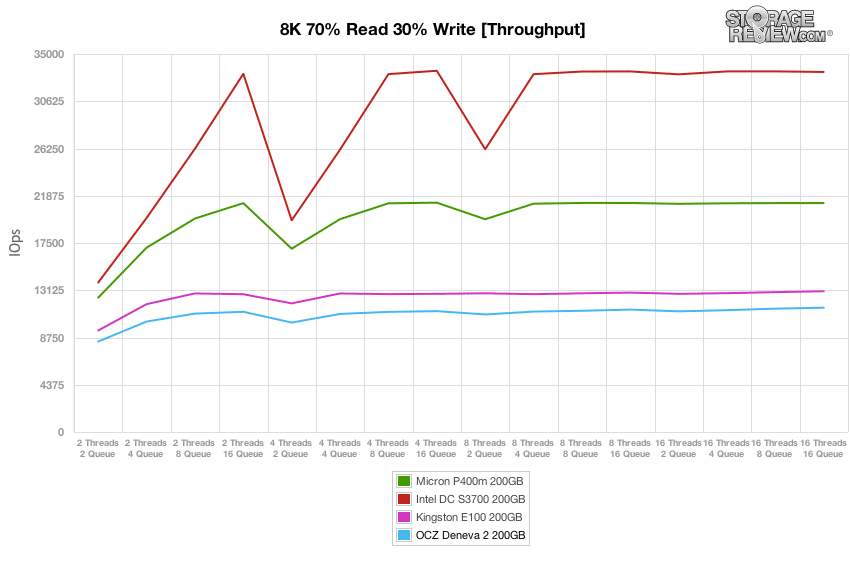
In our first mixed workload using an 8K profile 70/30% read/write spread and a constant 16T/16Q load, we measured a peak rate of 34,000 IOPS from the Deneva 2 R before it hit 11,500 IOPS, closer to the Kingston performance again. The chart shows that the OCZ did stay in burst mode for a while, though it wasn’t as strong as the top performers from Intel and Micron.
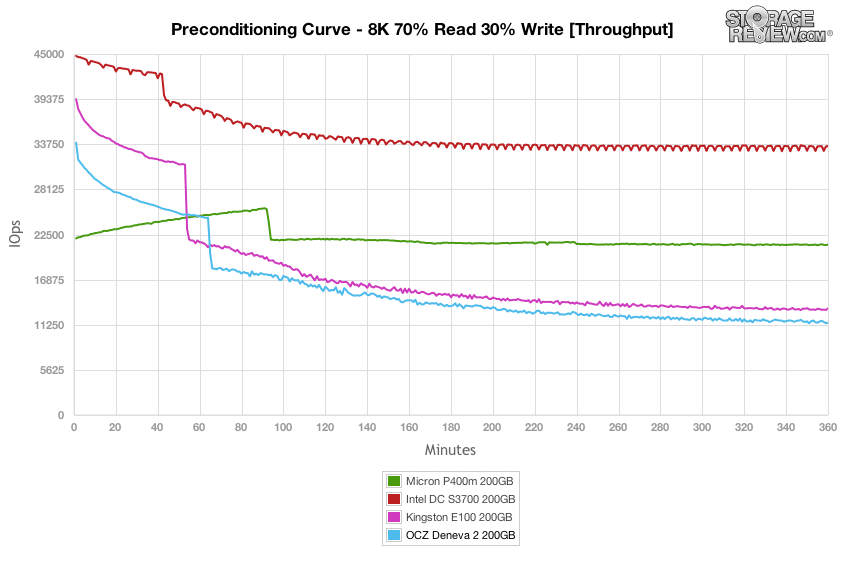
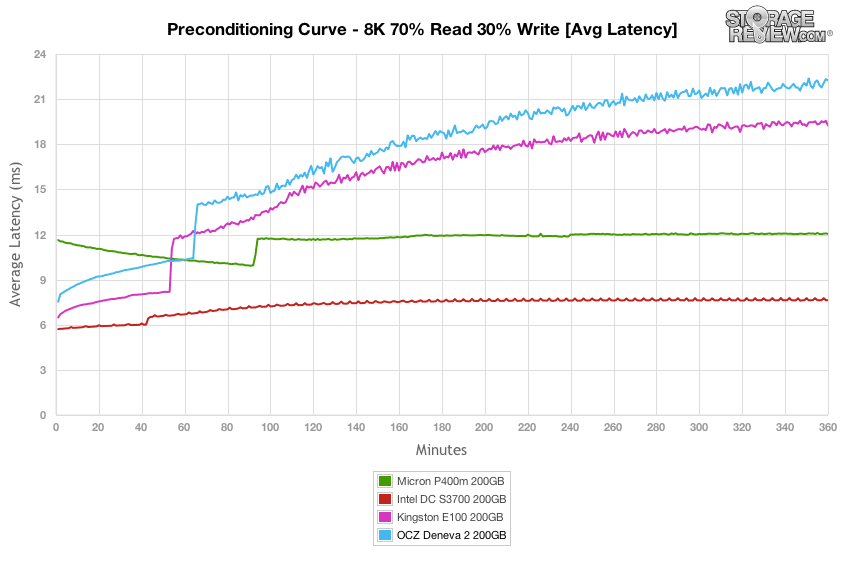
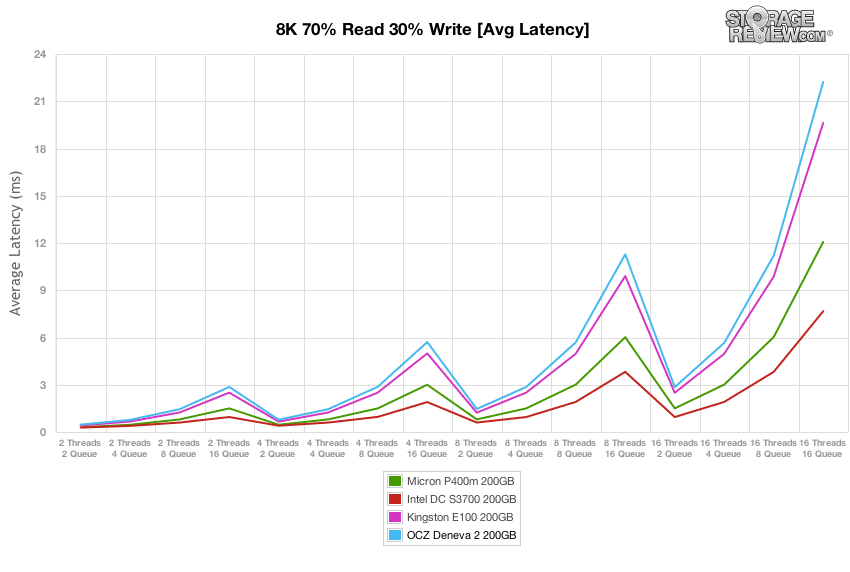
With a load of 16T/16Q, the Deneva 2 R offered an average latency of around 7.53ms in burst before increasing to 22.24ms as it arrived at steady-state.
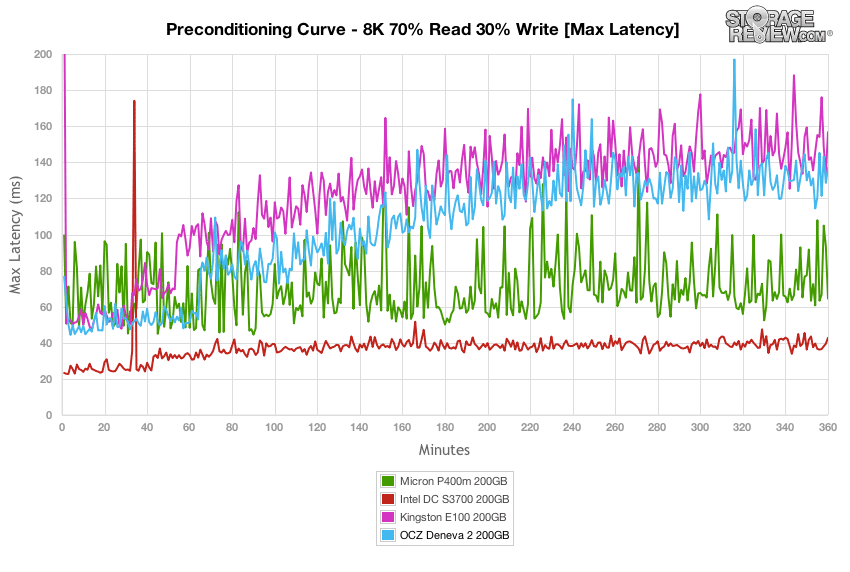
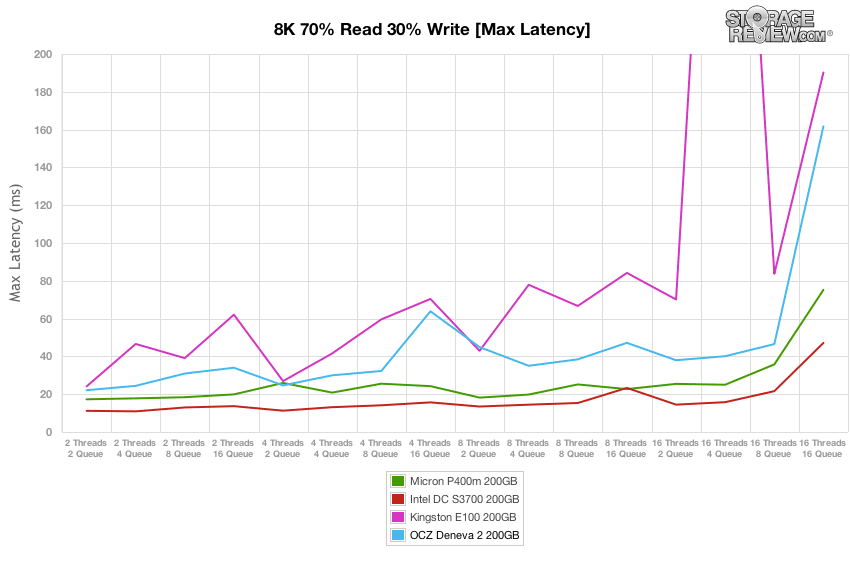
In the max latency section of our 8k 70/30 preconditioning test, the OCZ performed near the lower end, but beat out the Kingston E100. The Deneva 2 R measured between 110-140ms in steady-state.
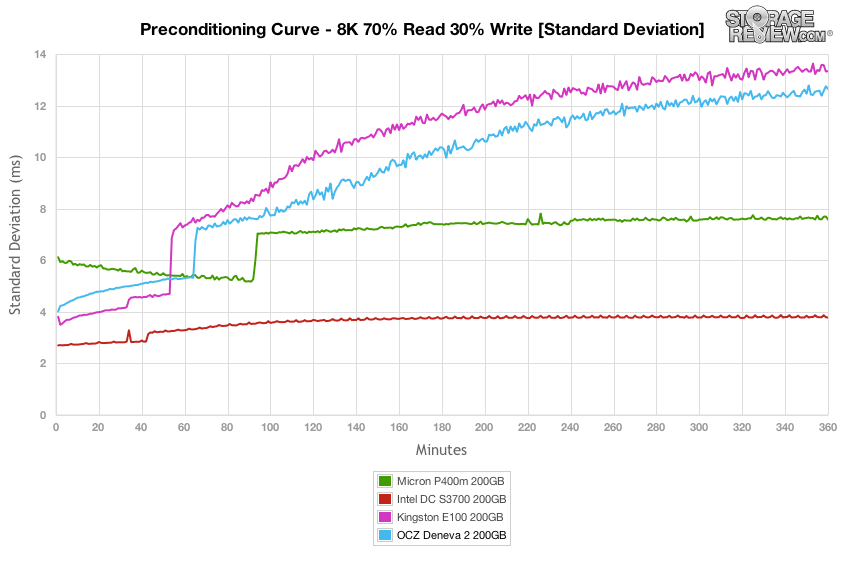
When the Deneva 2 R got to steady-state, it tested competitively again with the Kingston E100.
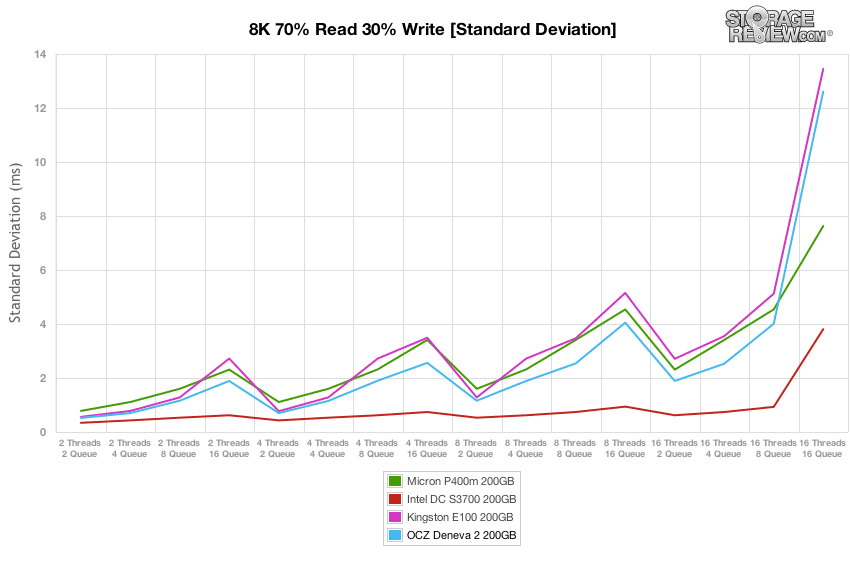
Compared to the fixed 16 thread 16 queue max workload we performed in the 100% 4K write test, our mixed workload profiles scale performance across a wide range of thread/queue combinations. In these tests, we span workload intensity from 2 threads and 2 queue up to 16 threads and 16 queue. In the expanded 8K 70/30 test, the Deneva 2 R scaled from 8,376 IOPS at 2T/2Q to the lowest in group peak at 11,510 IOPS at 16T/16Q.
After the SSDs had entered steady-state in our 8k 70/30 test, the Deneva 2 R had an average latency of 0.47ms at 2T/2Q which increased to 22.23ms at 16T/16Q.
Max latency stayed middle of the pack for most of the queue depths, though the Deneva 2 R increased at 16T/16Q.
Comparing latency consistency in our 8k 70/30 test, the Deneva 2 R stayed tight with the Kingston and Micron with an edge until 16T/8Q when it spiked up with the Kingston.
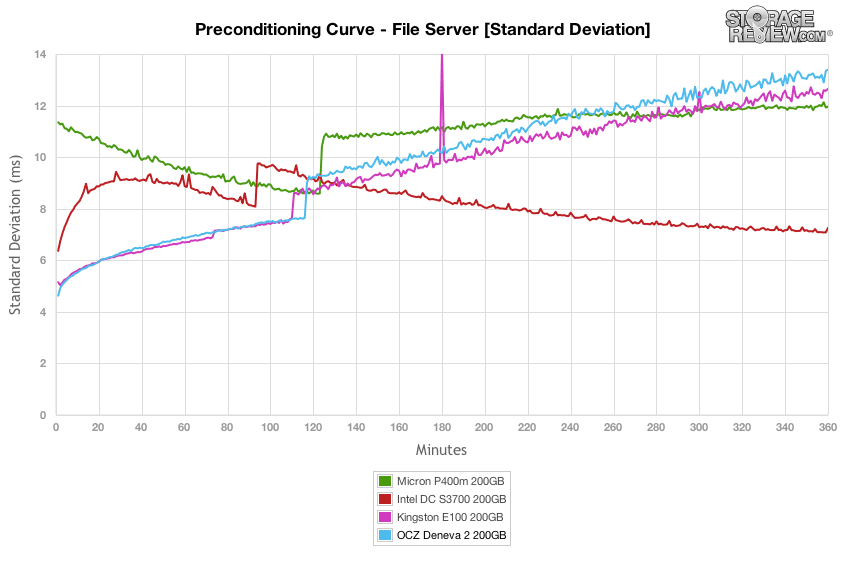
The next workload is our File Server profile, which covers a wide range of transfer sizes spanning from 512b to 512K. With a heavy 16T/16Q saturation load, the Deneva 2 R tested with peak transfer speeds measuring 29,000 IOPS before easing into a steady-state speed near 11,000 IOPS. The initial peak speeds were class-leading, though after the first couple of hours the Deneva 2 R lost its edge.
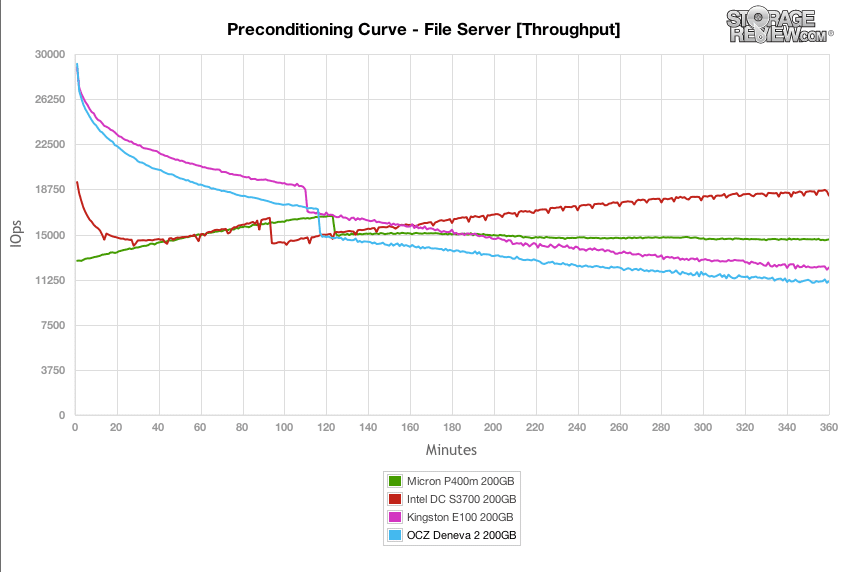
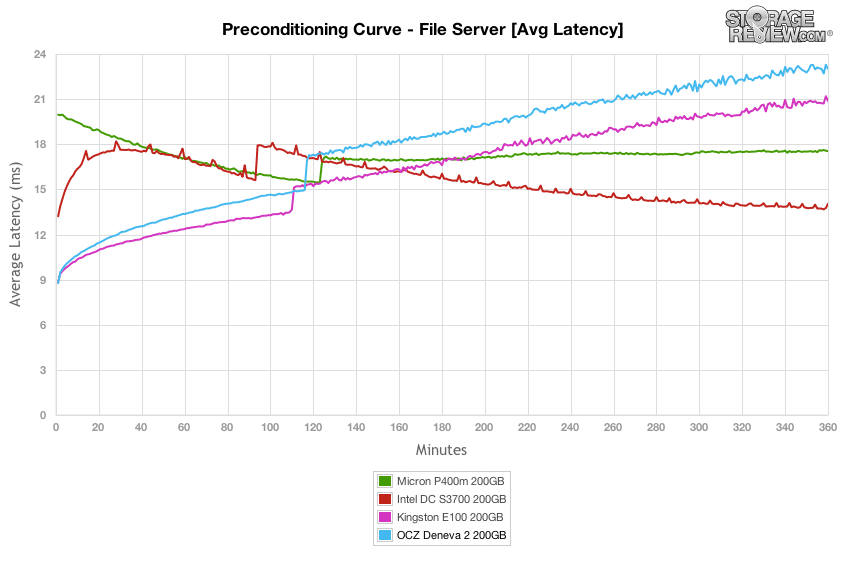
Average latency from the Deneva 2 R in our File Server preconditioning test measured strongly at 8.76ms in burst, before increasing to 23.01ms in steady-state.
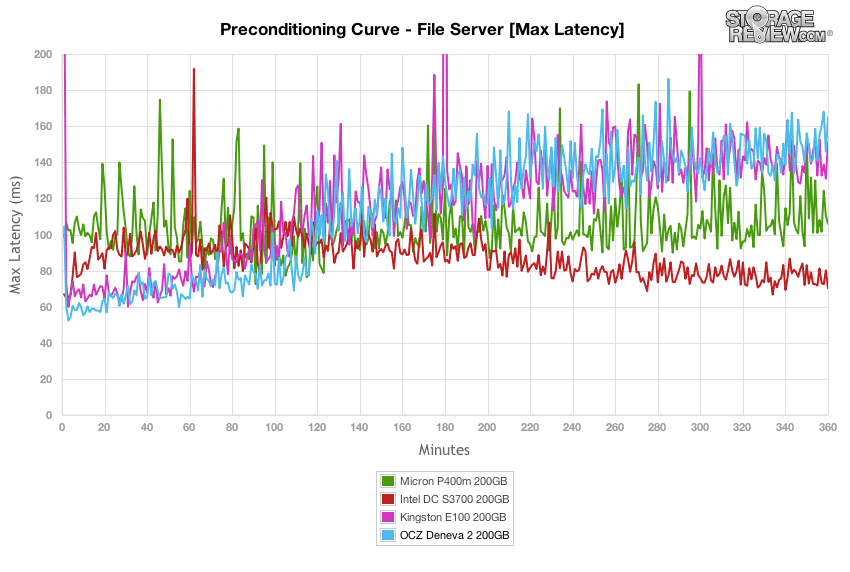
Nearing steady-state in our File Server preconditioning test, the Deneva 2 R had max latency ranging from 60 to 80ms in burst, and then it jumped up to the 140-150 range nearing steady-state.
Switching focus to latency consistency in our File Server preconditioning test, the Deneva 2 R tested well with the Kingston, and then it slipped toward the bottom middle of the pack as it neared steady-state.
After our 6-hour File Server preconditioning process had finished on each SATA SSD, we transitioned to varied workloads where we scale between 2T/2Q up to 16T/16Q. The Deneva 2 R ranked just under the Kingston scaling from 6,468 IOPS at 2T/2Q and peaking at 10,934 IOPS at 16T/16Q.
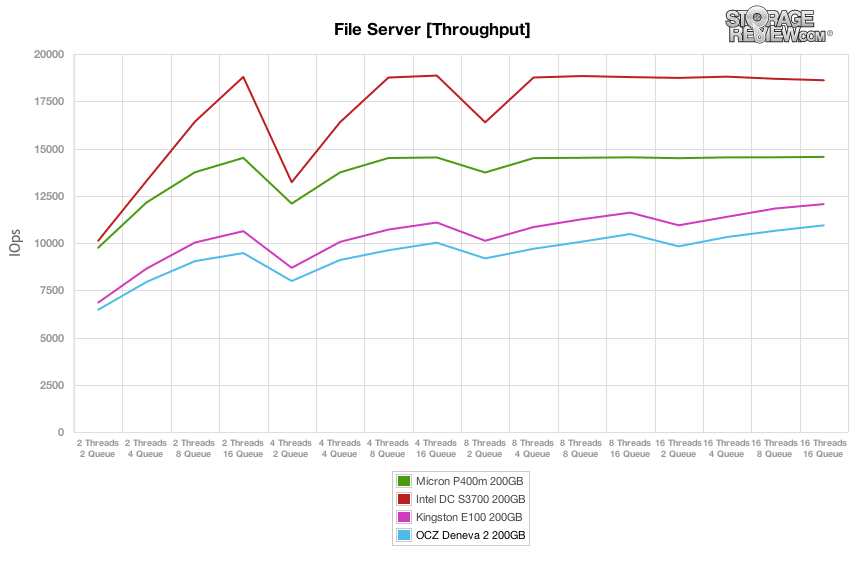
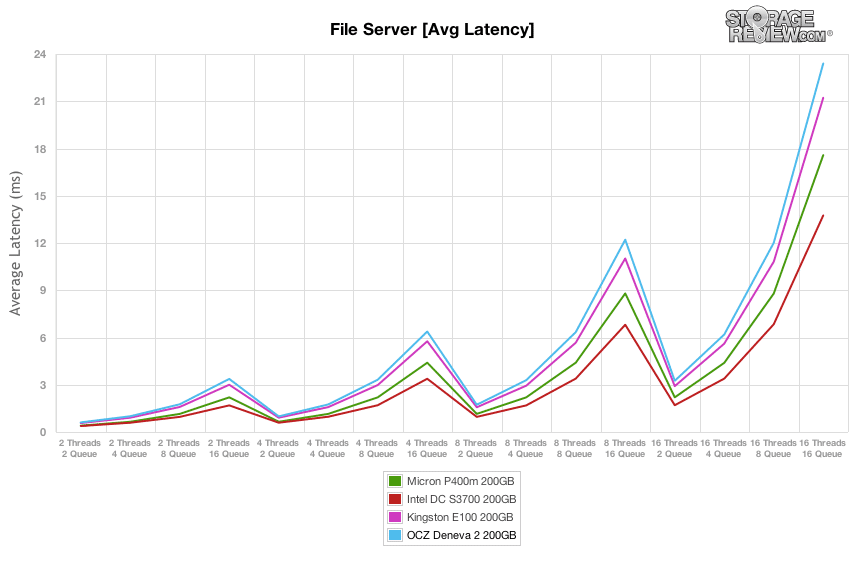
The OCZ Deneva 2 R’s average latency in our File Server test scaled starting at 0.61ms at 2T/2Q and increased to 23.4ms at 16T/16Q.
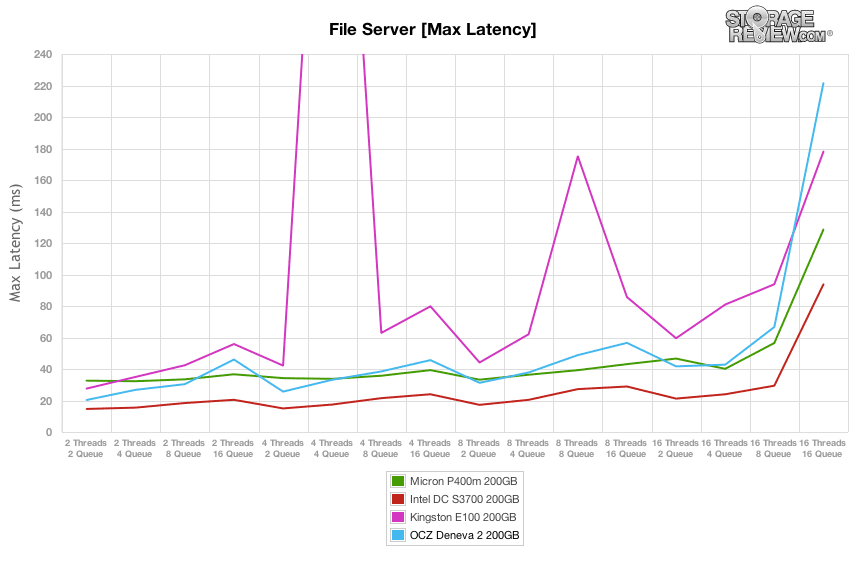
In our File Server test, the Deneva 2 R had response times that were near the comparables in the middle of the pack across scaling workloads, ranging around 20.31ms up until 16T/16Q where it peaked at 221.51ms.
Comparing latency consistency, the Deneva 2 R ranked in the middle of the pack.
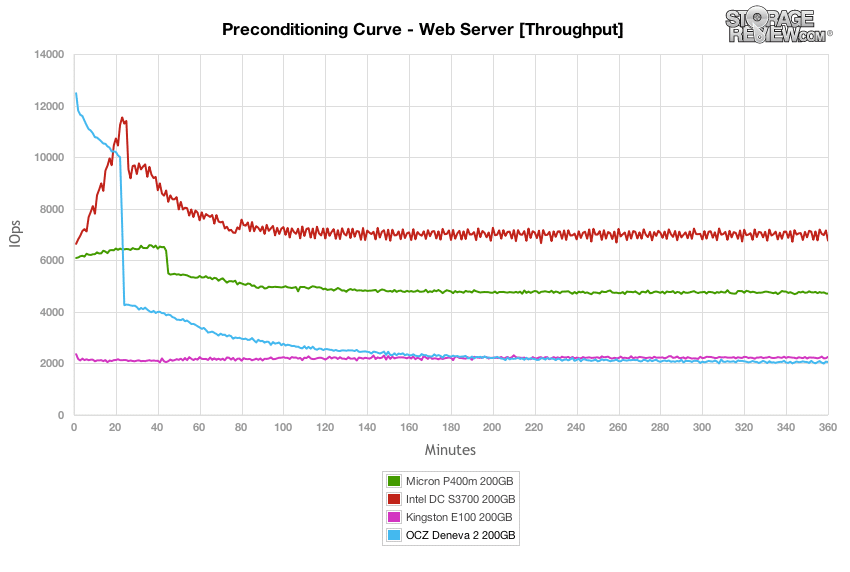
Our final preconditioning workload takes the traditional 100% read activity Web Server test and flips it to 100% write to precondition each SSD. This is our most aggressive workload, although it doesn’t really match any real-world conditions with 100% write. In this section, the Deneva 2 R offered the highest burst speeds, yet as it arrived at steady-state, it was at the bottom of the four SSDs with the Kingston.
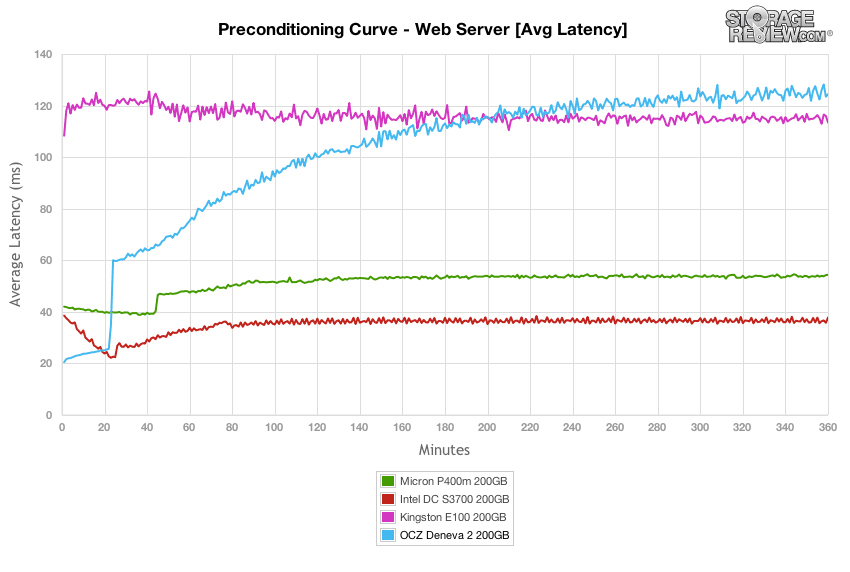
Average latency in our Web Server preconditioning test leveled off around 120ms as the drive neared steady-state, staying higher than the Intel and Micron drives, but competitive with the Kingston.
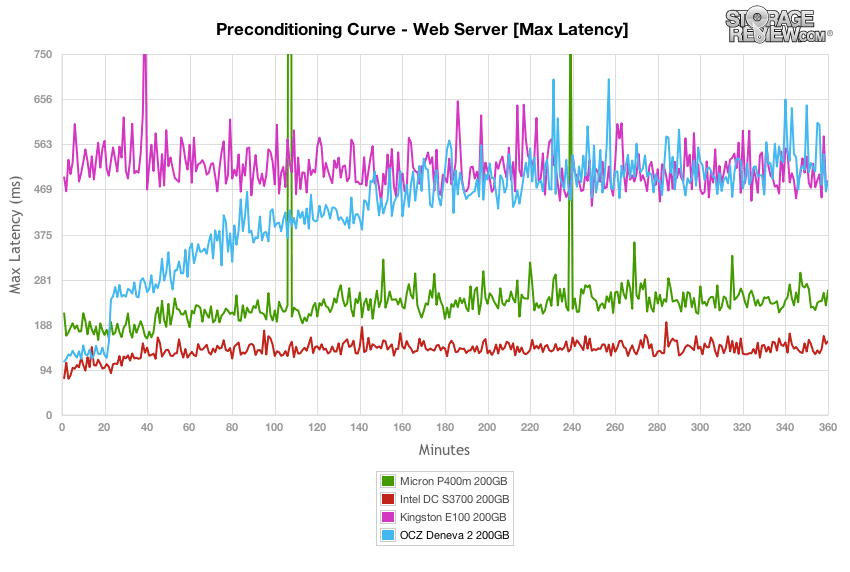
Max latency from the Deneva 2 R in the duration of our stressful 100% write Web Server preconditioning run ranged from 500 to about 600ms as it neared steady-state, which was near the Kingston marks.
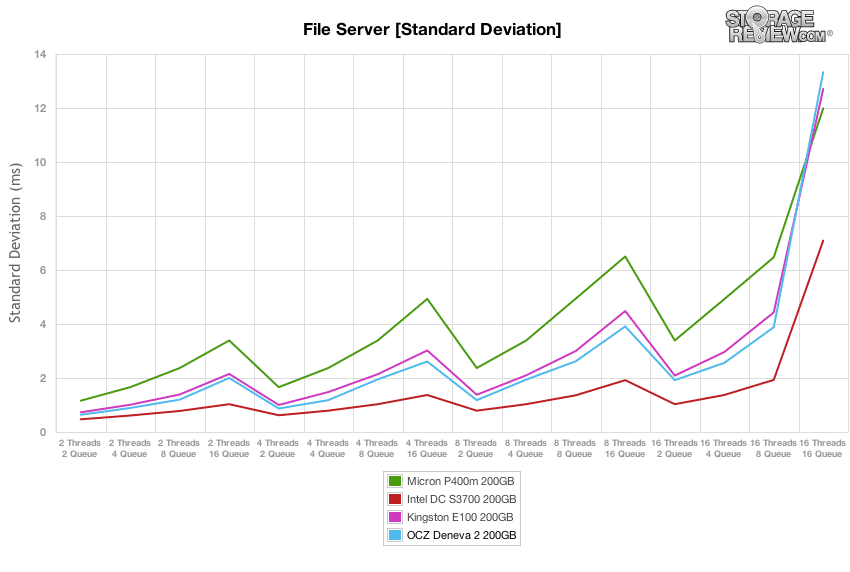
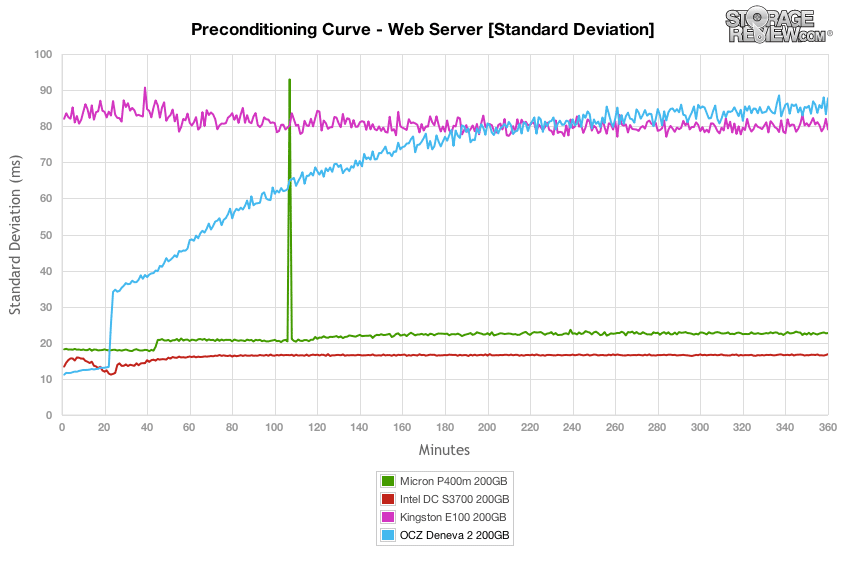
Comparing latency standard deviation in our Web Server preconditioning test, the Deneva 2 R performed near the bottom of the pack as it neared steady-state.
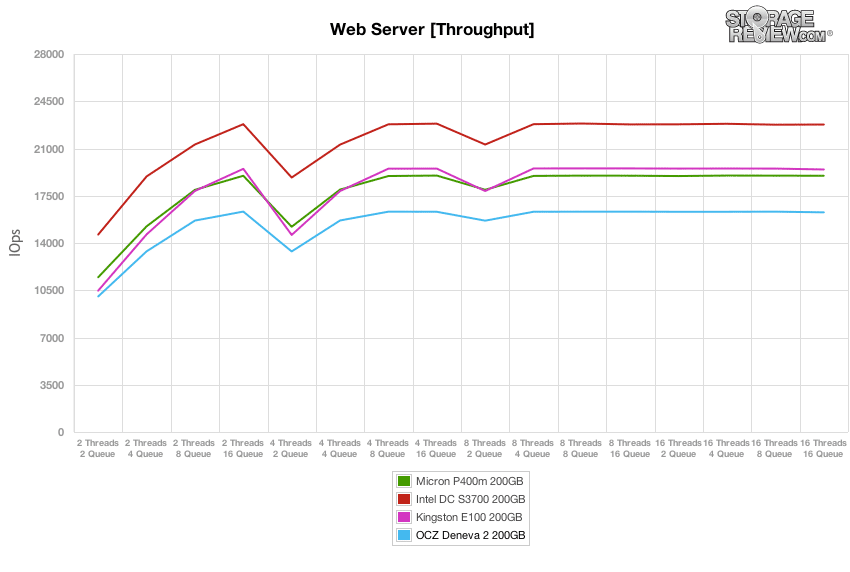
After each SSD finished our preconditioning stage in the Web Server test, we flipped the workload back to 100% read. In read-only conditions the Deneva 2 R performed at the bottom of the group while scaling from 10,039 IOPS at 2T/2Q to 16,271 IOPS at 16T/16Q.
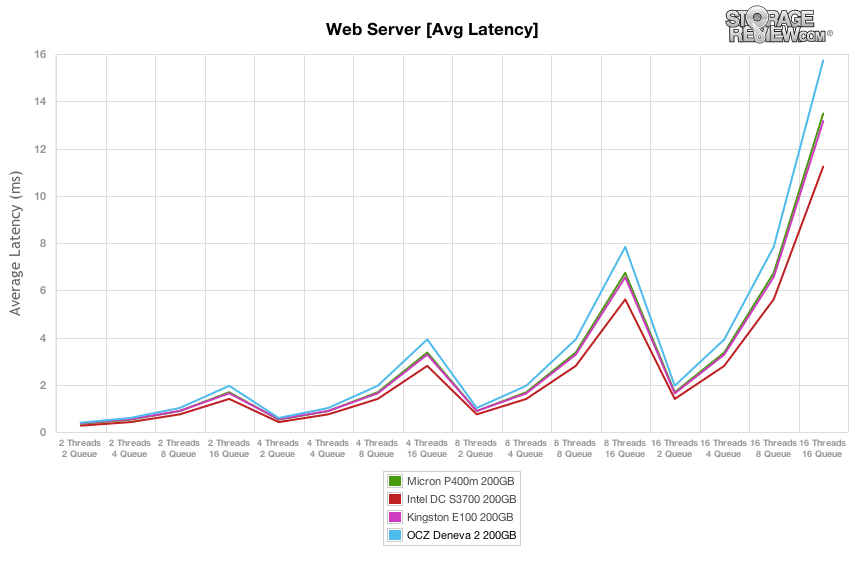
Average latency from the Deneva 2 R in our read-only Web Server scaled from 0.395ms at 2T/2Q up to 15.73ms at 16T/16Q.
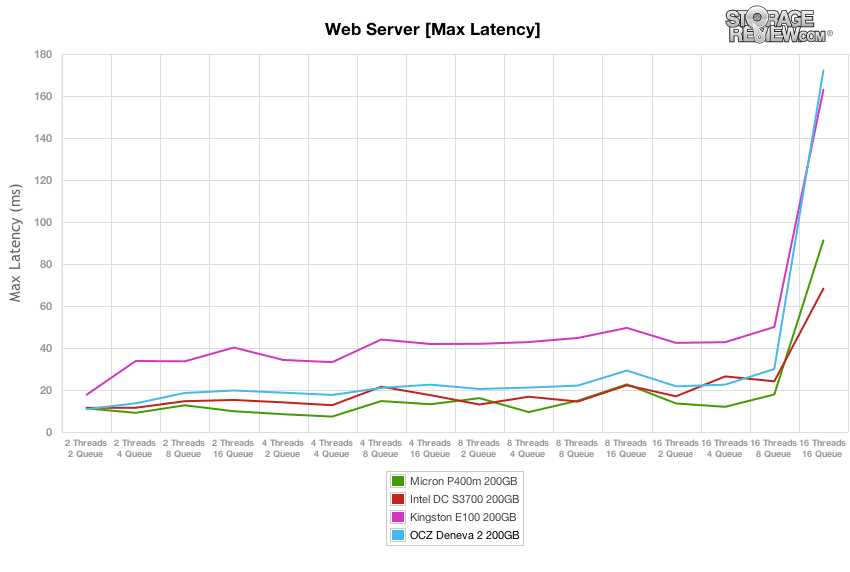
Comparing max latency in our Web Server test, the Deneva 2 R had maximum latency measuring around 10.88ms, although it did spike to 172.32ms at 16T/16Q, staying competitive only with the Kingston.
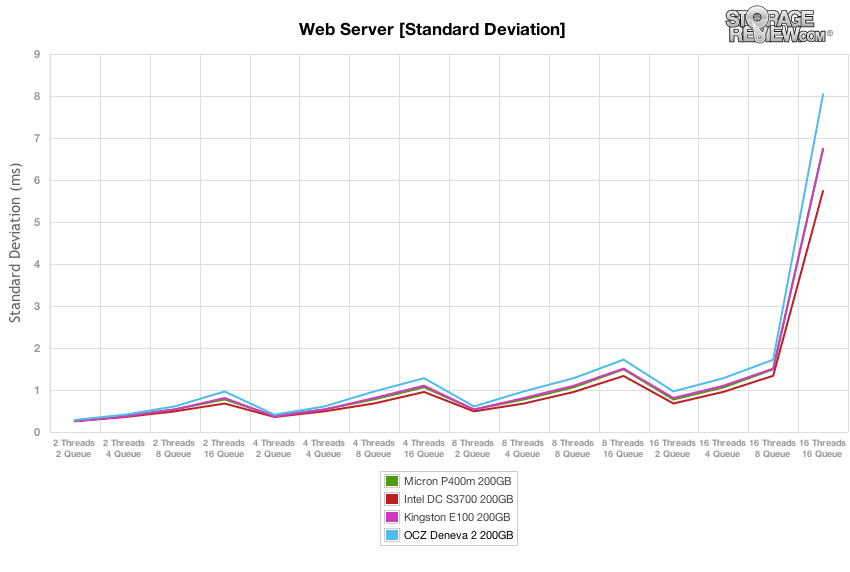
Comparing latency standard deviation in our Web Server test, the OCZ Deneva 2 R was fairly competitive until 16T/4Q, though it trailed the pack as effective queue depth picked up.
Conclusion
The Deneva 2 is OCZ’s mainstream SATA enterprise SSD offering that illustrates that one drive doesn’t have to fit all needs. While most enterprise SSD vendors show an array of products ranging from read-intensive entry-enterprise environments to high-performance mixed workload SAS use cases, OCZ’s plan is more fluid. They offer up essentially any NAND variety mixed in with optional power-fail protection and over provisioning (R series). While this kind of model could be construed as a complicated offering since there are so many configurations, the reality is that OCZ is attempting to offer products that can be customized for specific application requirements. Whether or not this flexibility is necessary in the SATA enterprise space which tends to be less application-specific and more cost-conscious is certainly up for debate. However, OCZ has an answer there as well; their standard issue C series Deneva 2 can be purchased in single units at retail.
The Deneva 2 competes in a tough market with heavyweights that include the new Intel DC S3700 as well as the Micron P400m that compete in the same price category. In traditional synthetic benchmarks, the 24nm-based Deneva 2 comes in towards the bottom of the pack, trailing the Kingston E100 which offers a similar SandForce-build, but has opted to stick with more expensive 34nm-NAND. The move down to 24nm helps on pricing, as well as long-term viability as fabs direct manufacturers scale into their newer 2xnm offerings. While traditional benchmarks might paint a bleak outlook, in our new application-level testing, the Deneva 2 ranked fairly well. In lowest overall average latency, it tested well at second place behind the Intel S3700, but ahead of the Kingston E100 and Micron P400m. This of course underscores the reason why application benchmarking is superior to generalized synthetic I/O monitoring as both the enterprise and storage vendor are measured for success with application performance being the core metric.
Pros
- Fastest SandForce-based Enterprise SATA SSD in NoSQL workload
- Offered in a wide range of capacities and NAND configurations
Cons
- Slower than Kingston E100 in synthetic workloads
- Not offered in 7mm z-height
Bottom Line
The OCZ Deneva 2 R is a high-performance SSD that enables the enterprise to customize the drive to their needs for economics and performance requirements.


 Amazon