

Like the mSATA model, the Samsung 850 EVO M.2 is very similar to its impressive 2.5 inch brethren; however, it has the added benefit of not being limited by mSATA’s legacy architecture. Another advantage of the M.2 form factor is that it comprised of a much smaller footprint compared to traditional SSD sizes, all without having to sacrifice capacity. Its unique thin and light form factor also allows the tiny storage solution to be deployed in wide range of use cases, everything from the most recent Ultrabooks that require high performance, to the latest tablets.
As is the case with the other Samsung 850 EVO models, the M.2 version features power-saving functionality, enabling users to use their device longer and more efficiently. Samsung indicates that the 850 EVO M.2 saves upwards of 30% more on power compared to 840 EVO during write operations due to the company’s use of the new 3D V-NAND, translating to roughly half the power of Planar 2D NAND. In addition, the 850 EVO M.2 includes a Device Sleep mode, which operates at 2mW to extend battery life on laptops.
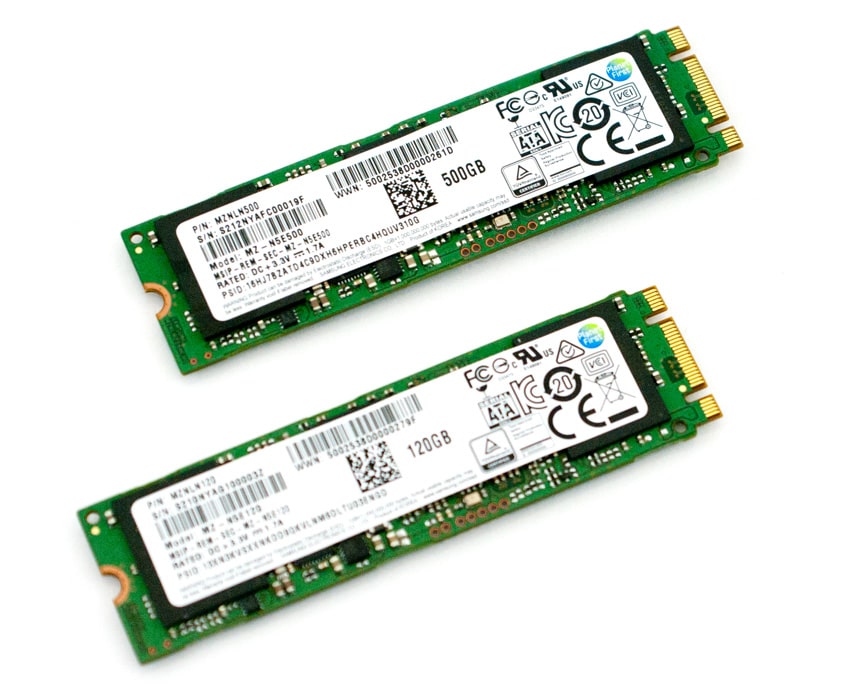
The Samsung 850 EVO M.2 comes with a 5-year warranty and ships in capacities of 120GB ($80), 250GB ($130), and 500GB ($230). We will be looking at the 120GB and 500GB units for this review.
Samsung 850 EVO M.2 Specifications
- Capacities: 120GB, 250GB, 500GB
- Dimensions (LxWxH): Max 80.15 x Max 22.15 x Max 0.8 (mm)
- Interface: SATA 6Gb/s (compatible with SATA 3Gb/s and SATA 1.5Gb/s)
- Form Factor: M.2 (2280)
- Controller: Samsung MGX controller
- NAND Flash Memory: Samsung 32 layer 3D V-NAND
- DRAM Cache Memory: 512MB LPDDR3
- Performance:
- Sequential Read: Max. 540 MB/s
- Sequential Write: Max. 500 MB/s
- 4KB Random Read (QD1): Max. 10,000 IOPS
- 4KB Random Write (QD1): Max. 40,000 IOPS
- 4KB Random Read (QD32): Max. 97,000 IOPS
- 4KB Random Write (QD32): Max. 89,000 IOPS
- Weight Max: 7g (500GB)
- Power Consumption:
- Active Read/Write (Average): Max. 2.4W(500GB)/ Max. 3.5W(1TB)
- Idle: Max. 50mW, Device Sleep: 2mW
- Warranty: 5 -years
Design and Build:
The Samsung 850 EVO M.2 SSD is significantly smaller and lighter than the traditional 2.5 inch SSDs and less than half the size of a stick of RAM. When compared to the mSATA form factor, though it is a bit larger in length, the M.2 is much smaller in width. Like all devices of this type, the 850 EVO M.2 also does not have a casing, leaving its components exposed.
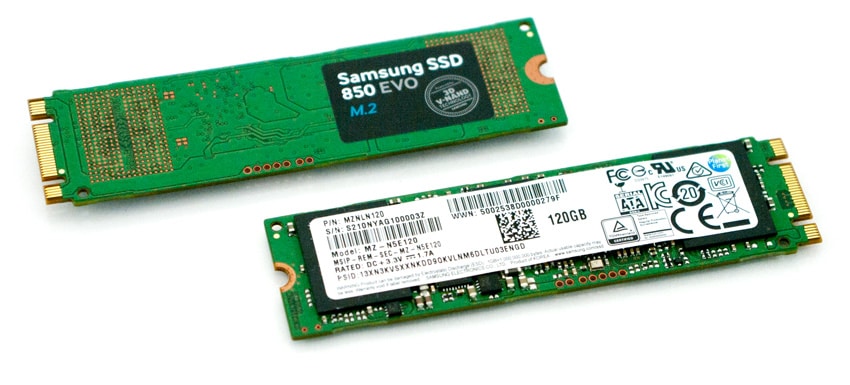
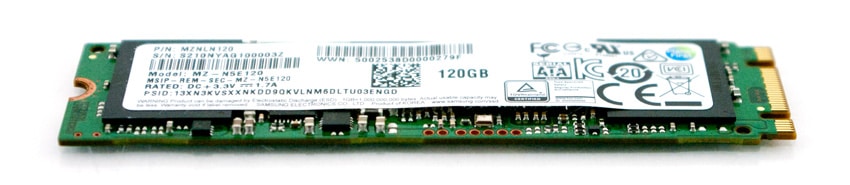
The front side is branded with a sticker, partially covering two of the NAND chips. The other side has a more detailed sticker, which lists the part number as well as other details about the drive.
The other side is also home to the other two NAND packages. Unlike the mSATA version, all capacities use the Samsung MGX controller.
Consumer Synthetic Benchmarks
All consumer SSD benchmarks are conducted with the StorageReview HP Z620 Workstation.
With the Samsung SSD 850 EVO M.2 SSD, we tested the raw drive only and without RAPID turned on.
In our first test, which measures 2MB sequential performance, the Samsung 850 EVO M.2 (500GB) measured 488.39MB/s read and 461.09MB/s write. As was the case with the mSATA units, the 120GB model had similar read speeds (490.50MB/s) though it posted significantly slower write activity at 223.50MB/s.
Our next test looks at 2MB random transfer performance. Here, the Samsung 850 EVO M.2 500GB recorded read and write activity that measured 476.34MB/s and 396.18MB/s, while the 120GB model posted 475.92MB/s read with only 153.84MB/s write.
Moving to smaller 4k random transfers (throughput), the Samsung 850 EVO M.2 500GB measured and impressive 10,963.82 IOPS for read activity and 30,611.92 IOPS for write activity. The 120GB model also recorded impressive numbers with a read IOPS of 9,957.16 and a write IOPS of 27,702.19.
Next, we measured the Samsung M.2 drives in MB/s. In this benchmark, the 120GB drive boasted read and write performance of 38.90MB/s and 108.21MB/s, respectively. The 500GB drive recorded slightly better results with read and write activity hitting 42.83MB/s and 119.58MB/s, respectively.
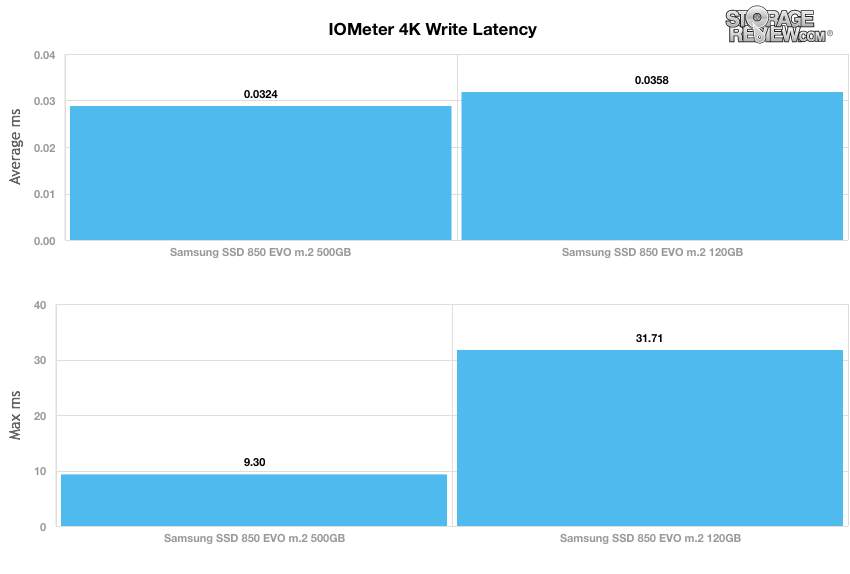
When looking at average write latency of the Samsung M.2 drives, the 500GB posted a very impressive average response time and peak latency at 0.0324ms and 0.0358ms respectively. The 120GB model posted a great average response time with 0.0358ms, though it had a much higher peak latency at 31.71ms. This discrepancy also occurred between the two 850 EVO capacities when we looked at the mSATA models.
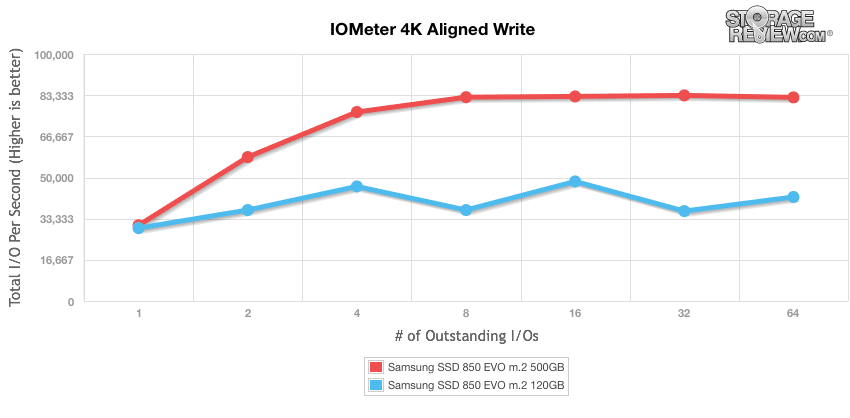
Our next test shifts to a 4K random workload with 100% write activity that scales from 1QD to 64QD. Here, the Samsung 850 EVO M.2 120GB measured 29514.70 IOPS to only 42,100.44 IOPS. The 500GB model, however, had burst speed of 30,648.84 IOPS and ended with a much higher 82,436.85 IOPS.
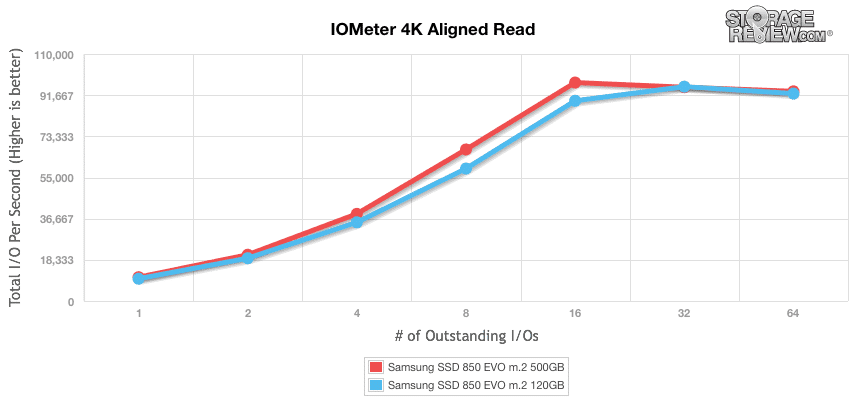
Moving to read activity, results were much more equal between the two capacities. Here, the Samsung 850 EVO M.2 120GB recorded a range of 9,927.77 IOPS at QD1 while peaking at 92,387.46 IOPS in the terminal queue depths. The 500GB model performed slightly better with a range of 10,592.89 IOPS and 93,374.28 IOPS in the last queue depth.
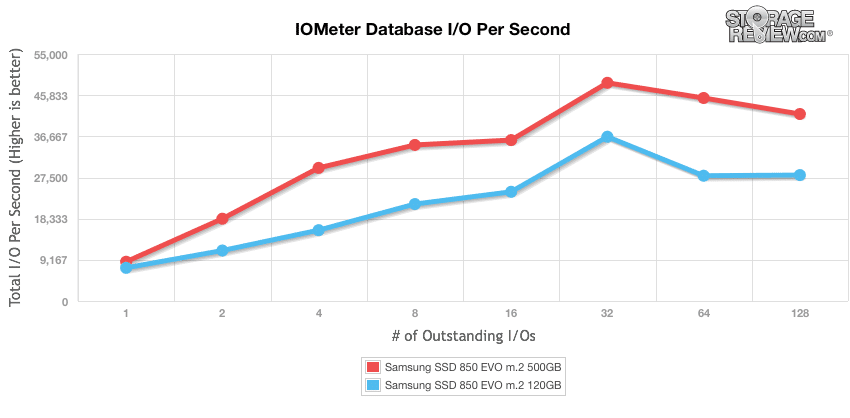
Our last series of synthetic benchmarks compare the hard drives in a series of server mixed-workloads with a queue depth of ranging from 1 to 128. Each of our server profile tests has a strong preference towards read activity, ranging from 67% read with our database profile to 100% read in our web server profile.
The first is our database profile, which consists of a 67% read and 33% write workload mix primarily centered on 8K transfer sizes. In this trace, the 500GB Samsung 850 EVO M.2 ranged from 8,738.30 IOPS in burst and reaching 41,638.77 IOPS in the terminal queue depths. The 120GB model measured 7,387.38 in the first QD, while reaching a much lower 28,042.26 IOPS by 128QD.
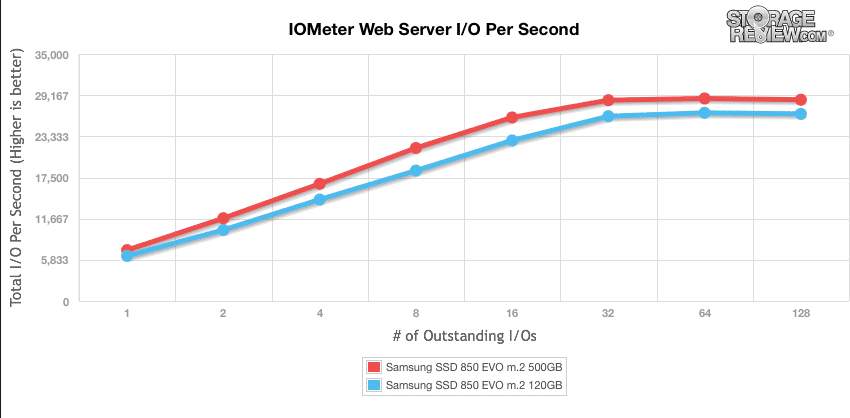
The next profile looks at a webserver, with 80% read and 20% write workload spread out over multiple transfer sizes ranging from 512-byte to 64KB. The Samsung 850 EVO 500GB boasted 7,212.09 IOPS QD1 and 28,525.43 IOPS in 128QD. The 120GB model posted a slightly lower 128QD throughput of 26518.26 IOPS.
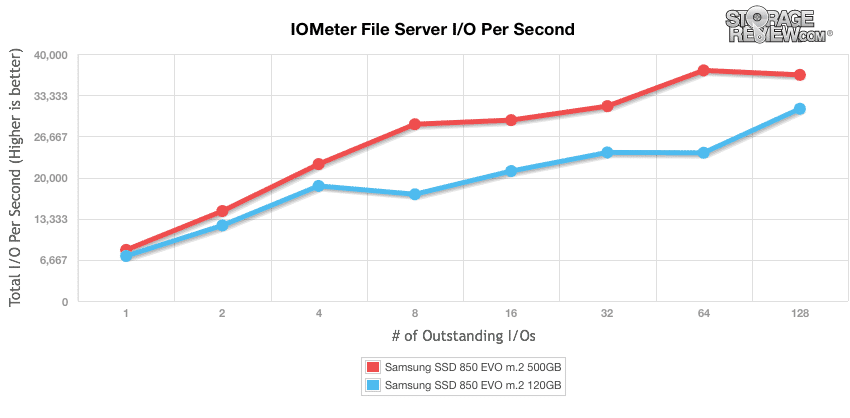
Our file server profile is read-only with a spread of transfer sizes from 512-byte to 512KB. The Samsung 850 EVO M.2 500GB showed a QD1 of 8,271.93 IOPS and a QD128 of 36,618.94 IOPS. The 120GB measured slightly lower once again with a throughput in the terminal queue depths of 31,133.33 IOPS.
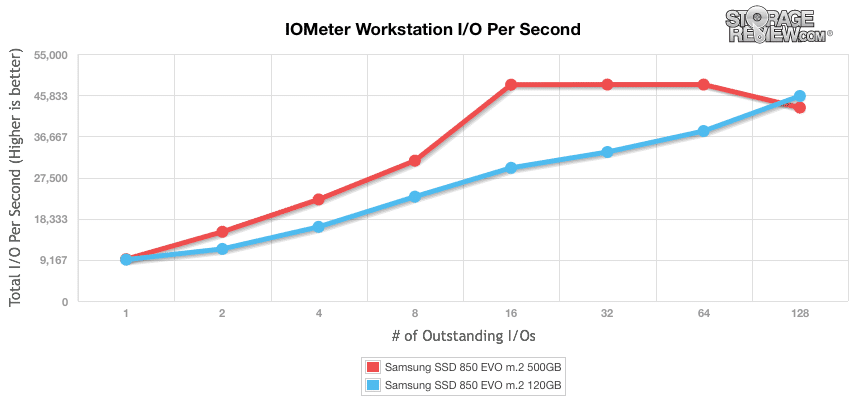
The last profile looks at workstation activity, with a 20% write and 80% read mixture using 8K transfers. This time, the 120GB model posted better numbers, with range of 92,14.55 IOPS to 45,654.76 IOPS. The 500GB model posted ranged from 9,316.90 IOPS in burst speed to 43,068.11 IOPS in the terminal. It should be noted that its mSATA (1TB) brethren posted much weaker results.
Consumer Real-World Benchmarks
For the average consumer, trying to translate random 4K write speeds into an everyday situation is pretty difficult. It helps when comparing drives in every setting possible, but it doesn’t exactly work out into faster everyday usage or better game loading times. For this reason we turned to our StorageMark 2010 traces, which include HTPC, Productivity, and Gaming traces to help readers find out how a drive might rank under these conditions.
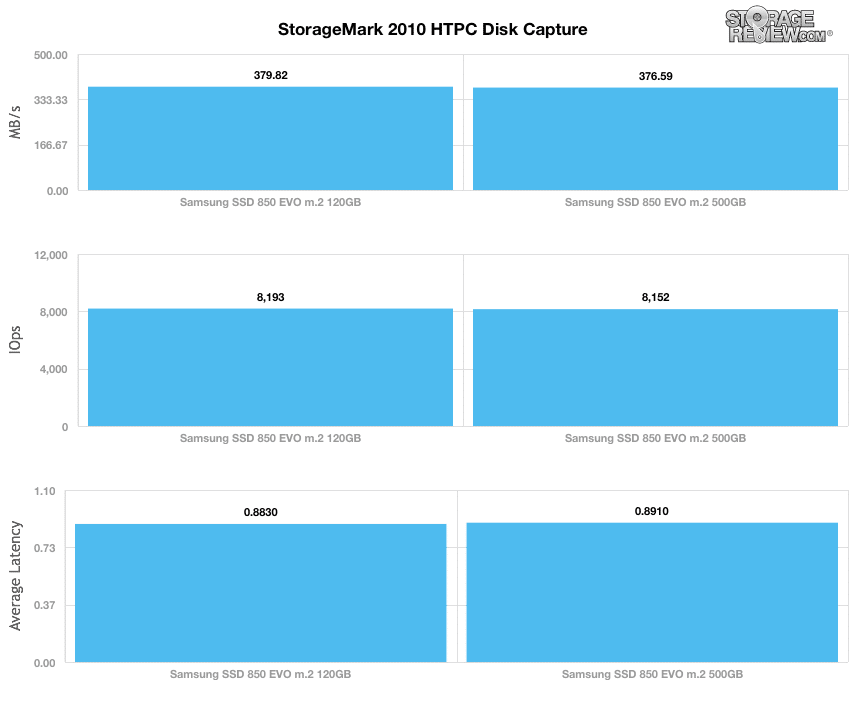
The first real-life test is our HTPC scenario. In this test we include: playing one 720P HD movie in Media Player Classic, one 480P SD movie playing in VLC, three movies downloading simultaneously through iTunes, and one 1080i HDTV stream being recorded through Windows Media Center over a 15 minute period. Higher IOps and MB/s rates with lower latency times are preferred. In this trace we recorded 2,986MB being written to the drive and 1,924MB being read.
In our HTPC profile, the 500GB EVO posted an average speed of 376.59MB/s, 8,152 IOPS and 0.890ms in average latency, while the 120GB measured similar results with 379.82MB/s, 8,193.33 IOPS, and 0.8830ms in average latency.
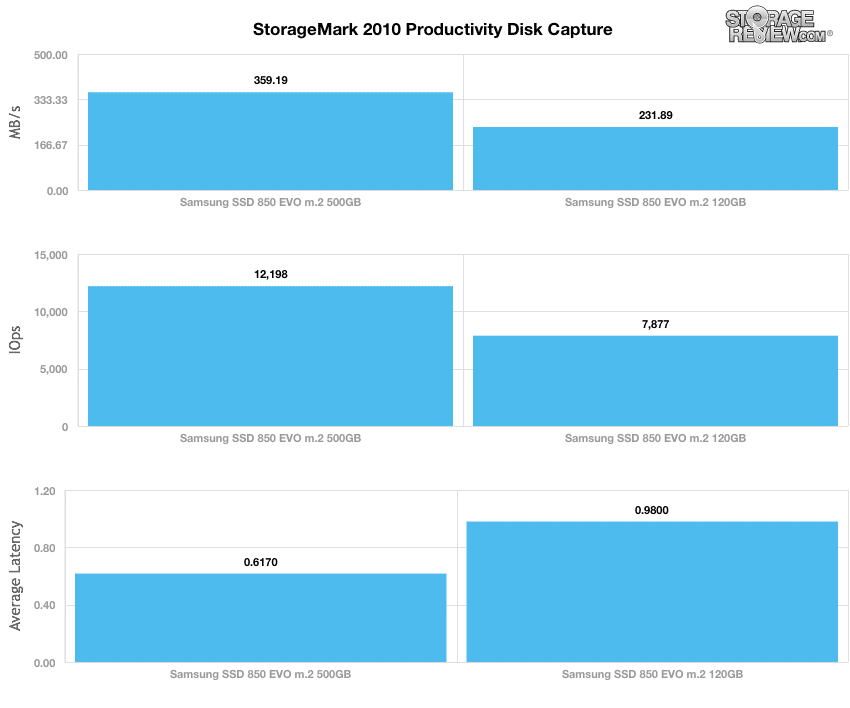
Our second real-life test covers disk activity in a productivity scenario. For all intents and purposes, this test shows drive performance under normal daily activity for most users. This test includes: a three hour period operating in an office productivity environment with 32-bit Vista running Outlook 2007 connected to an Exchange server, web browsing using Chrome and IE8, editing files within Office 2007, viewing PDFs in Adobe Reader, and an hour of local music playback with two hours of additional online music via Pandora. In this trace we recorded 4,830MB being written to the drive and 2,758MB being read.
In our Productivity trace, the 500GB Samsung 850 EVO dominated its 120GB brother, registering 12,198 IOPS, 359.19MB/s, and 0.617ms in average latency. The 120GB model posted 7,877 IOPS, 231.89MB/s, and 0.98ms.
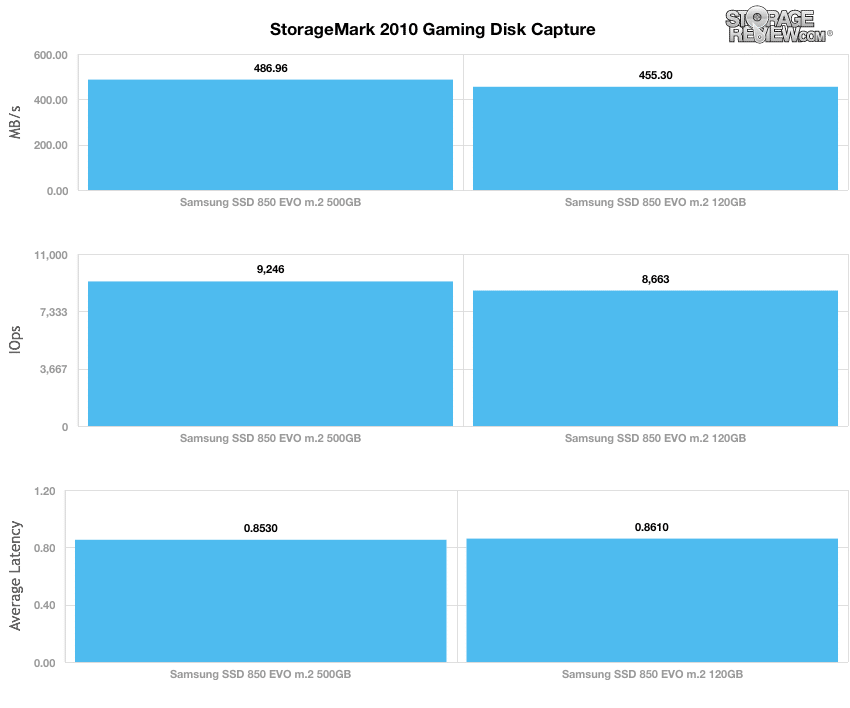
Our third real-life test covers disk activity in a gaming environment. Unlike the HTPC or Productivity trace, this one relies heavily on the read performance of a drive. To give a simple breakdown of read/write percentages, the HTPC test is 64% write, 36% read, the Productivity test is 59% write and 41% read, while the gaming trace is 6% write and 94% read. The test consists of a Windows 7 Ultimate 64-bit system pre-configured with Steam, with Grand Theft Auto 4, Left 4 Dead 2, and Mass Effect 2 already downloaded and installed. The trace captures the heavy read activity of each game loading from the start, as well as textures as the game progresses. In this trace we recorded 426MB being written to the drive and 7,235MB being read.
In our read-intensive Gaming trace, the Samsung 850 EVO 500GB model had slightly better results with 486.96MB/s, 9,246 IOPS, and an average latency of 0.8530ms. The 120GB unit posted 455.30MB/s, 8,663 IOPS, and an average latency of 0.8610ms.
Conclusion
Like its mSATA brethren, the Samsung 850 EVO M.2 is architected for small form factor computing in devices such as tablets and ultrabooks. Though both form factors are considered companion products to 2.5″ 850 EVO line and both come equipped with Samsung’s advanced 3D V-NAND, the newer M.2 technology holds a few advantages over the mSATA form factor due to its versatility, allowance for different module widths and lengths, and more advanced features. It is these advantages that have given favor to the M.2. over the mSATA over the past few years. That being said, its equipped 3D V-NAND technology allows the Samsung 850 EVO M.2 to get the most out of its computing performance as well as the ability to maximize reliability. The 850 EVO M.2 also features Device Sleep functionality so that it can operate in an idle state at a very power efficient 2mW, which allows it to maximize battery life. This is vital to the M.2’s overall value, as this drive will likely reside in a mobile computing devices where system uptime usually depends the availability of power.
When looking at its performance, it comes as no surprise that this little device showed us some pretty impressive numbers in many of our categories based on what we saw with the previous 850 EVO form factors. This impressive performance was underlined by its showing in our smaller file consumer synthetic workloads. In our 4k random transfers, the Samsung EVO M.2 measured 10,963.82 IOPS for read activity and 30,611.92 IOPS for write activity (which were better results than the mSATA) while the 120GB model also recorded very respectable numbers with a read IOPS of 9,957.16 and a write IOPS of 27,702.19. As we mentioned in our previous reviews, however, the 840 EVO outperformed the M.2 850 EVO during the 2MB random and sequential benchmarks by a clear margin. In addition, the performance of the M.2 model clearly struggled during our consumer real-world benchmarks with consistently sub-par results that were sometimes significantly lower than its mSATA brethren.
When it comes down to it, selection is still very limited when it comes to the M.2 form factor, so it’s a fairly big deal to have a quality and modern option available to consumers with ultra-thin computing devices. As is the case with the mSATA model, it also allows certain specialized products that require embedded storage to have a high-performing 500GB drive residing in it. In addition, though the Samsung 850 EVO M.2 did lack a bit of punch in several of our tested areas, we were otherwise very impressed with the results. Couple this with its low power-consumption, and you have the best available drive of its class, further demonstrating Samsung’s dominance in all areas of the SSD industry.
Pros
- Very power efficient
- Great overall performance
- High capacity in a tiny form factor
Cons
- Performance lacking in our consumer real-world benchmarks
Bottom Line
With the release of with the 850 EVO M.2, Samsung has made yet another strong addition to its extensive SSD portfolio, which offers 500GB of capacity, great power efficiency, and impressive overall performance; all in a tiny form factor.


 Amazon