

Samsung has announced its latest 2.5-inch, 7mm SSD solutions, the SSD 840 and SSD 840 Pro. StorageReview has been working with an SSD 840 Pro review unit in our lab to see whether Samsung has continued to build on the accomplishments of the SSD 830 and SSD 470. Like the SSD 830 and SSD 470, the SSD 840 Pro is designed entirely with Samsung components, with purported benefits of durability, compatibility and product support. The SSD 840 Pro is intended to be competitive in the enthusiast, prosumer, and entry enterprise space.
The past year brought several enhancements to Samsung’s SSD platform. The SSD 840 Pro features a Samsung MDX triple-core ARM 9 controller clocked at 300MHz, 50MHz faster than the SSD 830’s controller. Samsung’s SSD strategy does not include drive-based data compression, due to what Samsung considers to be inconsistent benefits and performance from on-the-fly compression. With the controller freed of the data compression role, those processor resources can instead be used to perform other optimizations.
The SSD 840 Pro’s 2x-nanometer toggle DDR2 NAND chips are also an upgrade from the previous generation of Samsung SSDs, with support up to 400 megabits per second (Mbps) data transfer rates. The SSD 840 Pro uses a new version of Samsung’s SSD firmware that includes support for the drive’s integrated 256 AES encryption.
Samsung is the only SSD maker that designs and manufactures all of its key components. With its NAND flash, drive controllers, and DDR2 DRAM all developed under the same roof, the SSD 840 Pro has a leg up on other SSD platforms which must integrate technology from several vendors. An all-Samsung drive means that the company is both positioned to achieve the best performance from individual components and that Samsung can respond more quickly with firmware updates to any problems with the SSD 840 Pro.
SSD 840 vs. SSD 840 Pro
Samsung has also announced the SSD 840, designed with triple-level cell (TLC) NAND and intended for mainstream use. We have not seen specifications yet for the SSD 840, but we do know that this is the first commercialization of TLC SSD technology and that the SSD 840 will have a three year warranty compared to the SSD 840 Pro’s five years. While OCZ was the first to announce TLC-based SSDs, Samsung’s SSD 840 will be first to market. It will be particularly interesting to see Samsung’s endurance benchmarks for a TLC NAND drive, as in our briefing on the drive they claimed a 20-year useful life of both drives, which sounds fantastical given the known limitations of TLC NAND. To date TLC NAND has been found suitable only for applications like USB drives, SD cards and certain lightweight embedded applications.
SSD 840 Pro Specifications
- Capacities: 64GB ($99), 128GB ($149), 256GB ($269), 512GB ($599)
- Form Factor: 2.5-inch, 7mm
- Interface: Serial ATA 3.0, up to 6GB/sec
- Controller: 3-core MDX controller (300MHz)
- Memory Type: 2x-nm class DDR2 toggle-mode NAND (400 Mbps)
- AES-256 full drive encryptions
- Warranty: Five (5) years
SSD 840 Specifications
- Capacities: 120GB ($109), 250GB ($199), 500GB ($449)
SSD 840 Pro Manufacturer Benchmarks (512GB AND 256GB)
- Sequential Write: 450MB/sec
- Random Read: 100,000 IOPS
- Random Write: 78,000 IOPS
- Active Power Use: 0.068W
- Idle Power Use: 0.042W
Video Overview
Design and Build
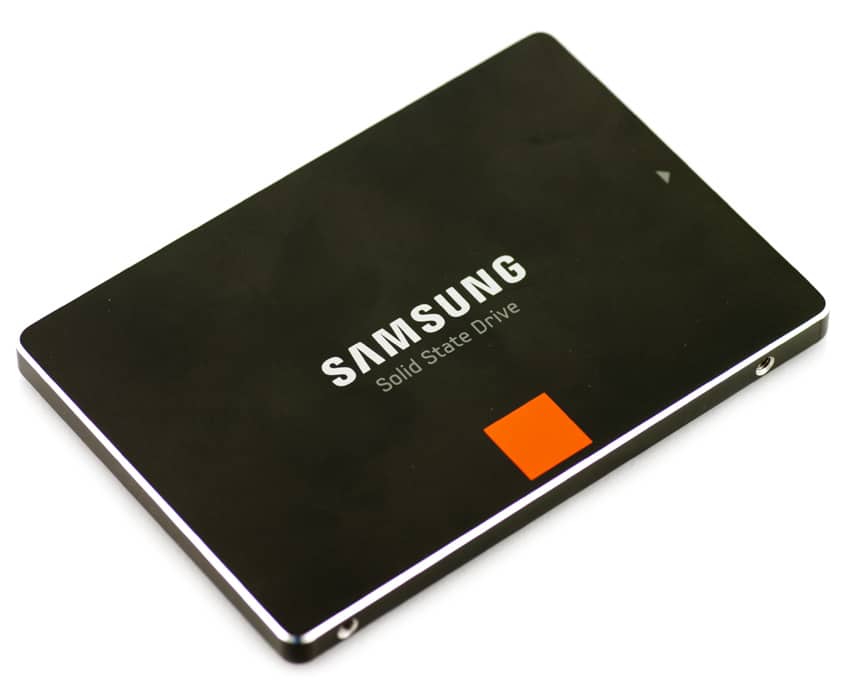
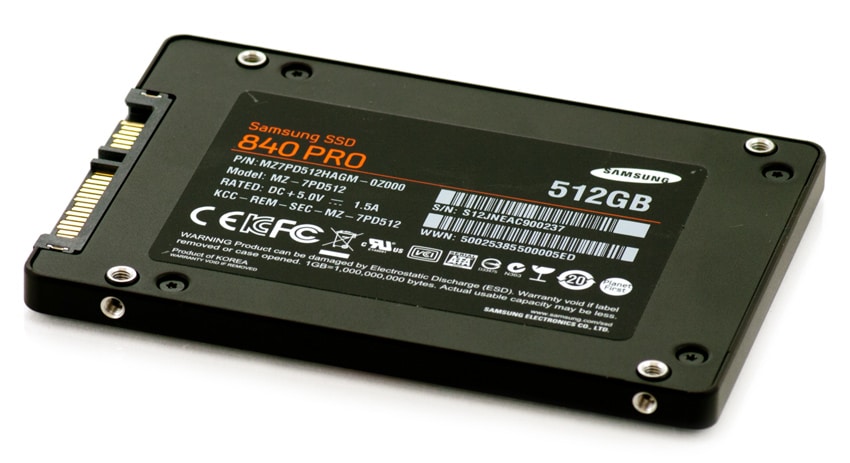
The SSD 840 Pro sports an updated look from the SSD 830, but one that very much builds on Samsung’s tradition of simple, clear labeling. The drive features a brushed metal top, while the bottom features a label with key information about the drive. The SSD 840 Pro offers LED support for visual drive monitoring in data center applications.
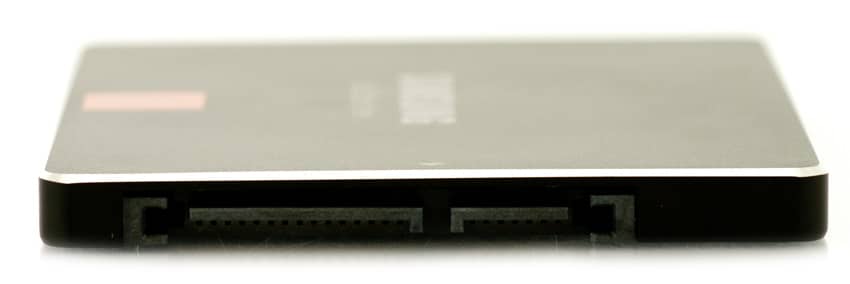
A better-protected SATA interface connector is one of the SSD 840 Pro’s design enhancements on the SSD 830.
Disassembly
Unlike the SSD 830, which used internal clips to hold together its chassis, the SSD 840 Pro can be unscrewed, simplifying the disassembly process.
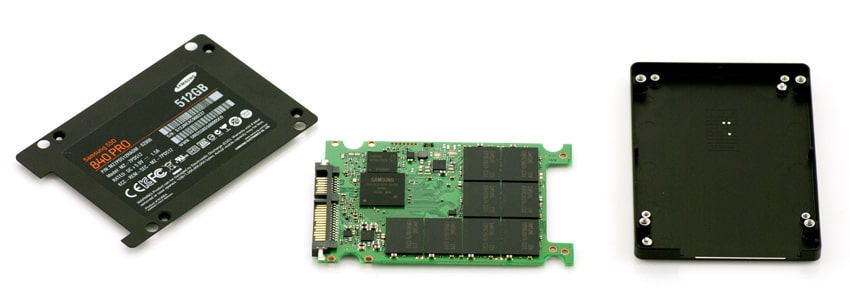
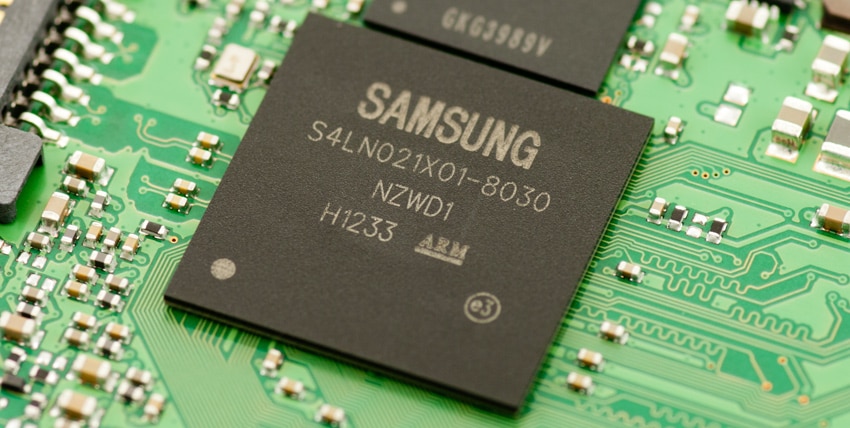
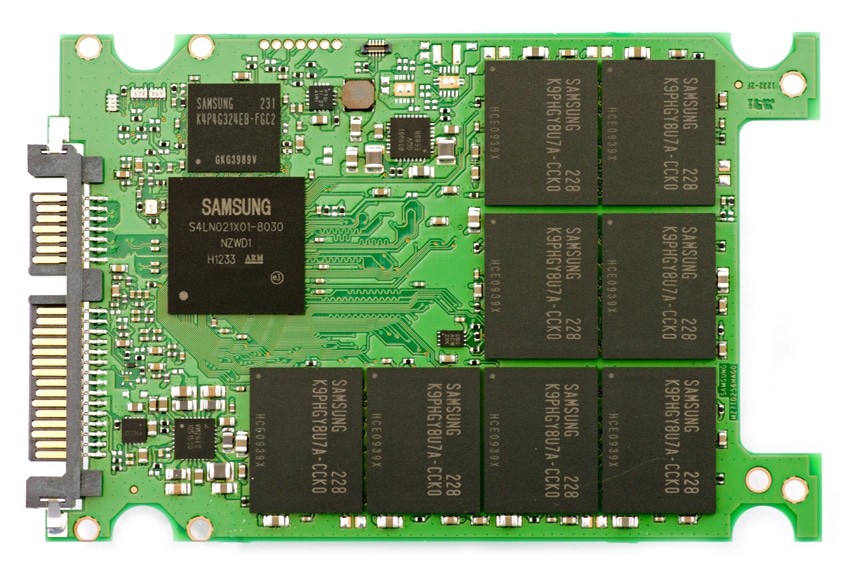
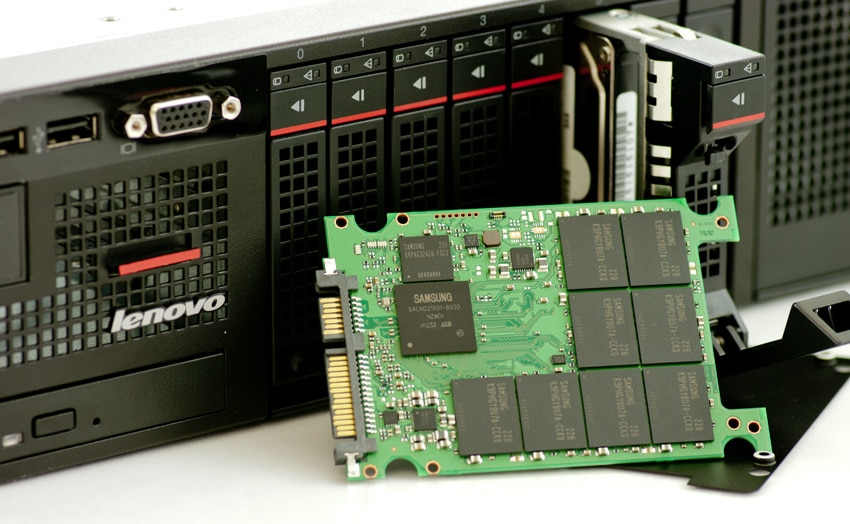
There are significant changes from the layout of the SSD 830’s circuit board. The SSD 840 Pro uses a Samsung MDX S4LN021X01-8030 controller with 256 MB 2x-nm class DDR2 toggle-mode NAND from a K4P4G324EB-FGC2 module.
Primary storage is provided by eight K9PHGY8U7A-CCK0 modules.
Consumer Synthetic Benchmarks
All consumer SSD benchmarks are conducted with the StorageReview client testing platform. The comparables used for this review include:
- Kingston HyperX SSD (240GB, SandForce SF-2281, Intel 25nm NAND, SATA)
- OCZ Vertex 3 MAX IOPS (240GB, SandForce SF-2281, Toshiba 32nm MLC NAND, SATA)
- Intel SSD 520 (240GB, SandForce SF-2281, Intel 25nm NAND, SATA)
- Plextor PX-M5S (256GB, Marvell 9174, Micron 25nm MLC NAND, SATA)
- Samsung SSD 830 (256GB, 250mhz Samsung 3-core MCX controller, Samsung 2x nm Toggle NAND Flash, SATA)
- Corsair Neutron GTX (240GB, LAMD LM87800, Toshiba 24nm toggle NAND, SATA)
- OCZ Vertex 4 (512GB, Indilinx Everest 2, Intel 25nm MLC NAND, SATA)
All IOMeter figures are represented as binary figures for MB/s speeds.
Samsung has published a benchmark of 450MB/s sequential read and write for the 512 SSD 840 Pro, which we have been able to consistently exceed in IOMeter’s 2MB test. The SSD 840 Pro scored the highest of any of the comparables in both the read and write tests.
In our 2MB random transfer test the SSD 840 Pro was not able to pull ahead of the comparables as with the sustained 2MB test, but it does perform near the head of the pack.
In IOMeter’s random 4K read and write test the SSD 840 Pro performs admirably in the read test, leading all of the comparables with a 33.47 MB/s performance. Write performance is much less competitive with a middling 67.1 MB/s in random 4K writes.
Our random 4k test pushes hard on the drives, reaching a moderate 17,284 IOPS for write and a chart-topping 8,568 IOPS for read.
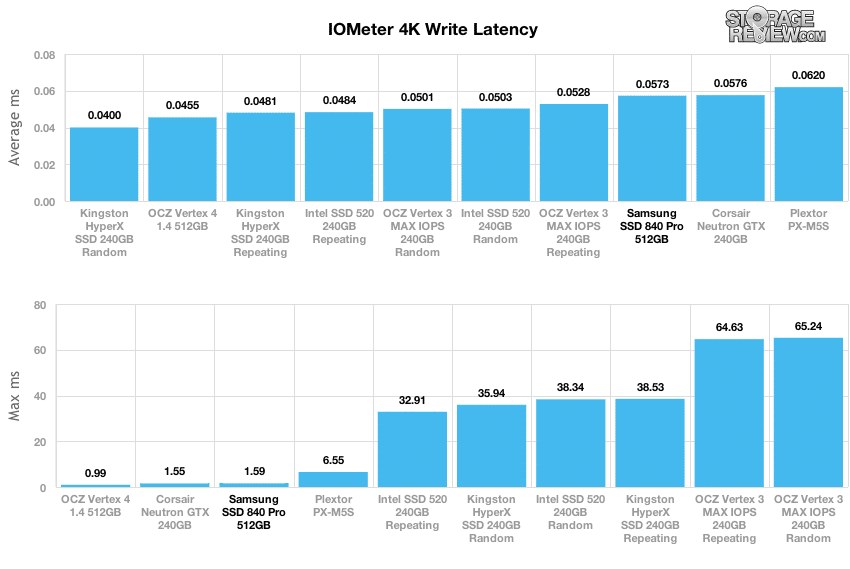
The SSD 840 Pro does little to distinguish itself on the average latency in our 4k write test, scoring 0.0573ms. Unlike some comparables, Samsung SSD 840 Pro does not suffer from occasional 30ms-plus latency times, however.
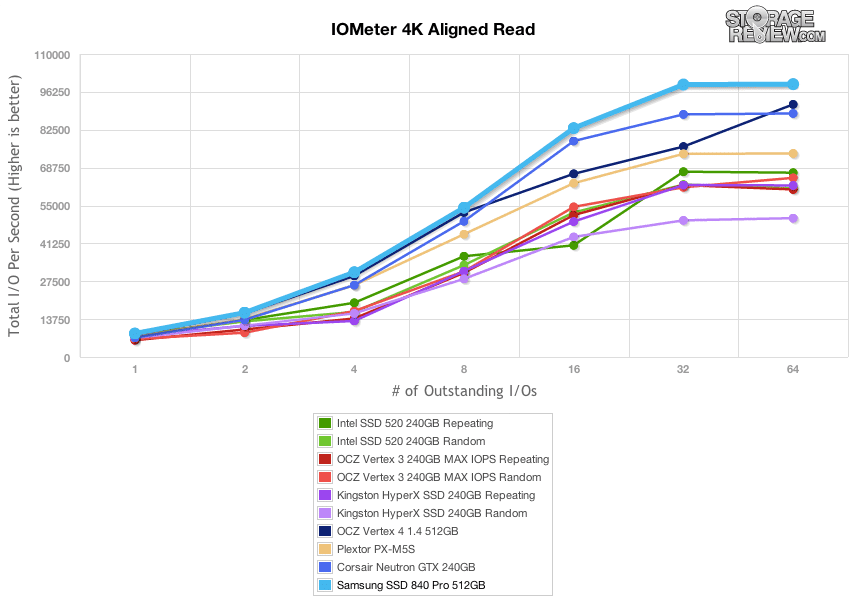
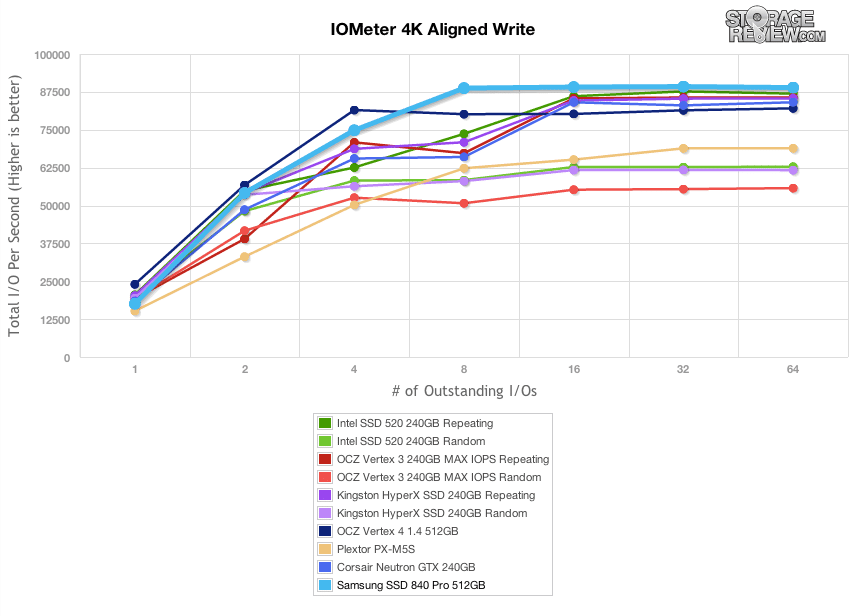
The previous benchmarks use a shallow queue depth to look at performance. The next chart scales the queue from depths of 1 to 64, showing how the drive responds to increased load. Throughout the random 4K read test, the SSD 840 Pro maintains its sizable lead over the comparables.
What looks like poor write performance from the SSD 840 Pro with shallow queues transforms at higher queue depths to beat out all of the comparable drives.
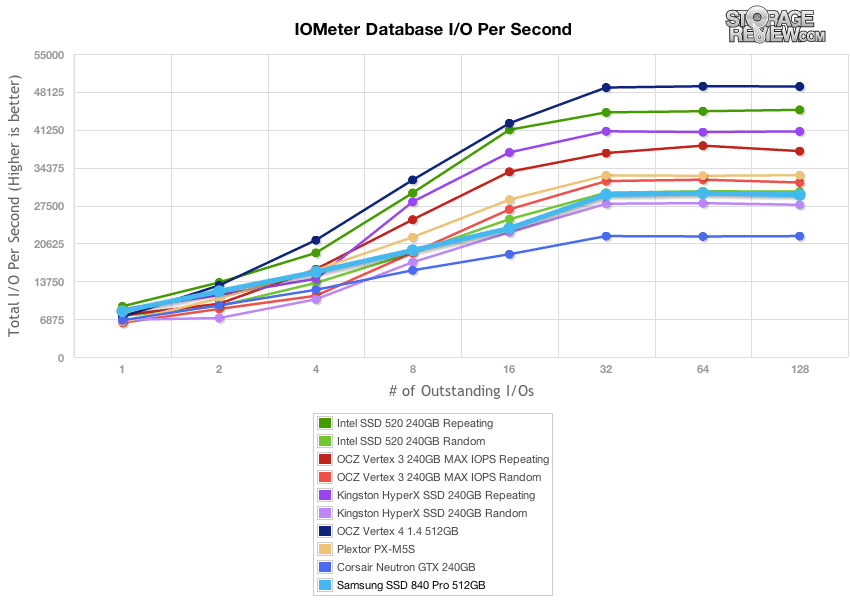
Our final consumer synthetic benchmarks compare the drives in a series of mixed server workloads with a queue depth from 1 to 128. Each server profile has a strong bias towards read activity, ranging from 67% read with the database profile to 100% read in the web server profile.
The database profile features a 67% read and 33% write workload focusing on transfers around 8K in size. Once the queue depth rises above two, the SSD 840 Pro doesn’t break out of the bottom third of the comparables.
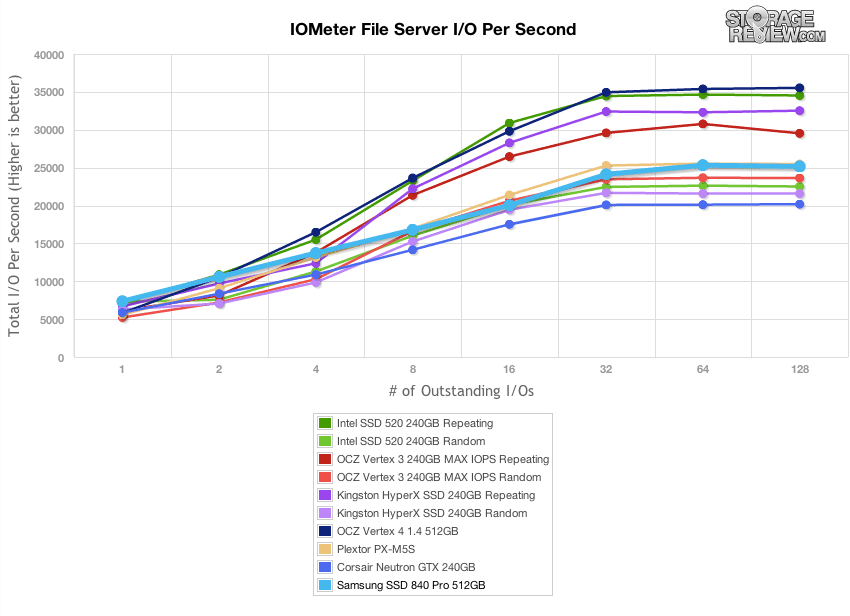
The next profile models file server storage, with 80% read and 20% write spread over transfer sizes from 512B to 64KB. The SSD 840 Pro offers middle of the road performance in the file server profile.
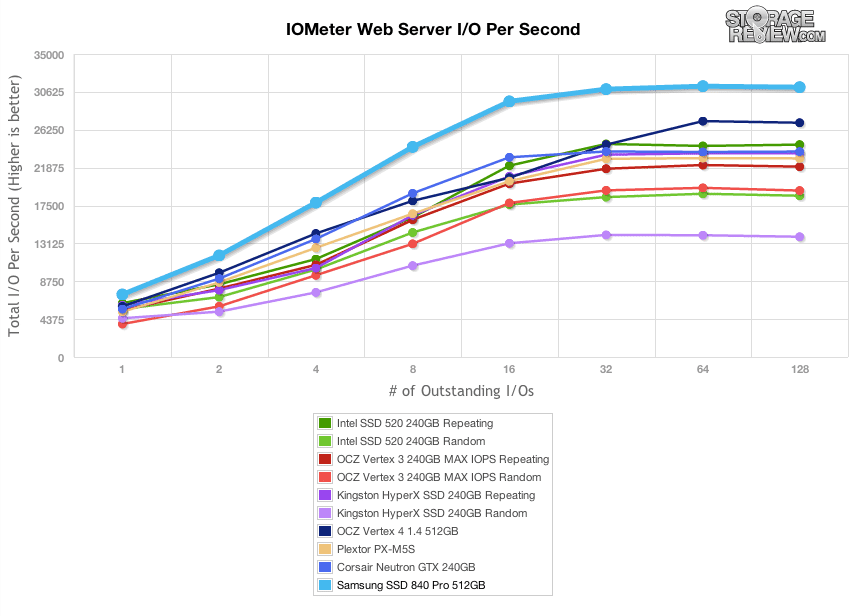
The web server profile is read-only, with transfer sizes ranging from 512B to 512KB. This benchmark plays right to the SSD 840 Pro’s strengths, which remains head and shoulders above the comparables at all queue depths.
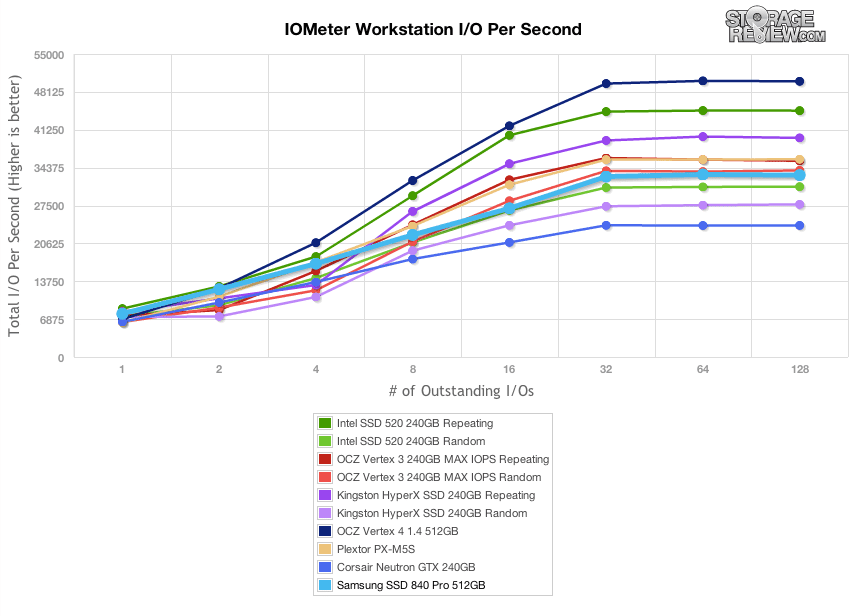
The workstation profile uses 20% write and 80% read operations with an 8K transfer size. The SSD 840 Pro manages a decent showing, but does not distinguish itself on performance in this benchmark.
Consumer Real-World Benchmarks
While the results of synthetic benchmarks are important to identify the key strengths and weaknesses of a drive, performance in these tests does not always translate directly into real-world situations. To get a better idea how the Samsung SSD 840 Pro will handle itself in the field we will chart StorageMark 2010 HTPC, Productivity, and Gaming traces against comparable drives. Higher IOPS and MB/s rates with lower latency times are preferred.
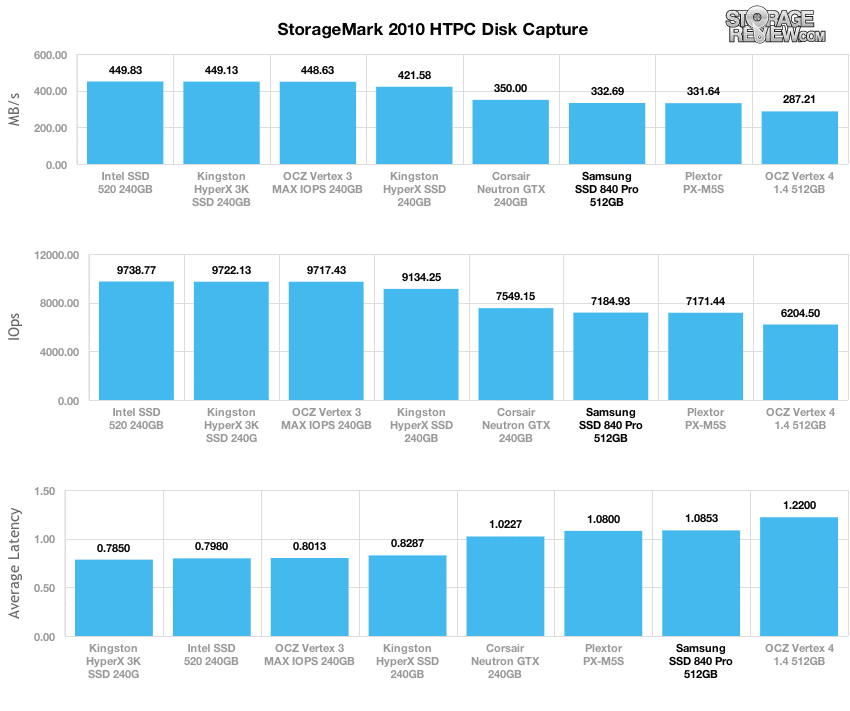
The first traced is based on use as a Home Theater PC (HTPC). The test includes playing one 720P HD movie in Media Player Classic, one 480P SD movie playing in VLC, three movies downloading simultaneously through iTunes, and one 1080i HDTV stream being recorded through Windows Media Center over a 15 minute period.
The SSD 840 Pro does not fare well in the HTPC trace, coming in at third to lowest throughput and second highest latency.
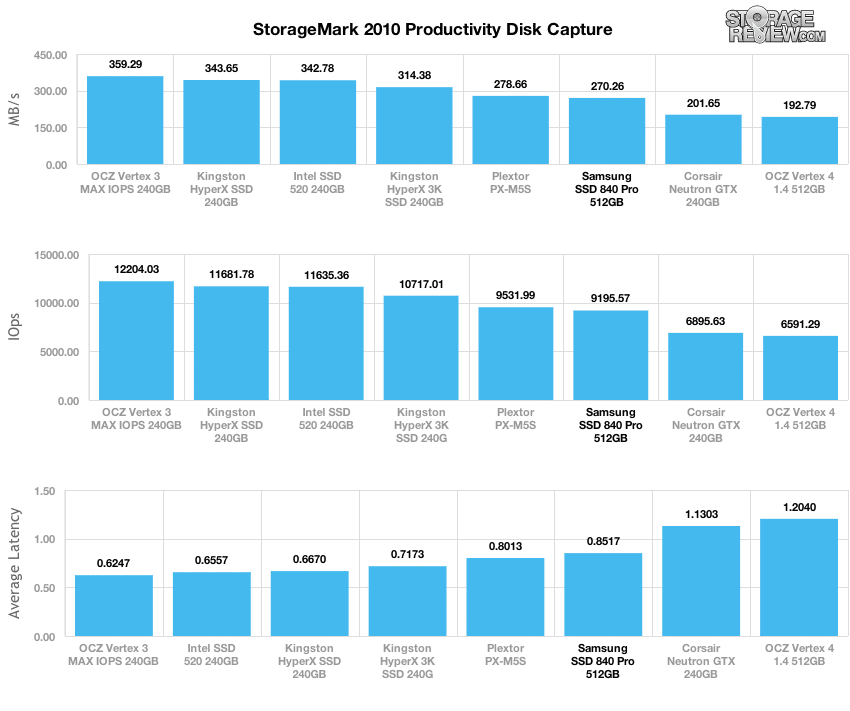
The next trace simulates disk activity in an office workstation or productivity scenario. This test includes three hours of operation in an office productivity environment with 32-bit Windows Vista running Outlook 2007 connected to an Exchange server, web browsing using Chrome and IE8, editing files within Office 2007, viewing PDFs in Adobe Reader, an hour of local music playback, and two hours of streaming music via Pandora.
he SSD 840 Pro has a similar performance in this trace, staying near the bottom of the comparable drives throughout the test.
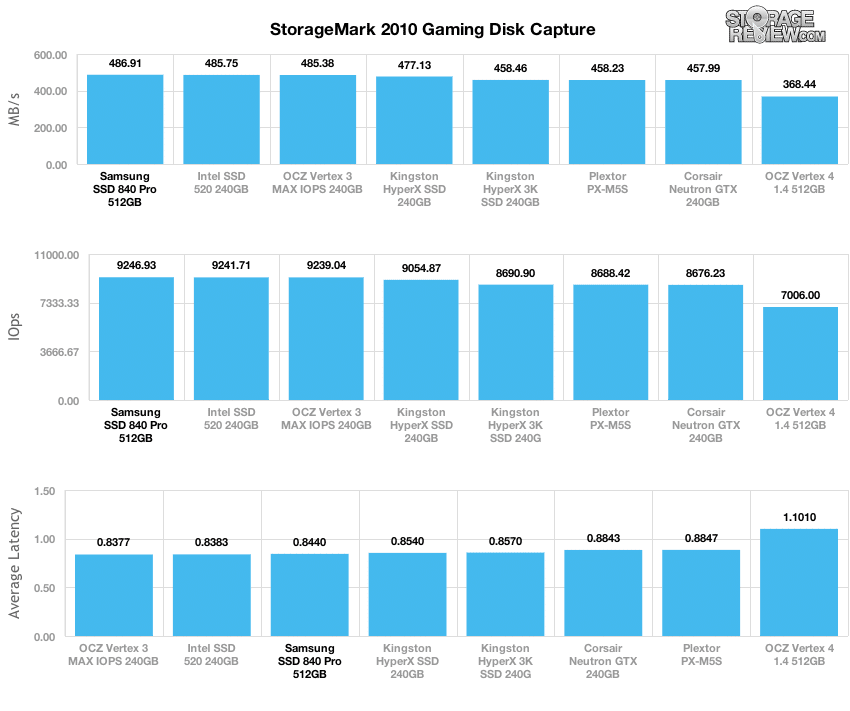
The final consumer real-life benchmark simulates disk activity during gaming. This simulation taxes the drive’s read performance, with 6% write operations and 94% read operations. The test consists of a Windows 7 Ultimate 64-bit system pre-configured with Steam, with Grand Theft Auto 4, Left 4 Dead 2, and Mass Effect 2 already downloaded and installed. The trace captures the heavy read activity of each game loading from the start, as well as textures as the game progresses.
As we would expect, this trace was the chance for the SSD 840 Pro to distinguish itself, with a top performance in MB/s and IOPS and competitive results in latency.
Enterprise Testing Environment
The lines are blurring between the high end of consumer storage and storage for large enterprise arrays. With several compelling enterprise solutions now featuring MLC NAND, we are putting new solid state drives through the full rigor of our Enterprise Testing Lab. StorageReview’s enterprise lab is equipped to create a variety of hardware and network configurations that are found in datacenters, including servers, networking, rack space, and power conditioning/monitoring.
Our consumer tests worked with the optimized capacity of each drive, but for enterprise benchmarks we like to put equal capacities against each other, since larger drives have an inherent benefit in this type of testing. With the previous generation of top-end consumer SSDs coming in 256/240GB capacities, we had to include these with the larger 512GB SSD 840 Pro. To show some of the differences capacity plays in this type of testing, we included the 512GB Vertex 4, as well as the 256GB comparable.
The comparables for this review include:
- Corsair Force GT (240GB, LSI SandForce SF-2281, Toggle MLC)
- Corsair Force GS (240GB, LSI SandForce SF-2281, Synchronous MLC)
- Plextor PX-M5S (256GB, Marvell 9174, Micron 25nm MLC NAND, SATA)
- Samsung SSD 830 (256GB, 250mhz Samsung 3-core MCX controller, Samsung 2x nm Toggle NAND Flash, SATA)
- Corsair Neutron GTX (240GB, LAMD LM87800, Toshiba 24nm toggle NAND, SATA)
- OCZ Vertex 4 (512GB, Indilinx Everest 2, Intel 25nm MLC NAND, SATA)
We tested the drives using our Lenovo ThinkServer RD240, configured with:
- 2 x Intel Xeon X5650 (2.66GHz, 12MB Cache)
- Windows Server 2008 Standard Edition R2 SP1 64-Bit and CentOS 6.2 64-Bit
- Intel 5500+ ICH10R Chipset
- Memory – 8GB (2 x 4GB) 1333Mhz DDR3 Registered RDIMMs
Enterprise Synthetic Workload Analysis
Flash performance varies greatly over the preconditioning phase of each storage device. Our enterprise storage benchmark process analyzes the drive’s total throughput, average latency, peak latency, and standard deviation throughout preconditioning. Since latency is often more important than throughput we will emphasize the full latency characteristics of each drive.
For each workload, each of the comparable drives are secure erased using the vendor’s tools, preconditioned into steady-state with the same workload the device will be tested with under a heavy load of 16 threads with an outstanding queue of 16 per thread, and then tested in set intervals in multiple thread/queue depth profiles to show performance under light and heavy usage.
Preconditioning and Primary Steady-State Tests:
- Throughput (Read+Write IOPS Aggregate)
- Average Latency (Read+Write Latency Averaged Together)
- Max Latency (Peak Read or Write Latency)
- Latency Standard Deviation (Read+Write Standard Deviation Averaged Together)
Our Enterprise Synthetic Workload Analysis includes four profiles based on real-world tasks. These profiles have been developed to make it easier to compare to our past benchmarks as well as widely-published values such as max 4K read and write speed and 8K 70/30, which is commonly used for enterprise drives. We also included two legacy mixed workloads, the traditional File Server and Webserver, each offering a wide mix of transfer sizes.
- 4K
- 100% Read or 100% Write
- 100% 4K
- 8K 70/30
- 70% Read, 30% Write
- 100% 8K
- File Server
- 80% Read, 20% Write
- 10% 512b, 5% 1k, 5% 2k, 60% 4k, 2% 8k, 4% 16k, 4% 32k, 10% 64k
- Webserver
- 100% Read
- 22% 512b, 15% 1k, 8% 2k, 23% 4k, 15% 8k, 2% 16k, 6% 32k, 7% 64k, 1% 128k, 1% 512k
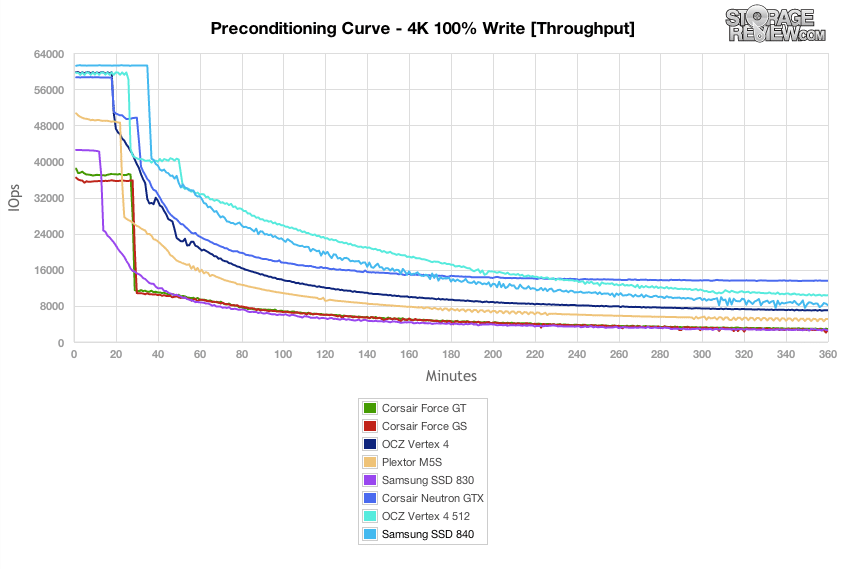
The SSD 840 Pro is able to hold on to second place during the throughput preconditioning curve for the 4K 100% write test until approximately the third hour of the benchmark, at which time its performance reaches about average for the comparables.
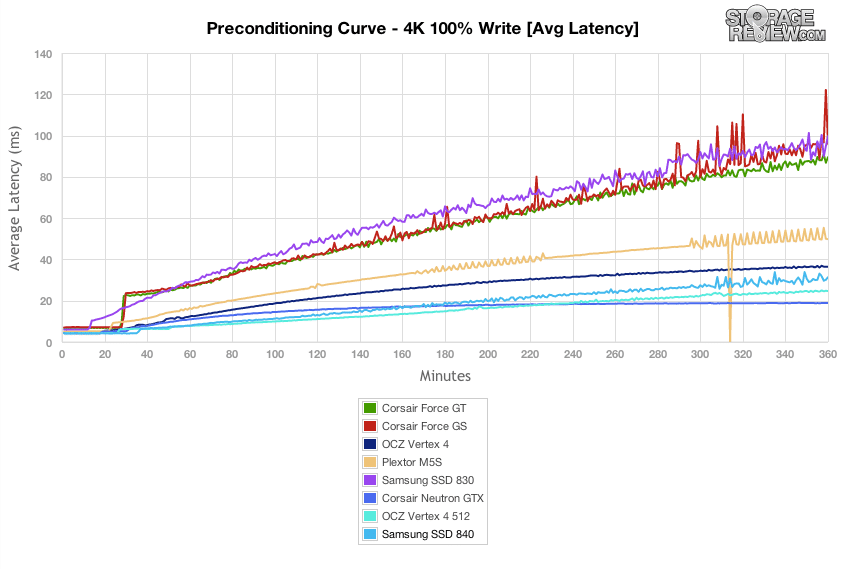
The SSD 840 was able to maintain a consistently low latency score throughout the preconditioning for the 4K 100% write test, completing the benchmark behind only the OCZ Vertex 4.
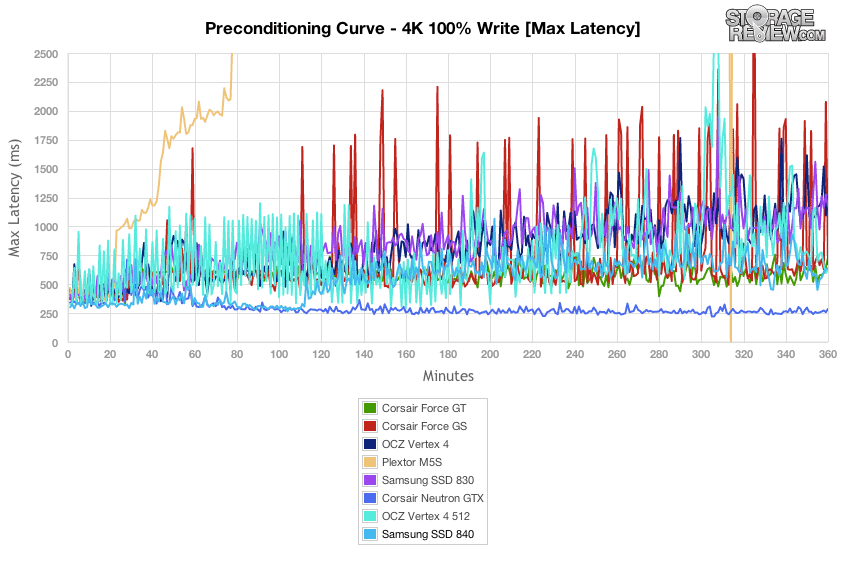
Maximum latency during the preconditioning curve for the 4K 100% write test was not a strong point of the SSD 840 Pro, but it does manage to remain competitive with the comparables. Note the Plextor M5S running off the charts for much of the test.
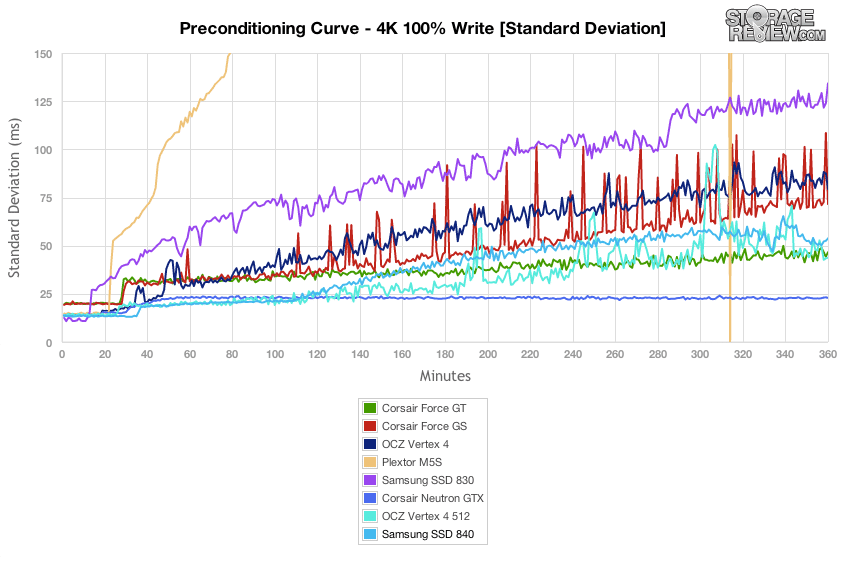
The standard deviation chart makes it a little easier to see how performance changed during the course of the preconditioning by filtering out one-time occurrences from an ongoing trend in performance. The SSD 840 Pro is a strong contender but is not able to consistently beat the OCZ Vertex 4 or the Corsair Force GT.
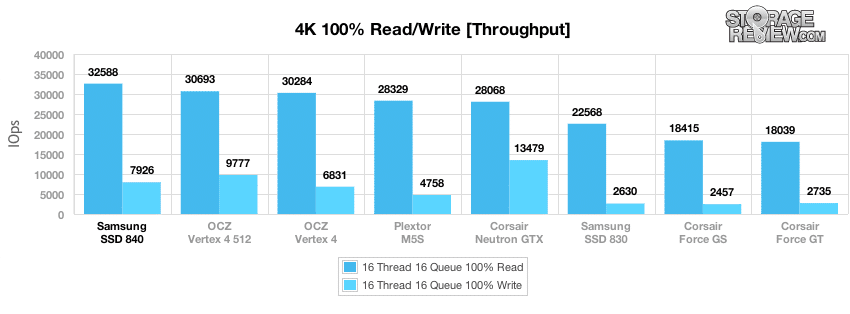
After the preconditioning process, we used a longer sample interval to measure the final 4K read and write performance of each SSD. The SSD 840 Pro still decisively leads in read operations with 32,588 IOPS. The SSD 840 Pro achieves third-highest IOPS in write operations, with 7,926.
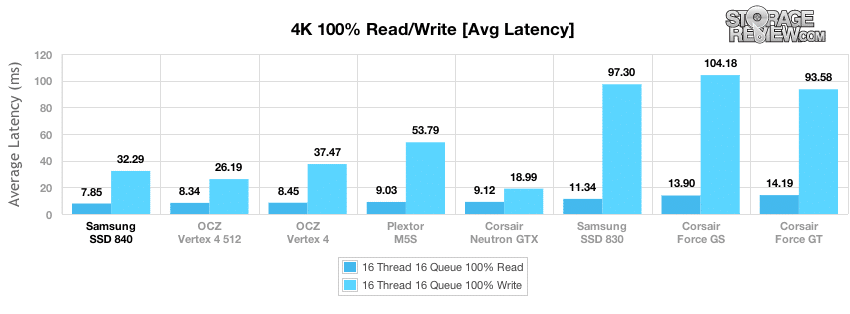
Likewise, the SSD 840 Pro achieves the lowest average read latency of the comparables in the 4K test and fourth-lowest latency in the write test.
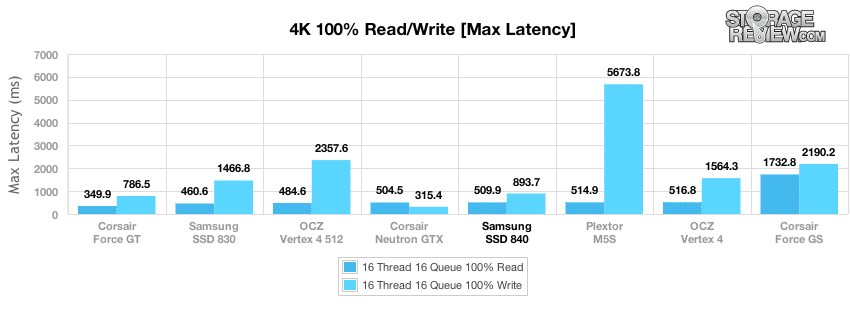
Maximum 4K latency is not a strength of the SSD 840 Pro, but neither is it a weakness, especially plotted next to the Plextor M5S.
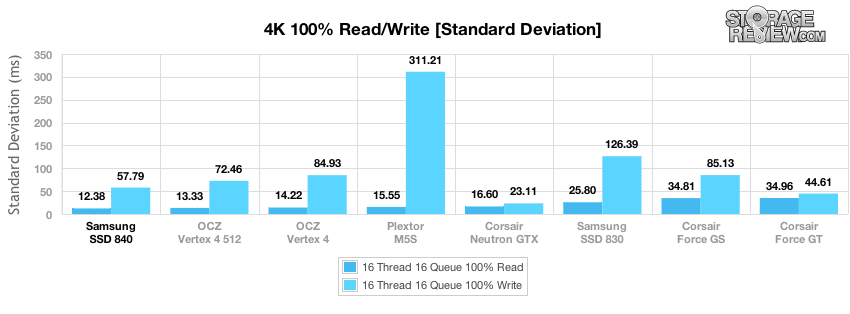
The chart of standard deviation places the SSD 840 in the top third of the comparables in the 4K benchmark. The difference between the SSD 840 Pro and the SSD 830 is particularly evident on a bar chart.
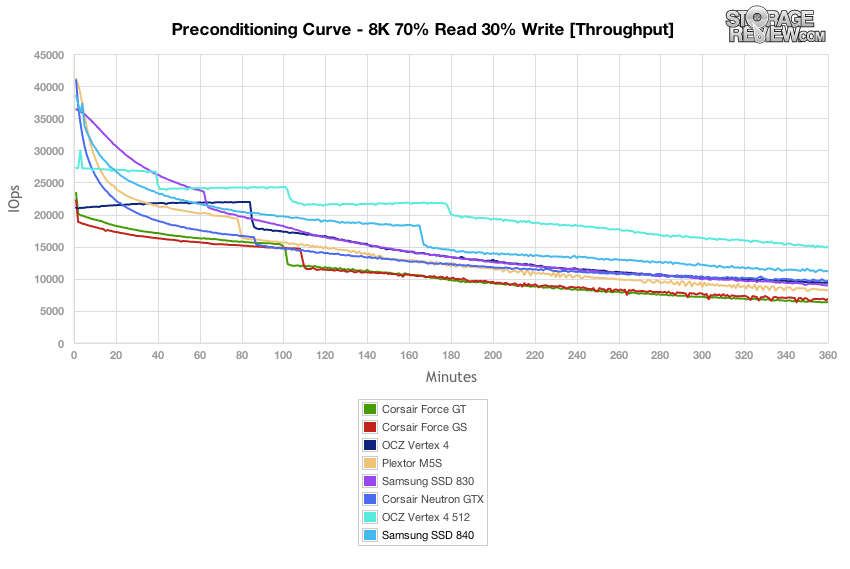
The 8K 70/30 test is a more realistic workload with 16 threads and 16 queue over a 6 hour period. The SSD 840 Pro was able to beat out all comparables on IOPS except for the OCZ Vertex 4.
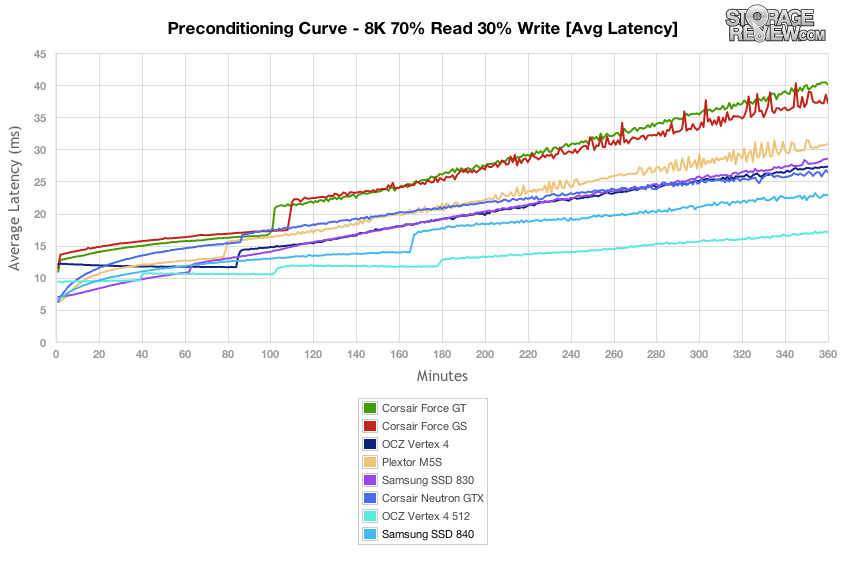
The SSD 840 Pro continues to perform well on average latency in the 8K 70/30 test, again finishing second only to the OCZ Vertex 4.
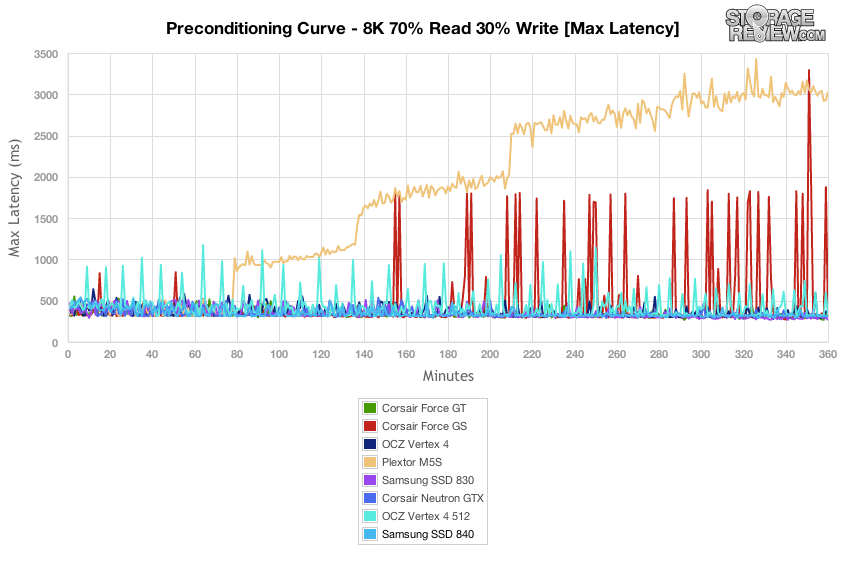
With both the Plextor M5S and the Corsair Force GS skewing the results of the max latency test upwards it is hard to track the SSD 840 Pro on the 8K 70/30 maximum latency chart. The SSD 840 Pro wound up with a maximum latency of 324ms at the end of the test.
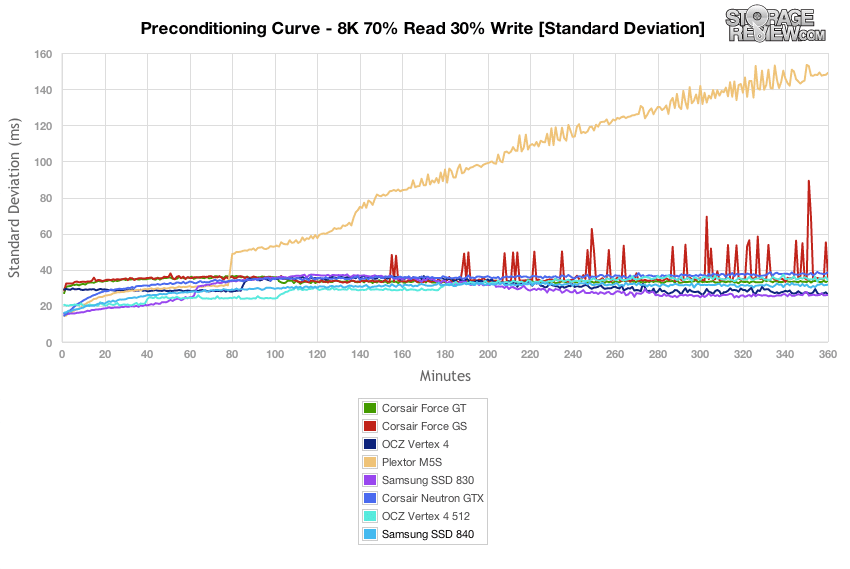
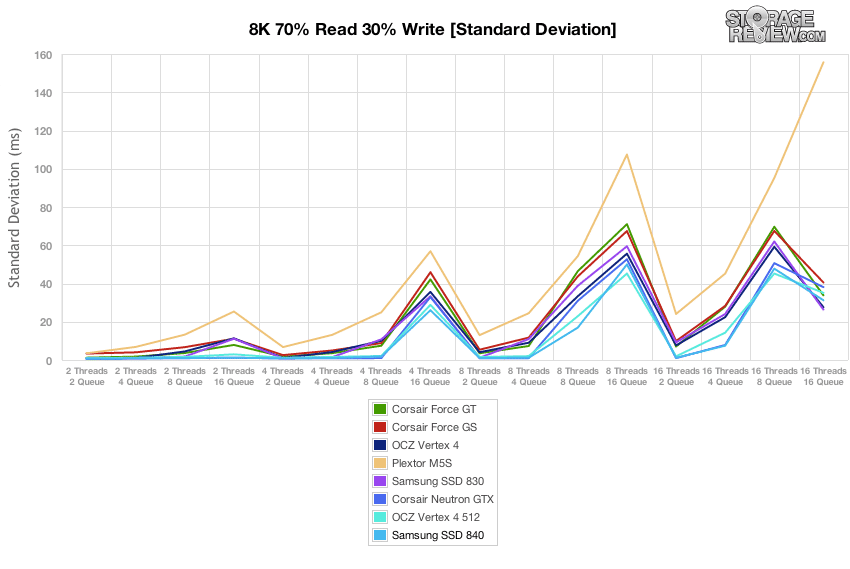
The 8K 70/30 standard deviation chart illustrates the SSD 840 Pro’s third place performance, notably falling below its predecessor the SSD 830.
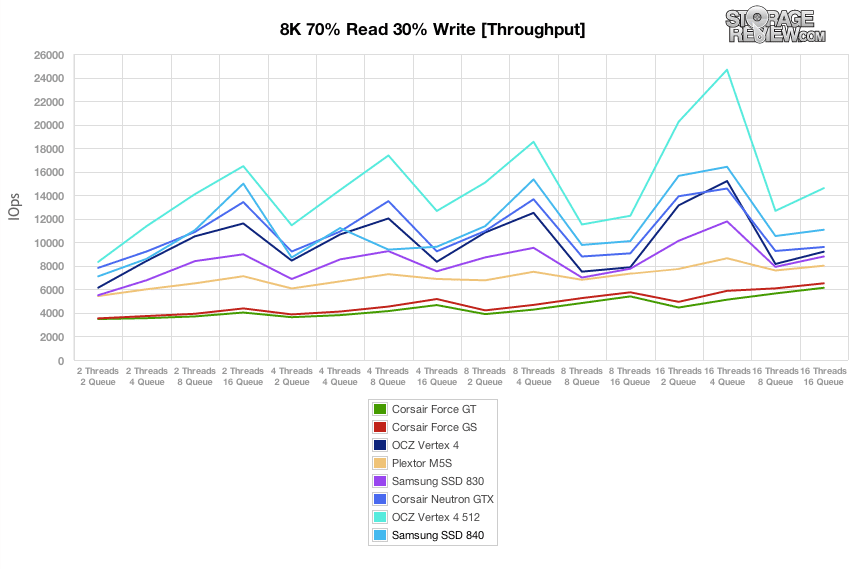
With the 8K 70/30 preconditioning complete, our workloads will compare the performance of our drives across a range of thread and queue combinations. Workload intensity will scale from 2 threads and 2 queue up to 16 threads and a 16 queue.
In terms of throughput, the SSD 840 Pro comes out generally second to the OCZ Vertex 4.
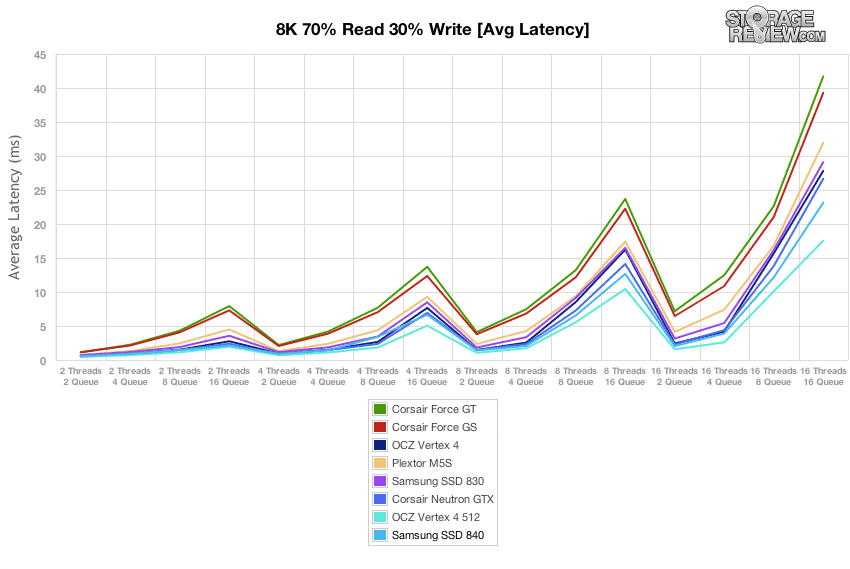
The SSD 840 Pro extends its second-place performance in the 8K 70/30 bench through the latency test, which again places the SSD 840 Pro just behind the OCZ Vertex 4.
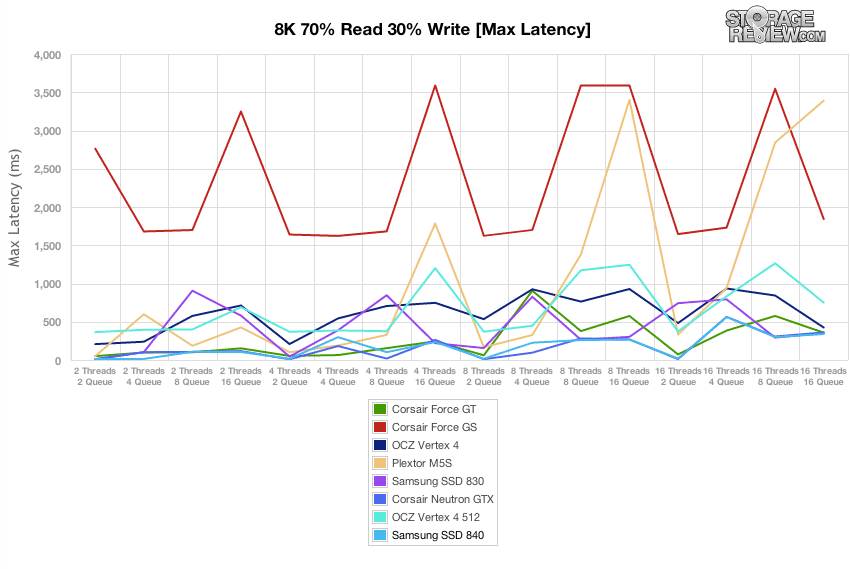
The SSD 840 Pro was a strong performer, claiming the lowest maximum latency results at several points during the 8K 70/30 benchmark.
Charted by standard deviation, we can see that the SSD 840 Pro’s performance in the maximum latency was not an anomaly. It is again the best-performing drive at several points in the benchmark.
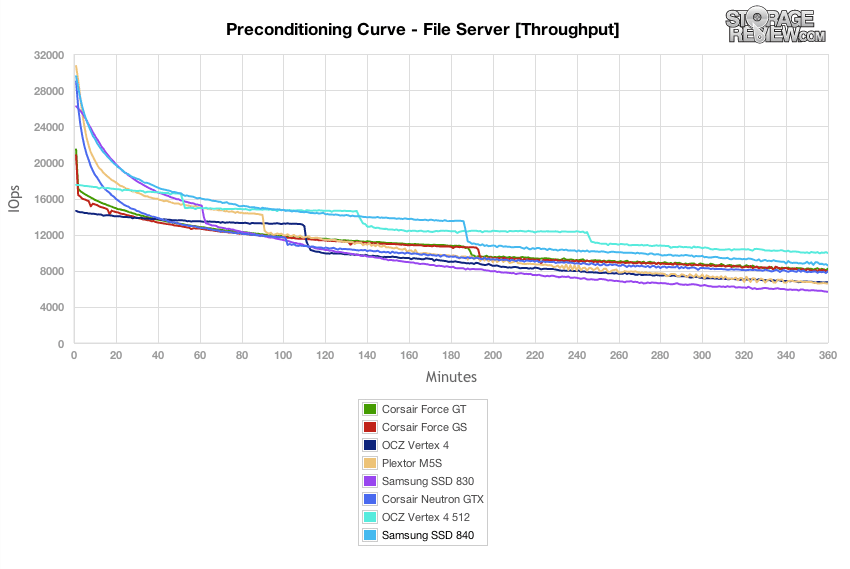
The file server profile uses a variety of transfer sizes from 512B to 64K in order to model the types of workload an SSD might be exposed to in the data center. The SSD 840 Pro performs well throughout the preconditioning curve, winding up at second-highest on IOPS.
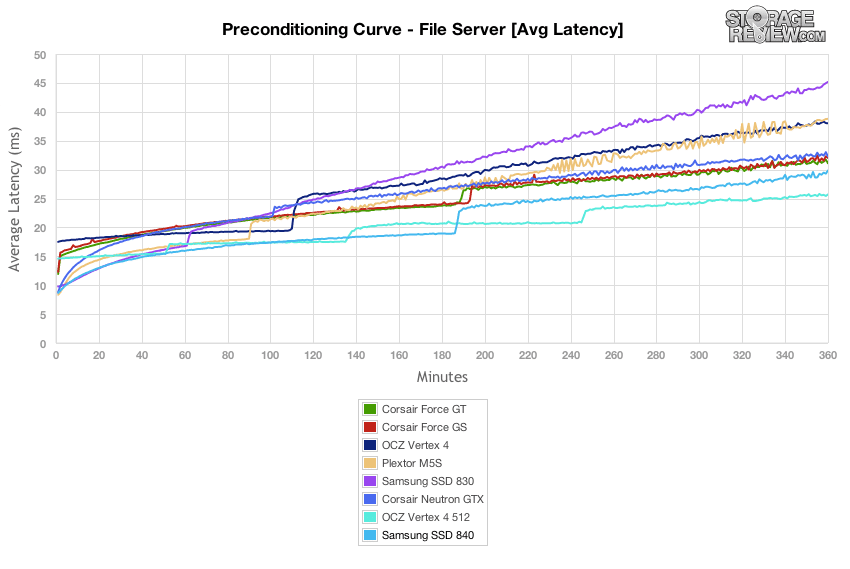
The SSD 840 Pro performs well for average latency throughout the preconditioning curve for the file server benchmark, again second to the OCZ Vertex 4.
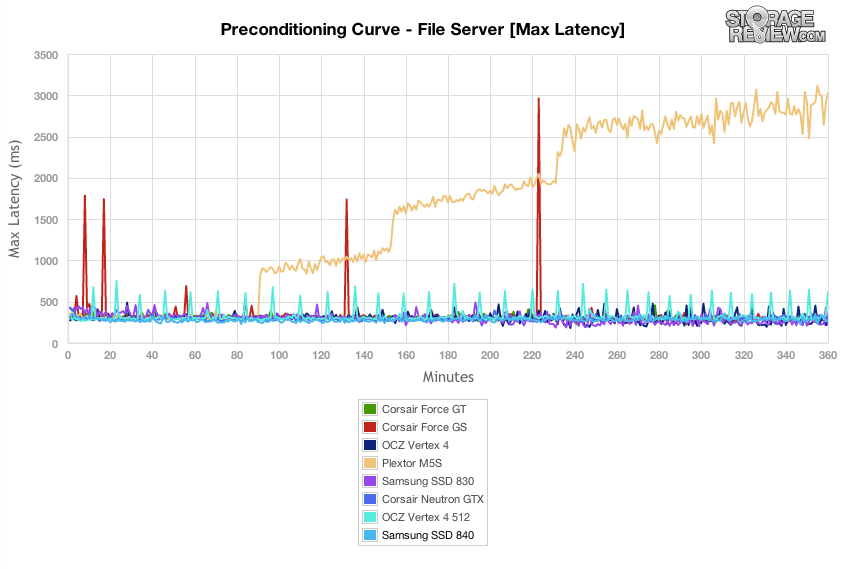
The SSD 840 Pro suffers some spikes in maximum latency throughout the preconditioning curve, but they are much less noteworthy than on some of the other comparables.
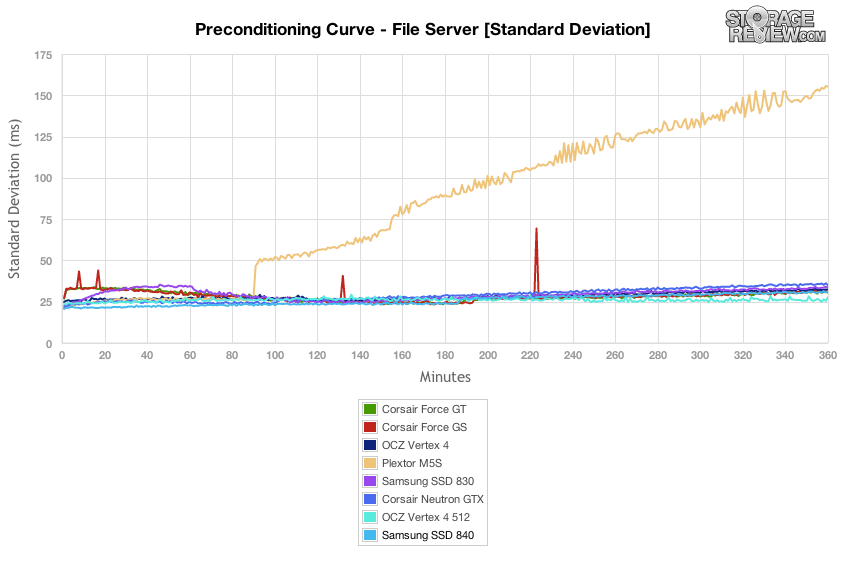
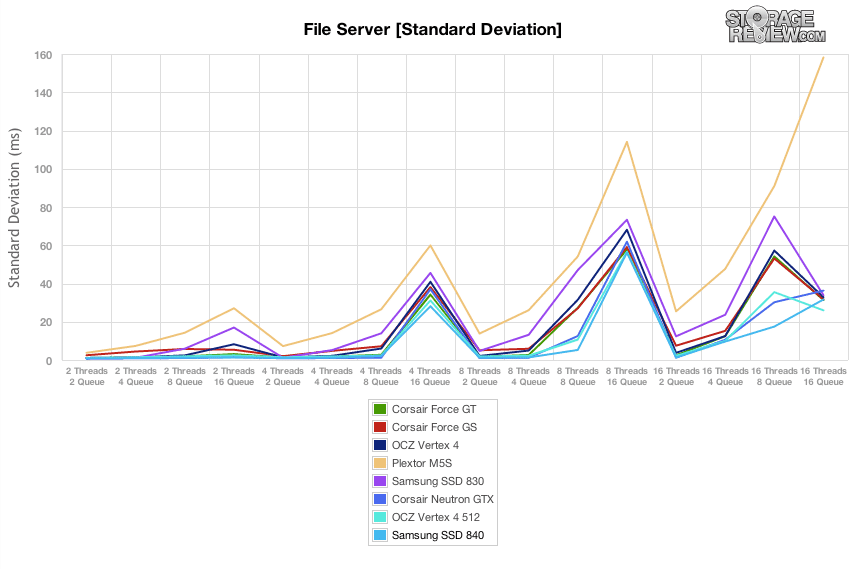
With latency charted by standard deviation, the SSD 840 Pro winds up with a respectable 31ms latency that keeps it near the front of the competition.
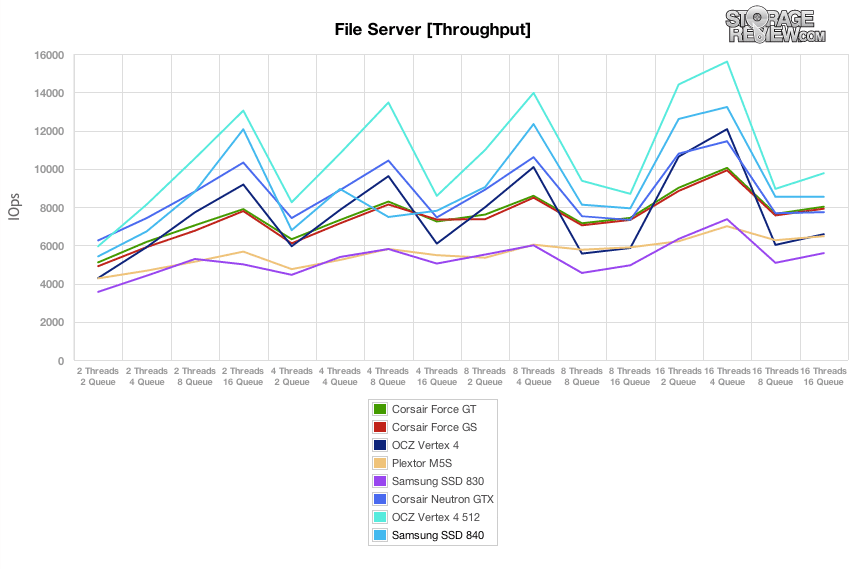
The SSD 840 Pro generally maintained second-highest throughput during the file server benchmark, but suffered from poor performance throughout the four-thread tests.
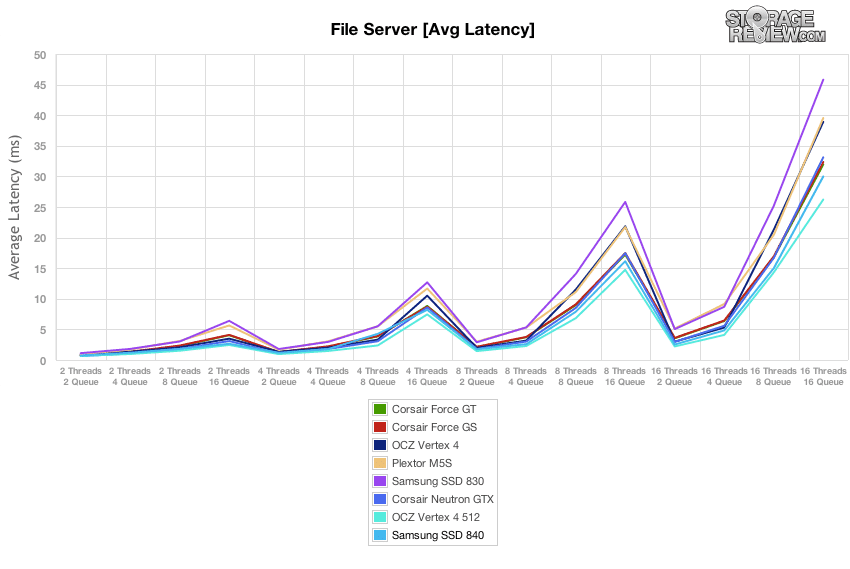
Accepting a small anomaly during the underachieving four-thread results, the SSD 840 Pro maintains a consistently low latency throughout the file server testing.
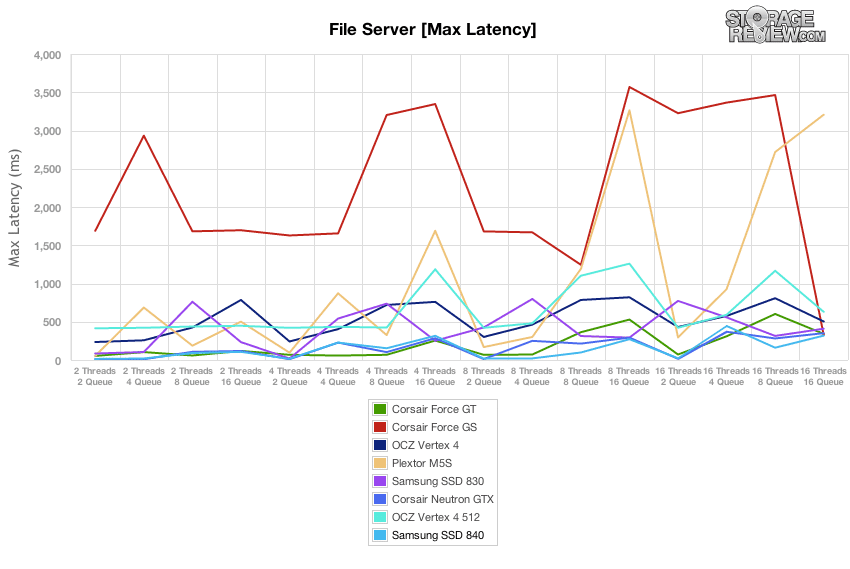
Low maximum latencies are looking to be one of the SSD 840 Pro’s strengths in real-world benchmarks, again on display as it often leads in our file server maximum latency results.
Plotted by standard deviation, the SSD 840 Pro comes out with the best latencies for many workloads in the file server benchmark.
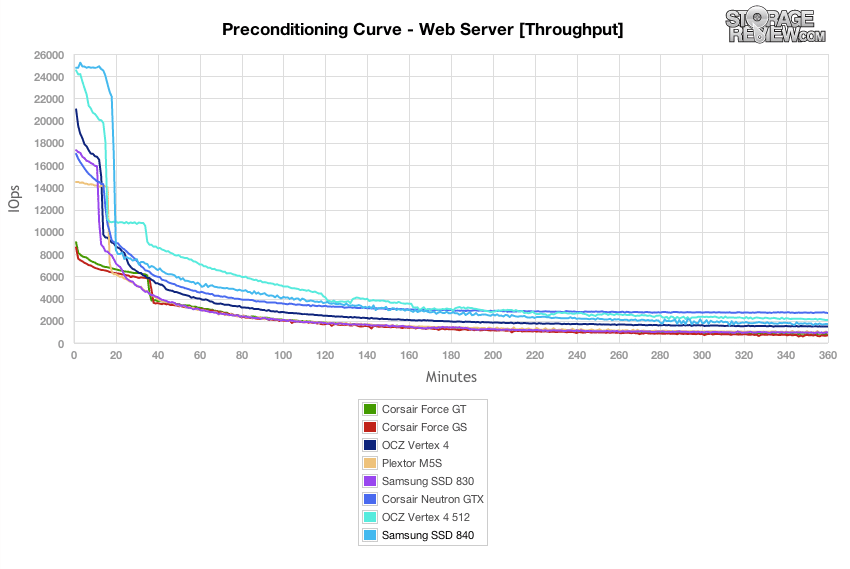
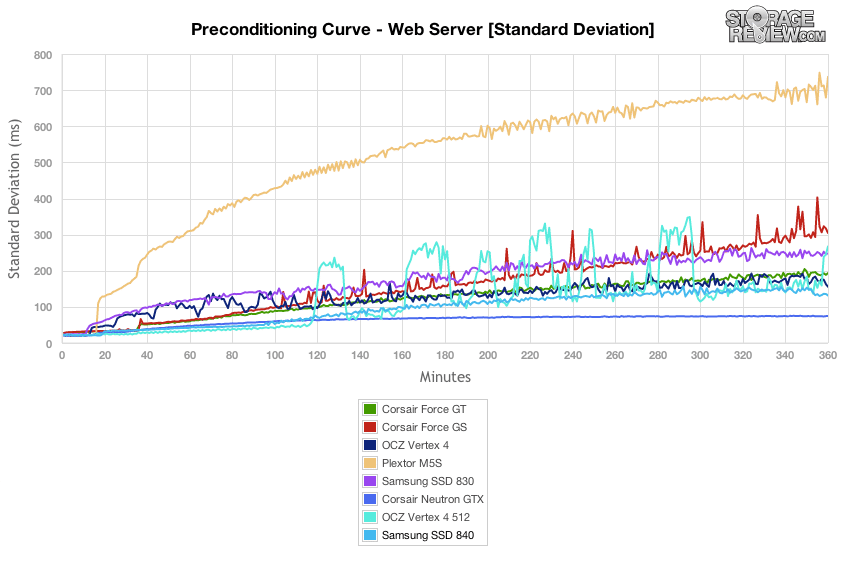
The preconditioning process for the web server profile is designed to best complement the 100% read activity of the benchmark. Therefore, we inverted the preconditioning pattern to be 100% write. The preconditioning charts are going to be a little more dramatic than the workload charts for the same reason.
During preconditioning for the web server test, the SSD 840 Pro declines from second place to the middle of the pack on IOPS.
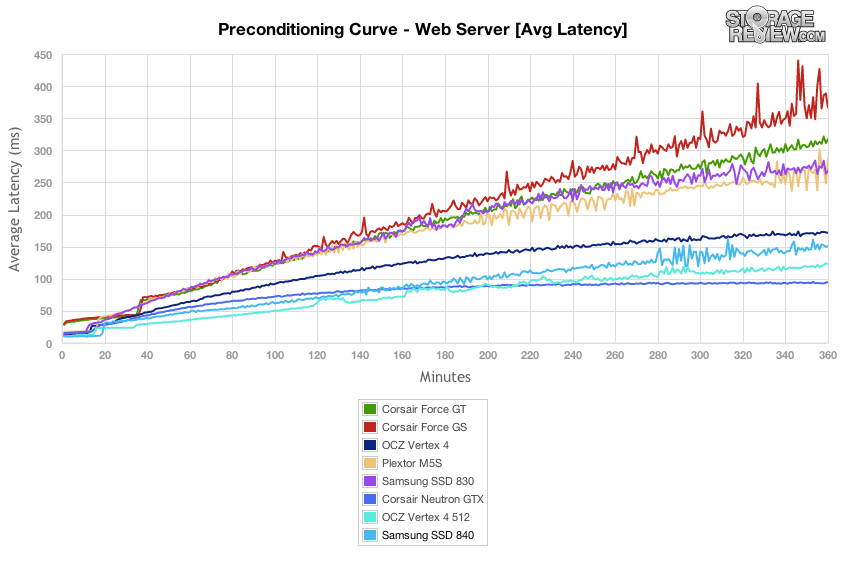
Within the first three hours of preconditioning, it becomes clear that the SSD 840 Pro will settle into third place on average latency for the web server profile.
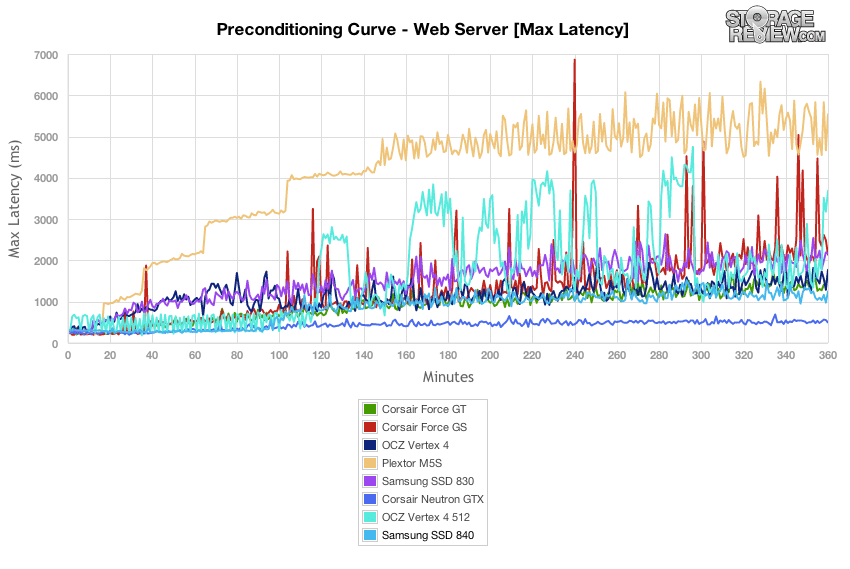
With maximum latency charted across the comparables, the SSD 840 Pro can be seen moving at the lower end of the cluster of scores but without the violent variations that characterize some of the lower-performing comparable drives.
Plotted as standard deviations, the SSD 840 Pro more clearly maintains a second-place position for latency during most of the preconditioning curb for the web server benchmark.
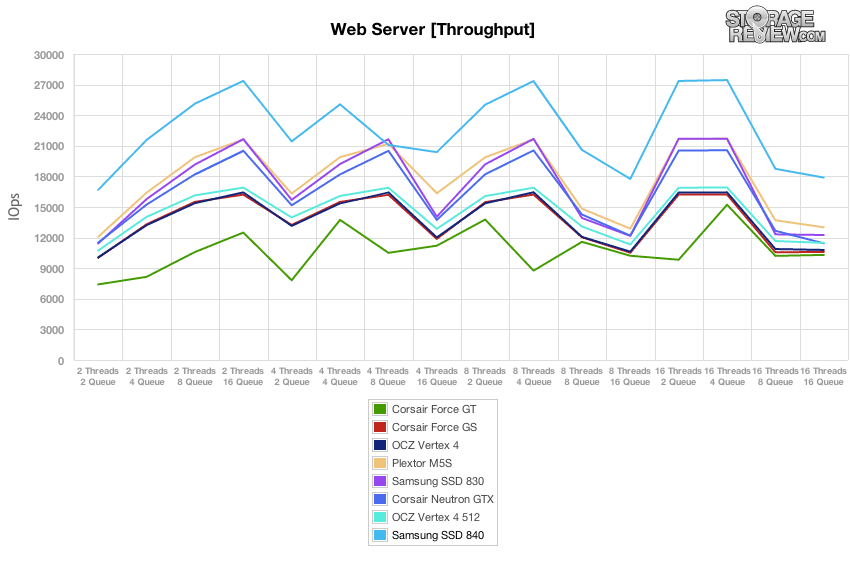
Having preconditioned the drives with high-intensity write operations, the actual web server testing will shift back to 100% read operations. Except for a stretch of lower performance through its series of four-thread workloads, the SSD 840 Pro maintains a strong lead throughout the benchmark.
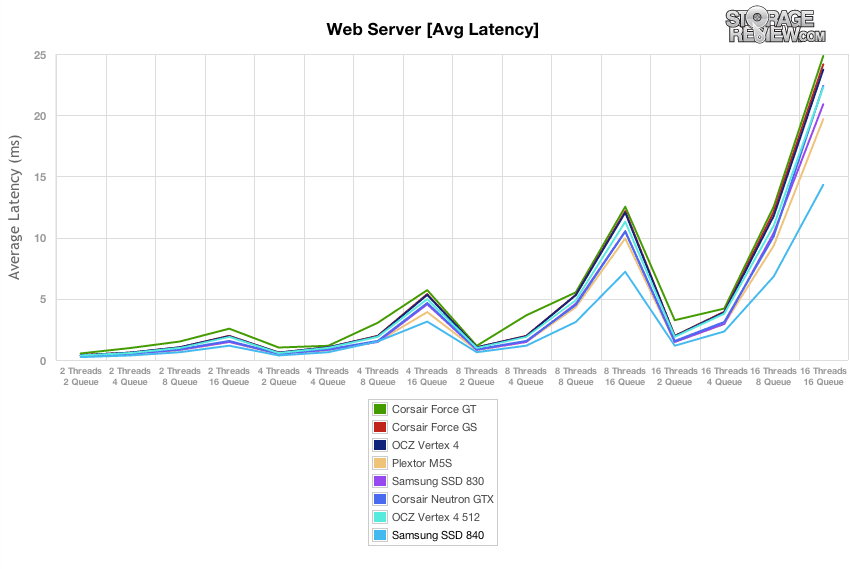
With average latency as the lens, the SSD 840 Pro is a strong performer on the web server benchmark with a decisive lead across most workloads.
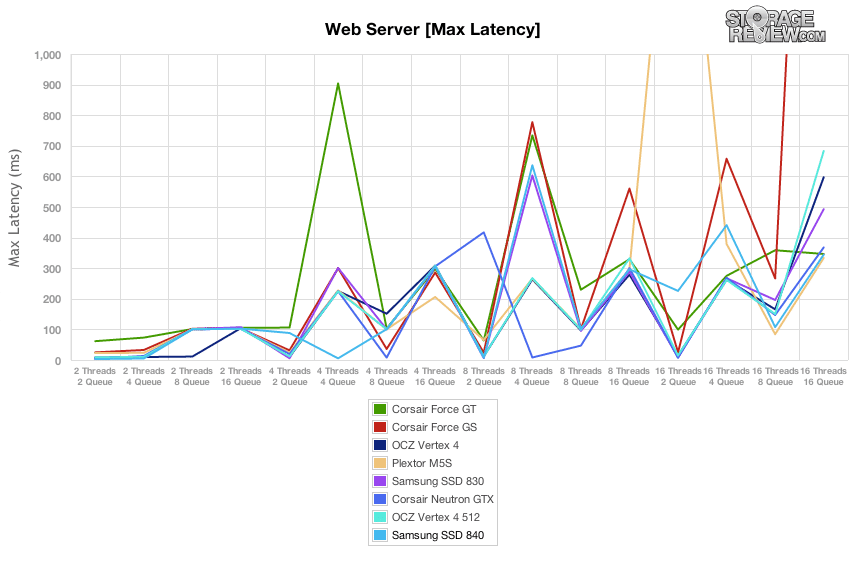
The SSD 840 Pro does not offer the best maximum latency results in the web server tests, but it is able to its maximums limited to a smaller range across the variations in workload.
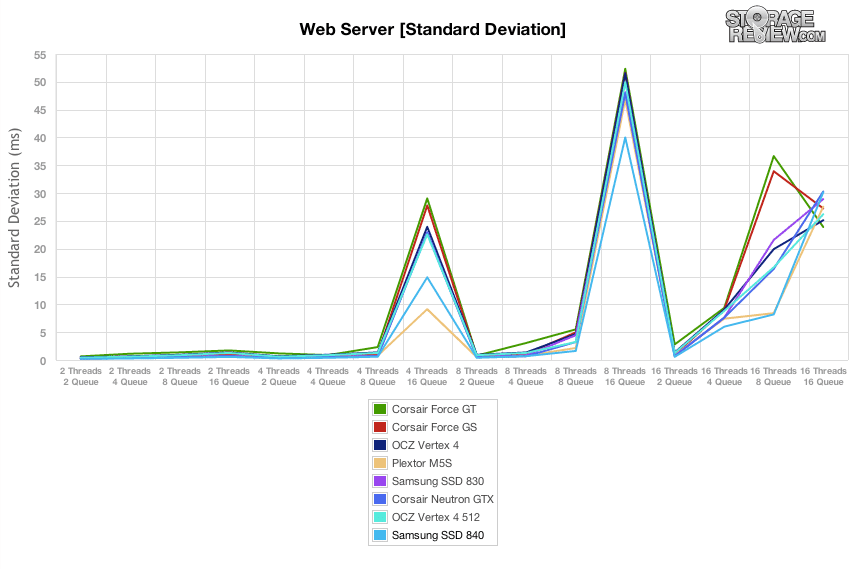
Plotted as a standard deviation, the SSD 840 Pro does well in latency during the web server benchmark up until the highest loads, when the results from the slate of comparables begin to converge in the middle.
Power Consumption
As SSDs spend much of their time in the idle state, low idle power consumption is a key factor in overall SSD power management. Samsung’s SSD 830 handled power management very well, but Samsung’s published power benchmarks for the 840 Pro, 0.068 watts in active operation and 0.042 watts in idle, were shockingly low. When we asked Samsung how they achieved such mind-bending numbers, they were unable to answer, which makes us think they were chosen to meet the needs of the press release, rather than reflecting real-world values.
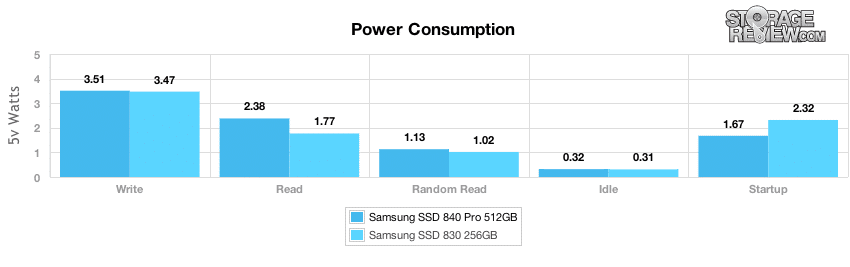
Compared to the 256GB SSD 830, the 512GB SSD 840 Pro actually edges up its power consumption in most categories. It’s hard to say how Samsung calculated the power draw claims for this drive, but it does hold idle consumption near that of the SSD 830 and decreases power consumption by more than 0.6 watts at startup compared to the SSD 830.
Update 9/24/12 – Samsung has responded as to how they got their extremely low power consumption numbers. “The results presented are based on MobileMark 2007 and require DIPM to be enabled. This test is geared towards laptops. If the test was on a desktop machine, DIPM is not enabled by default, and power consumption results will be significantly higher.”
Software
Samsung includes the latest version of its drive management software, Magician 4.0. Magician provides disk scan features, error reporting and diagnostics, and provides an interface for firmware updates.
Magician 4.0 also provides user-configurable over-provisioning for the SSD 840 Pro, allowing users to reserve between 7 and 24 percent of the total capacity for creating pre-erased, ready-to-use memory blocks. Over-provisioning allows SSD 840 users to select a preference for performance or maximum capacity on an individual drive basis. It’s worth noting that Magician is the most robust SSD utility available and certainly adds value for owners of Samsung drives.
Conclusion
In the past, Samsung’s integrated SSD platform has seemed primarily like a strength. By designing and manufacturing all of the components in the SSD 840 Pro, Samsung is in a good position to get the most performance and reliability from its drives. It also doesn’t hurt that Samsung’s proprietary SSD controller is around to keep incumbent controller developers from relying on their market share to avoid innovation.
With the release of the SSD 840 and the SSD 840 Pro, we can see at least one downside to this situation. While we have been able to review an SSD 840 Pro unit in the lab, the amount of available information on the drive has been small and its errors and omissions suggest that the final material had not been completely vetted by Samsung engineers. With the standard SSD 840, there has simply been no hard information to work with, which considering its first-to-market SSD with TLC-NAND, seems very strange.
That said, our own testing of the SSD 840 Pro reveals it to be a capable step forward from the successful SSD 830. While the SSD 840 Pro has a few weak points which may limit its appeal for certain high-write applications, the SSD 840 Pro maintained average performance even in benchmarks when it did not finish in the first three positions. And even though real world power consumption in a desktop is extremely higher than Samsung’s DIPM-enabled notebook rates, the 840 Pro compared well with the prior generation 830, especially at startup.
Pros
- An integrated all-Samsung platform
- Competitive performance in many read-heavy tasks
- Consistent latencies across a variety of workloads
- Robust Magician 4.0 drive management utility
Cons
- Lower enterprise performance in mixed workload scenarios
Bottom Line
Samsung is the sole manufacturer focusing on in-house design and manufacturing of the entire SSD platform. The good news is that the SSD 840 Pro provides more than just an alternative to Marvell- and SandForce-based SSDs – it brings a lot to the table of its own for upgrades, enthusiasts, and high-read enterprise storage applications.


 Amazon