

The HyperX SSD is Kingston’s latest and greatest flagship SSD. Offering speeds up to 550MB/s read and 510MB/s write speeds, this enthusiast-level drive features a SandForce SF-2281 processor and is available in 120GB and 240GB capacities. Packed with 25nm synchronous NAND this drive is claimed to top out at 90,000 4K read IOPS and 60,000 write IOPS. making it optimal for high-performance gaming systems and workstations alike.
With a wide range of SSDs in Kingston’s lineup, models cater to budget, business, and enthusiasts. Kingston’s HyperX is positioned right at the top of the Kingston portfolio, with their rest of their enthusiast-grade HyperX suite of products. Supporting the SATA 6Gb/s standard, this drive is poised to saturate the connection with peak transfer speeds above 500MB/s sequential, but can still offer long-term endurance if users customize the drive during initial setup and increase its over-provisioning.
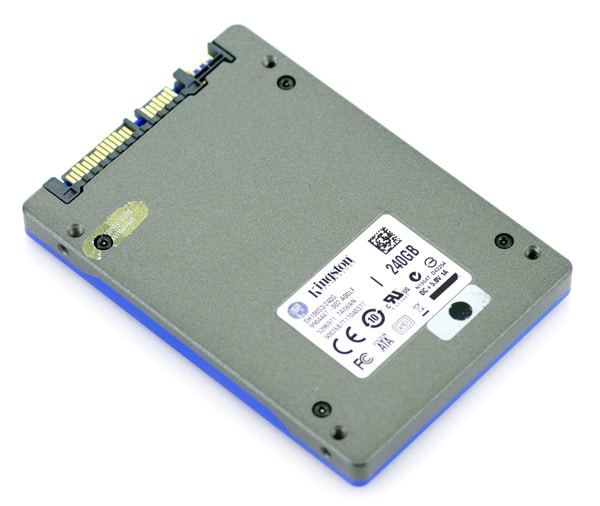
The HyperX SSD is available in simplified 120GB (SH100S3/120G) and 240GB (SH100S3/240G) capacities, and are currently priced at $249 and $469 respectively.
Kingston HyperX SSD Specs:
- 2.5-inch form factor
- SandForce SF-2281 processor
- SATA III (6.0Gbps) interface
- 25nm Intel synchronous NAND memory
- Max. sequential read: 555MB/s
- Max. sequential write: 510MB/s
- Max. sustained random 4k read/write: 40,000/60,000 IOPS
- Max. random 4k read/write: 95,000/60,000 IOPS
- Power consumption:
- Idle: 0.455W
- Read: 1.5W
- Write: 2.05W
- Dimensions: 69.85 x 100 x 9.5 mm
- Three-year warranty
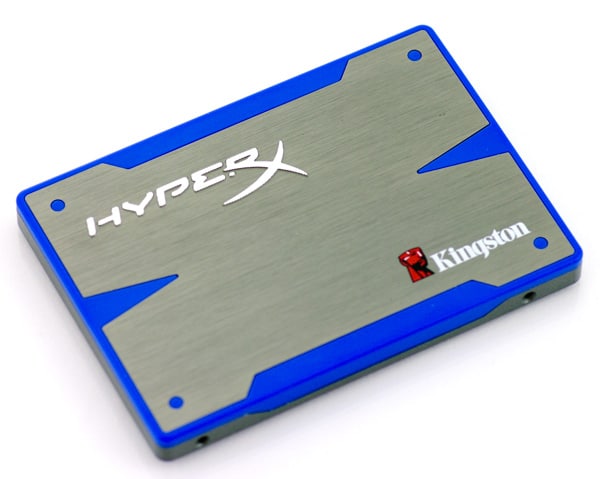
Aesthetics
The first thing you notice when you pickup the Kingston HyperX SSD is how hefty it is compared to other SSDs. The case Kingston used for this particular SSD is very rugged and durable, with a metal bottom and plastic/metal top cover. The color choice also quite aggressive for an SSD design; the gunmetal grey and blue combo looks stunning.
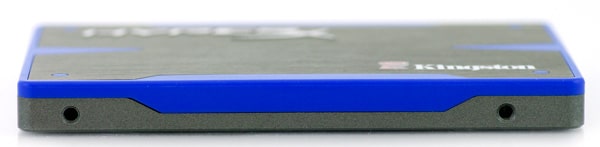
The side profile of the drive shows the case layers as well as the screw holes for a drive tray.
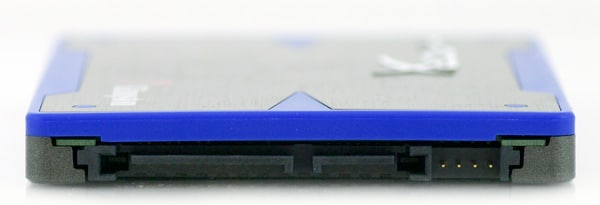
The front of the drive includes the standard SATA and power interface, as well as four service pins. During normal use these service pins have no function for the end user.
Disassembly
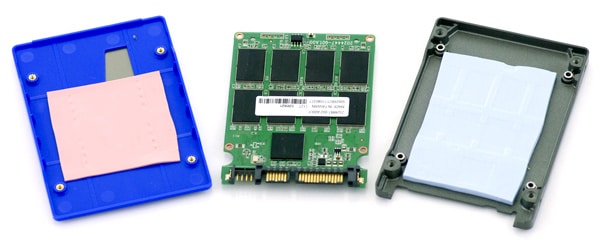
Before we dive into the tear-down of the Kingston HyperX SSD, buyers need to be warned that opening up this particular model voids the warranty. A sticker is present that covers one of the screws that must be broken to take the case apart. With that out of the way, getting the case open may present its own challenges for some users.
The screws are security torx, although they were easily defeated using a small flat-head screwdriver wedged into the top of the screw head. With the case apart, you can see the thick thermal pads Kingston uses to draw heat off of the controller and NAND pieces to help with long term stability. This level of heat transfer is on the high-side of the industry standard.
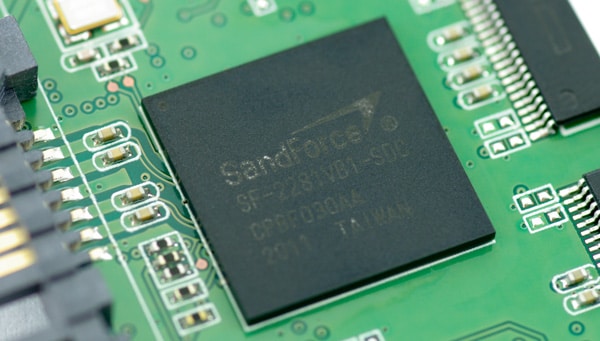
The controller found in the Kingston HyperX SSD is a SandForce SF-2281 model, present in many of the current generation high-performance SSDs.
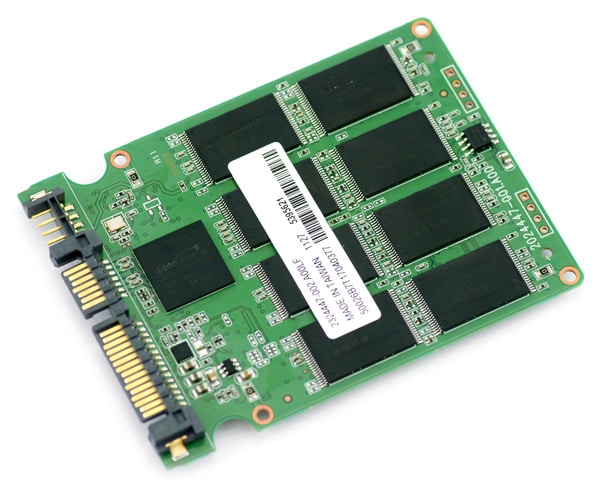
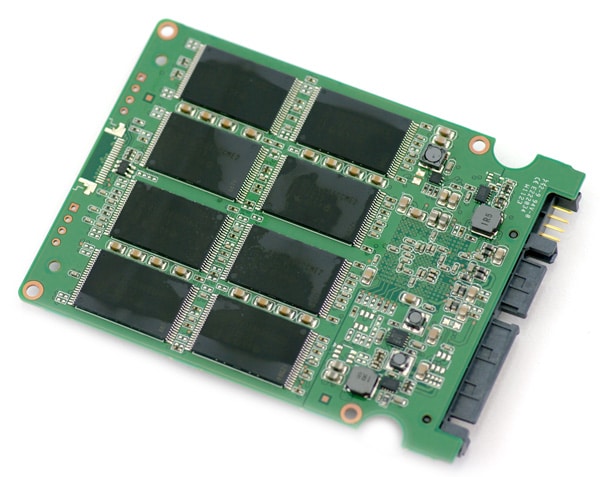
The 240GB HyperX SSD uses a 16-piece NAND configuration, made up of 16GB synchronous Intel NAND, spread out evenly over both sides of the circuit board.
Benchmarks
Our first round of benchmarks focuses on synthetic benchmarks; this is where we’ll put Kingston’s 555MB/s read and 510MB/s write claims to the test. Synthetic benchmarks will highlight the strengths and weaknesses of the drive but not necessarily reflect real-world performance (we have a whole section dedicated to that later on in the review).
The HyperX performs well in this benchmark with 500MB/s read and 462MB/s write; the numbers aren’t quite as high as Kingston claims however we’re dealing with incompressible data; SandForce controllers do best with compressible data.
This benchmark uses the same data size except randomly placed. The performance is almost the same at 498MB/s read and 467MB/s write. It has no trouble keeping up with its competitors.
![]()
![]()
In this benchmark we switch to a much smaller file size, 4K. Performance is lower as a result but the HyperX still doesn’t have any trouble keeping up with the group leaders at 29MB/s read and 80MB/s write.
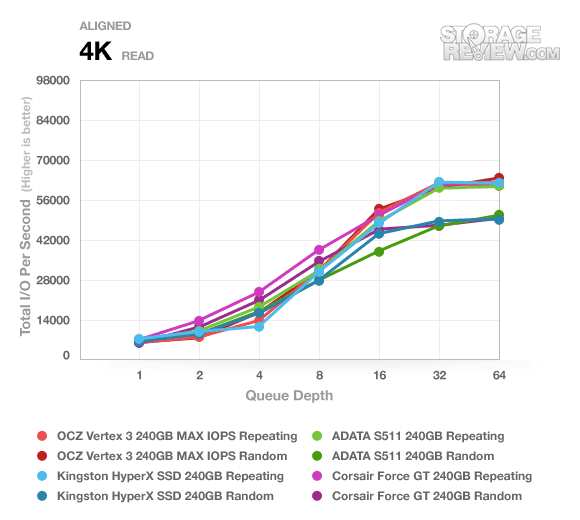
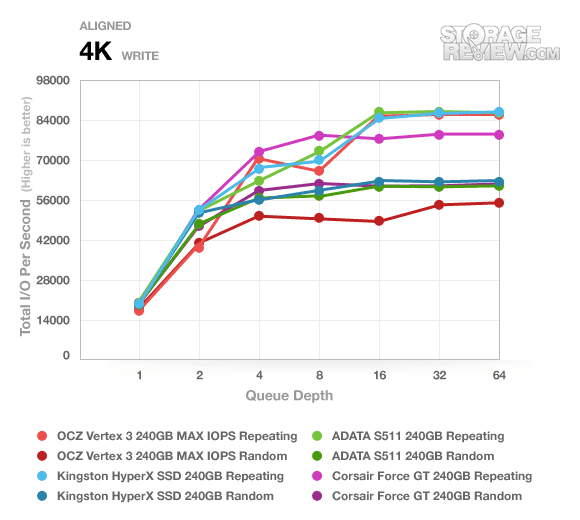
This test uses a queue depth of 64. The HyperX does particularly well in the write benchmark and matches competitors in the read benchmark. So far we have not seen the HyperX exhibit any noticeable weaknesses on its own or next to competitors.
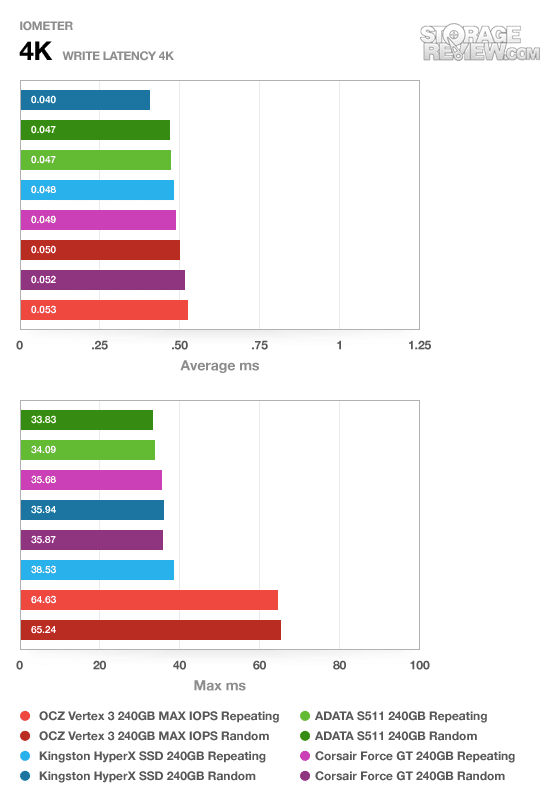
The HyperX continues to do well and matches or beats all of its competitors in write latency. Latency is a very good indicator of a drive’s responsiveness.
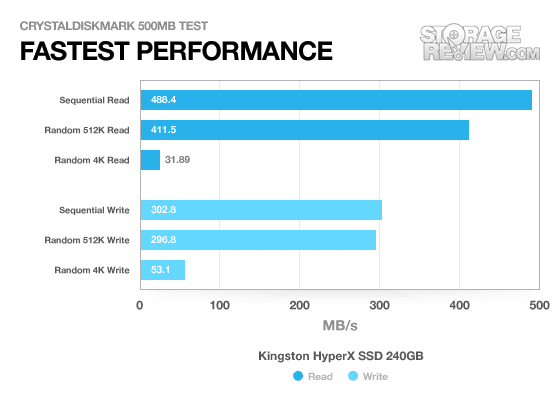
The HyperX puts up good numbers here with 488MB/s read and 302MB/s write, though they’re still not quite what Kingston claims.
The next four benchmarks are relevant for enterprise customers; the four profiles include database, file server, web server, and workstation. These benchmarks simulate reading and writing at the same time and have a queue depth ranging from 1 to 128.
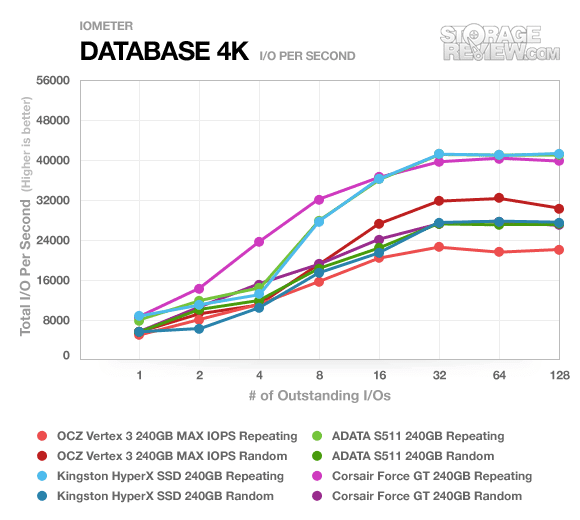
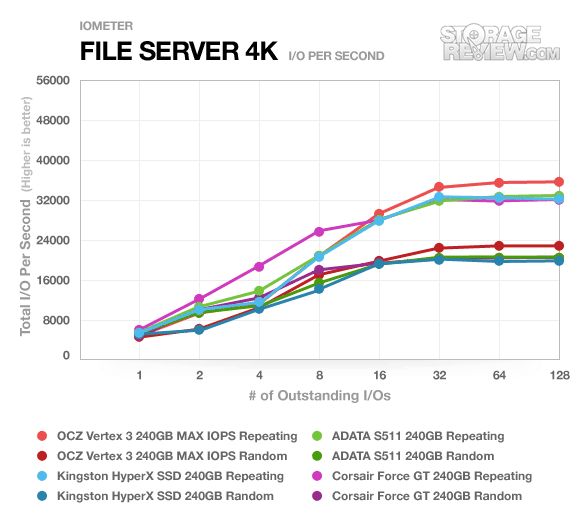
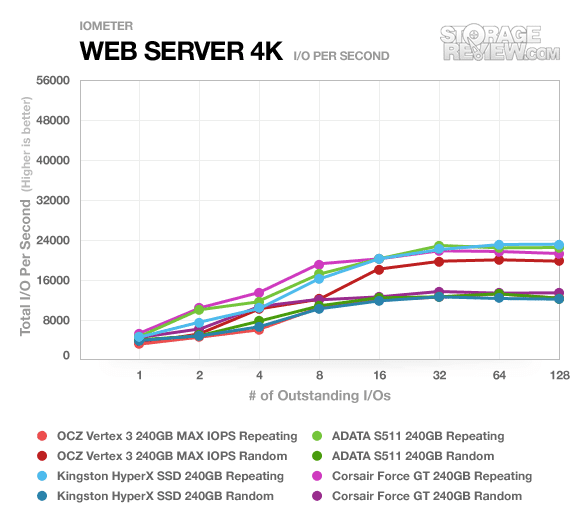
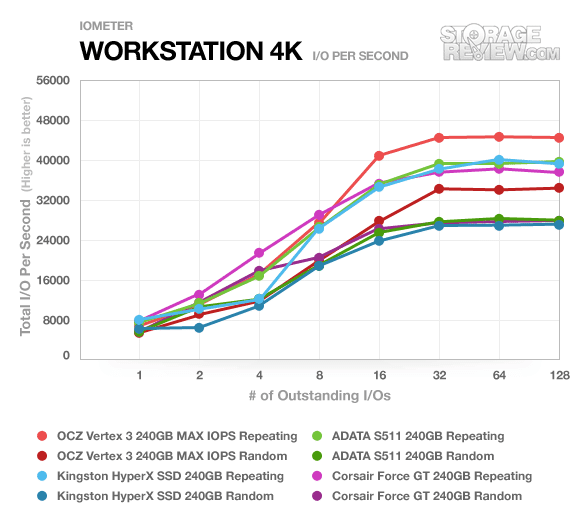
The HyperX does particularly well here, staying ahead of the A-DATA S511 and unsurprisingly matching the OCZ Vertex 3 and Corsair Force GT, which both use the same SandForce SF-2281 controller. Performance scaled as expected from left to right.
Real-World Benchmarks
Our primary goal at StorageReview is to demonstrate how well a particular storage device performs in the real world. We realize that translating the numbers from our synthetic benchmarks might prove difficult, even for enthusiast users. For this reason we have our own custom StorageMark 2010 trace benchmarks which make use of actual data and real-world applications such as Microsoft Office.
The first real-life test is our HTPC scenario. In this test we include: playing one 720P HD movie in Media Player Classic, one 480P SD movie playing in VLC, three movies downloading simultaneously through iTunes, and one 1080i HDTV stream being recorded through Windows Media Center over a 15 minute period. Higher IOps and MB/s rates with lower latency times are preferred. In this trace we recorded 2,986MB being written to the drive and 1,924MB being read.
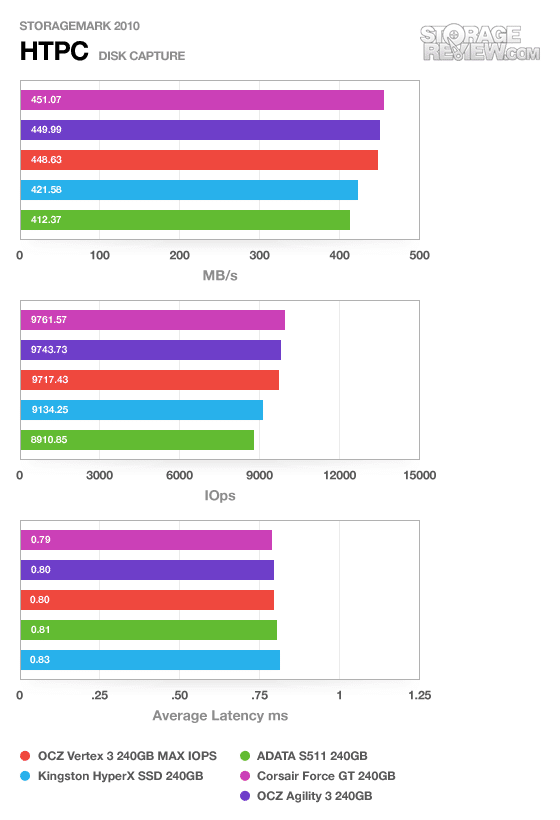
The HyperX is ever so slightly behind the OCZ and Corsair drives with 9,134 IOPS and a 421MB/s transfer rate. Its average latency is a tad high at 0.82ms.
Our second real-life test covers disk activity in a productivity scenario. For all intents and purposes this test shows drive performance under normal daily activity for most users. This test includes: a three hour period operating in an office productivity environment with 32-bit Vista running Outlook 2007 connected to an Exchange server, web browsing using Chrome and IE8, editing files within Office 2007, viewing PDFs in Adobe Reader, and an hour of local music playback with two hours of additional online music via Pandora. In this trace we recorded 4,830MB being written to the drive and 2,758MB being read.
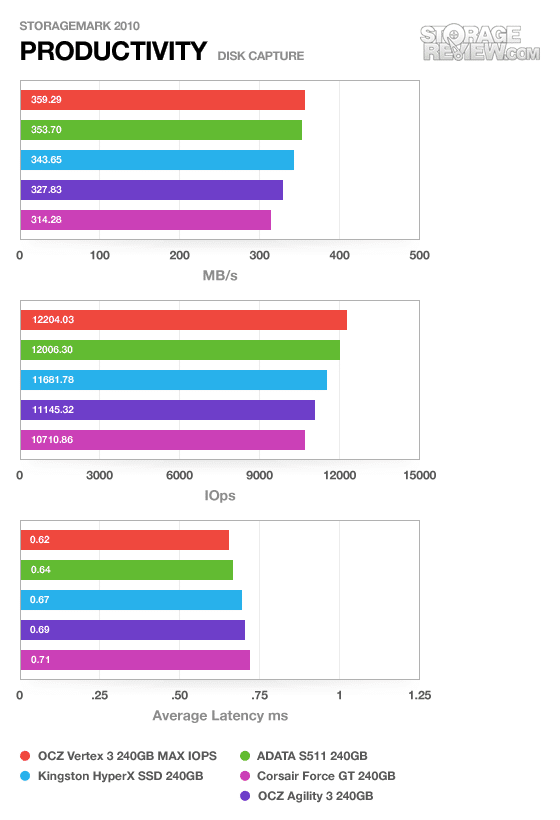
The productivity benchmark tells a similar story; the HyperX is not quite capable of catching its competitors. The difference is less than five percent, however; this is not going to be noticeable by the end user. The HyperX comes in at 11,681 IOPS and 344MB/s transfer rate.
Our third real-life test covers disk activity in a gaming environment. Unlike the HTPC or Productivity trace, this one relies heavily on the read performance of a drive. To give a simple breakdown of read/write percentages, the HTPC test is 64% write, 36% read, the Productivity test is 59% write and 41% read, while the gaming trace is 6% write and 94% read. The test consists of a Windows 7 Ultimate 64-bit system pre-configured with Steam, with Grand Theft Auto 4, Left 4 Dead 2, and Mass Effect 2 already downloaded and installed. The trace captures the heavy read activity of each game loading from the start, as well as textures as the game progresses. In this trace we recorded 426MB being written to the drive and 7,235MB being read.
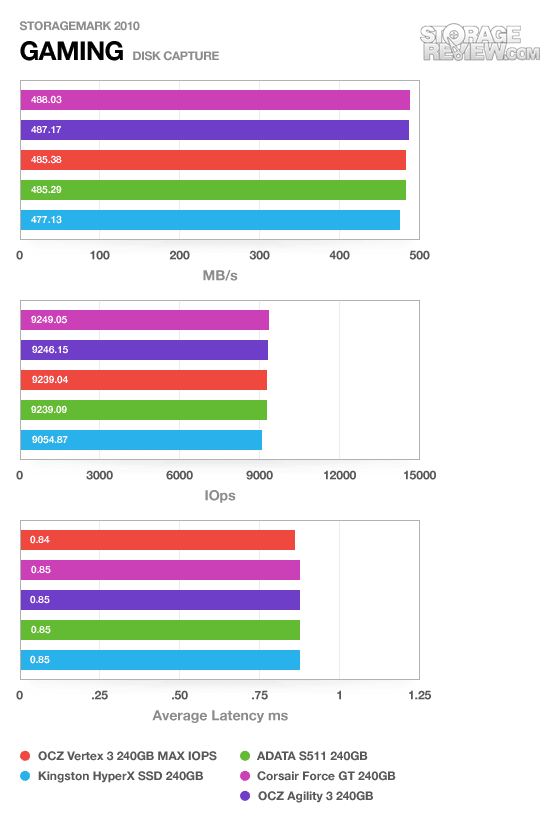
Once again we’re looking at almost the same scenario with the HyperX just behind the OCZ and Corsair drives. It produces 9,034 IOPS and a 477MB/s transfer rate.
Power Consumption
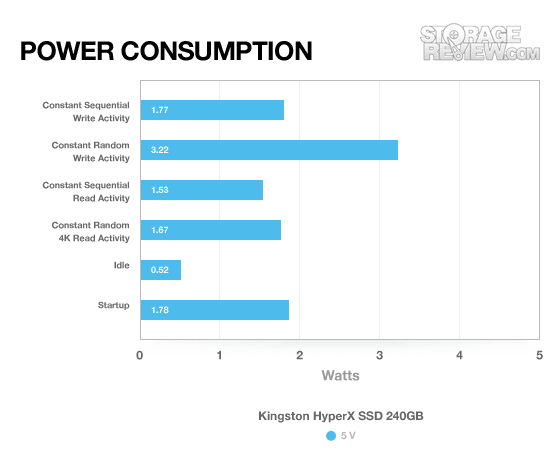
The idle power consumption is especially low at just 0.52W; this is just a tad higher than the 0.455W specified by Kingston. We measured 1.77W for a standard write but 3.02W for a random write, which is about a watt higher than Kingston stated. Nonetheless the overall power consumption numbers look normal and are considered low for modern SSDs.
Warranty
The HyperX is backed by a three-year warranty standard which is industry-standard; some competing drives, namely some offered by Intel, offer a longer five-year warranty period however.
Conclusion
The Kingston HyperX exhibited strong performance throughout our benchmarks in both synthetic and real-world scenarios. It has relatively low power consumption and no significant weaknesses. It matched or defeated its competitors, including the OCZ Vertex 3 and Corsair Force GT (albeit by a small margin); this makes sense as it is based on the same SandForce SF-2281 processor that has been out for some time. One of the strongest areas we found with the HyperX was its random 4K read and write performance, which surpassed competing models.
Currently the HyperX is carrying a slight price premium over its competitors at around $499 MSRP, compared to $479 on the OCZ Vertex 3 Max IOPS. That difference isn’t for nothing though, as Kingston includes a full upgrade kit with external USB enclosure, toolkit, as well as a copy of Acronis to clone your old SSD or HDD. Overall Kingston brings another good product to the market that is simple for buyers to install and upgrade to if needed.
Pros
- Predictably strong SandForce performance
- Intel synchronous NAND
- Offered with full upgrade kit
Cons
- Priced slightly higher over some competitor’s models
Bottom Line
The Kingston HyperX offers competitive performance with very strong random 4K read and write performance, although it has a slight price premium. The price is less of an issue though if you compare the Kingston upgrade kit version against competing bare SSDs.


 Amazon