

Note: Since the publication of this review, this drive has been retested under Testbed4, a newer hardware/software/benchmark platform. Please see this article for updated results. This review remains for reference purposes only.
|
 The Cheetah 10K.7 retains the line’s signature 4-platter construction and pushes density to 75 GB/platter for a 300 GB flagship capacity. When contrasted with the 10K.6, however, other specs remain similar- a 4.7 millisecond access time and an eight-megabyte buffer.
Seagate has at long last moved its 10K RPM series exclusively to fluid dynamic bearing (FDB) motors. Through less metal-to-metal contact, FDB motors improve the drive’s shock resistance and decrease idle noise. The firm also claims additional subtle across-the-board improvements in the manufacturing process and raises the drive’s mean time between failure rating from the 10K.6’s 1.2 million hours to a new high of 1.4 million hours. An industry-standard five year warranty backs the drive.
The Cheetah 10K.7 represents an interesting juncture for the storage giant. While it again doubles 3.5″ SCSI hard disk space to a capacious 300 gigabytes, Seagate has signaled its belief that demand for gigabytes per spindle is giving way to a newer paradigm of spindles per cubic foot. As a result, they have signaled that the 10K.7 is the end of the line for its venerable 10K Cheetah with the svelte 2.5′ Savvio positioned as the Cheetah’s heir-apparent.
Like the Savvio 10K.1 and Cheetah 15K.4, Seagate’s SeaTools Enterprise utility can toggle the 10K.7 from a default, server-intended setting that dynamically adjusts the number and size of buffer segments to a static configuration (32 segments) more appropriate for desktop performance. The 10K.7 joins the Savvio and 15K.4 in exhibiting significant differences between the two segmentation strategies. Thus, the charts that follow present results for both “Desktop” (static segmentation) and “Server” (dynamic segmentation) modes.
In the following tests, the Cheetah 10K.7 will be compared against the following drives for the following reasons:
Seagate Cheetah 10K.6 (147 GB) | Manufacturer’s previous-generation unit |
Fujitsu MAP3147 (147 GB) | Previous-generation competing unit |
Hitachi Ultrastar 146Z10 (147 GB) | Previous-generation competing unit |
Maxtor Atlas 10K V (300 GB) | Current-generation competing unit |
Seagate Savvio 10K.1 (73 GB) | Manufacturer’s 2.5″ unit |
Western Digital Raptor WD740GD (73 GB) | Enterprise-oriented 10K RPM 3.5″ SATA drive |
Low-Level ResultsFor diagnostic purposes only, StorageReview measures the following low-level parameters: Average Read Access Time– An average of 25,000 random accesses of a single sector each conducted through IPEAK SPT’s AnalyzeDisk suite. The high sample size permits a much more accurate reading than most typical benchmarks deliver and provides an excellent figure with which one may contrast the claimed access time (claimed seek time + the drive spindle speed’s average rotational latency) provided by manufacturers. WB99 Disk/Read Transfer Rate – Begin– The sequential transfer rate attained by the outermost zones in the hard disk. The figure typically represents the highest sustained transfer rate a drive delivers. WB99 Disk/Read Transfer Rate – End– The sequential transfer rate attained by the innermost zones in the hard disk. The figure typically represents the lowest sustained transfer rate a drive delivers. |
For more information, please click here.
|
Note: Scores on top are better. |
|
||
ST3300007LW Average Read Service Time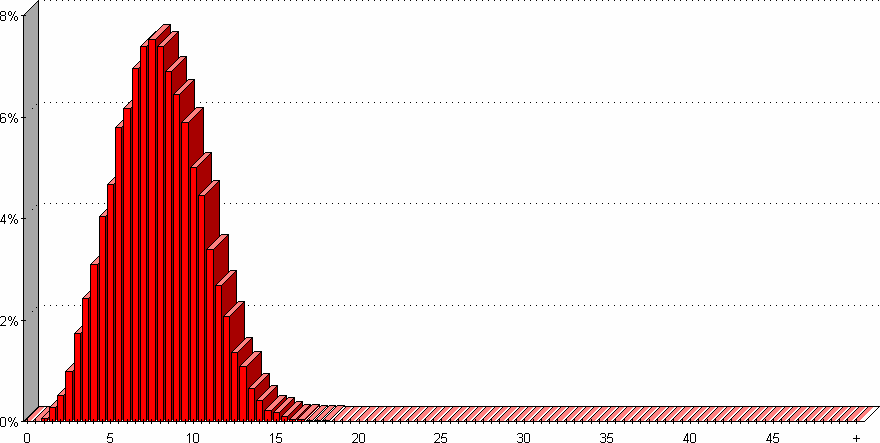
|
||
|---|---|---|
With an average access time of just 5.5 milliseconds, the Atlas 15K II sets a new all-time record. Subtracting 2 ms to account for the latency of a 15K RPM spindle nets a measured average seek time of 3.5 milliseconds, a negligible 0.1 ms off of the firm’s 3.4 ms claim.
|
Note: Scores on top are better. |
|
|||||||||||||||||||||||||||||||||||||||||||||||||||
|
|
||||||||||||||||||||||||||||||||||||||||||||||||||
ST3300007LW Transfer Rate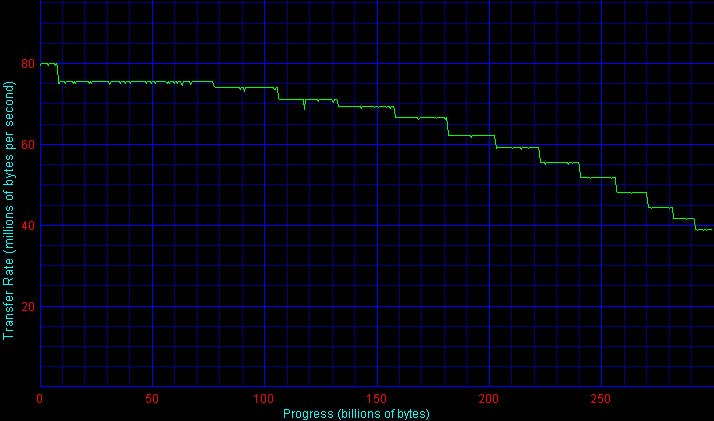
|
|||||||||||||||||||||||||||||||||||||||||||||||||||
WinBench cites a 76.5 MB/sec outer-zone score for the Cheetah 10K.7. Technically, as one may see by eyeballing the transfer rate graph above, the 10K.7 hits 80 MB/sec in its very small outer zone. “Very small,” of course, is a relative term. Due to the 10K.7’s huge 300 GB capacity, said zone still straddles approximately 7 GB of space. Even so, WB99’s call of 76.5 MB/sec is in many ways more accurate as the second zone consists of a much more relevant 70 GB or so of the drive’s capacity. Rates decay steadily, eventually flooring at about 40 MB/sec. It appears that Seagate chose a much more conservative zoning strategy rather than the aggressive packing of data exhibited by Maxtor’s Atlas 10K V.
Single-User PerformanceStorageReview uses the following tests to assess non-server use: StorageReview.com Office DriveMark 2002– A capture of 30 minutes of actual computer productivity use that exactingly recreates a typical office-style multitasking environment. The applications include: Outlook XP, Word XP, Excel XP, PowerPoint XP, Calypso (a freeware e-mail client), SecureCRT v3.3 (a telnet/SSH client), CuteFTP Pro v1.0 (an FTP/SSH client), ICQ 2000b), Palm Hotsync 4.0, Gravity 2.3 (a Usenet/newsgroups client), PaintShop Pro v7.0, Media Player v8 for the occasional MP3, and Internet Explorer 6.0. StorageReview.com High-End DriveMark 2002– A capture of VeriTest’s Content Creation Winstone 2001 suite. Applications include Adobe Photoshop v5.5, Adobe Premiere v5.1, Macromedia Director v8.0, Macromedia Dreamweaver v3.0, Netscape Navigator v4.73, and Sonic Foundry Sound Forge v4.5. Unlike typical productivity applications, high-end audio- and video- editing programs are run in a more serial and less multitasked manner. The High-End DriveMark includes significantly more sequential transfers and write (as opposed to read) operations. |
StorageReview.com Bootup DriveMark 2002– A capture of the rather unusual Windows XP bootup process. Windows XP’s boot procedure involves significantly different access patterns and queue depths than those found in other disk accesses. This test recreates Windows XP’s bootup from the initial bootstrap load all the way to initialization and loading of the following memory-resident utilities: Dimension4 (a time synchronizer), Norton Antivirus 2002 AutoProtect, Palm Hotsync v4.0, and ICQ 2000b.
StorageReview.com Gaming DriveMark 2002– A weighted average of the disk accesses featured in five popular PC games: Lionhead’s Black & White v1.1, Valve’s Half-Life: Counterstrike v1.3, Blizzard’s Diablo 2: Lord of Destruction v1.09b, Maxis’s The Sims: House Party v1.0, and Epic’s Unreal Tournament v4.36. Games, of course, are not multitasked- all five titles were run in a serial fashion featuring approximately half an hour of play time per game.
For more information, please click here.
|
Note: Scores on top are better. |
|
|||||||||||||||||||||||||||||||||||||||||||||||||||
|
|
||||||||||||||||||||||||||||||||||||||||||||||||||
|
|
||||||||||||||||||||||||||||||||||||||||||||||||||
With an SR Office DriveMark of just 407 I/Os per second, the Cheetah 10K.7 lags behind not only the same-generation Maxtor Atlas 10K V but also all previous-generation 10,000 RPM offerings including the manufacturer’s own 10K.6. When set to its desktop-oriented buffer segmentation strategy, the Cheetah 15K.4 manages to deliver some gain over the older Cheetah 15K.3. The 10K.7, however, trails the 10K.6 even with desktop settings. The difference between the 10K.7 and Atlas 10K V is enormous- a staggering 51%.
380 I/Os per second in the High-End DriveMark nets similar gaps between the 10K.7 and the other comparison drives. The 10K.6 bests its successor by nearly 10% while the Atlas trounces the 10K.7, achieving 48% more I/Os per second.
The Cheetah 10K.7 manages a slight climb in the standings when it comes to the Bootup DriveMark. Its 357 I/Os per second is enough to claw its way past Hitachi’s Ultrastar 146Z10. The 10K.7 nonetheless falls behind other units by now familiar margins.
Finally, the Gaming DriveMark returns to the status quo- here the 10K.7 again struggles when compared against all previous-generation units.
Multi-User PerformanceStorageReview uses the following tests to assess server performance: StorageReview.com File Server DriveMark 2002– A mix of synthetically-created reads and writes through IOMeter that attempts to model the heavily random access that a dedicated file server experiences. Individual tests are run under loads with 1 I/O, 4 I/Os, 16 I/Os, and 64 I/Os outstanding. The Server DriveMark is a convenient at-a-glance figure derived from the weighted average of results obtained from the four different loads. StorageReview.com Web Server DriveMark 2002– A mix of synthetically-created reads through IOMeter that attempts to model the heavily random access that a dedicated web server experiences. Individual tests are run under loads with 1 I/O, 4 I/Os, 16 I/Os, and 64 I/Os outstanding. The Server DriveMark is a convenient at-a-glance figure derived from the weighted average of results obtained from the four different loads. For more information click here. |
|
Note: Scores on top are better. |
|
|||||||||||||||||||||||||||||||||||||||||||||||||||
|
|
||||||||||||||||||||||||||||||||||||||||||||||||||
Differences in the two SR Server DriveMarks between the Cheetah 10K.7’s desktop- and server-oriented modes are slight. The latter yields a score of 248 I/Os per second in the File Server DriveMark, a score that trails that of the 10K.6 by a slight margin. The Atlas 10K V, on the other hand, pulls ahead with a significant 16% lead. In the end, however, its Seagate’s Savvio that leads the pack in this penultimate SCSI benchmark.
Results are more tightly clustered in the read-only Web Server DriveMark. The narrow span is reminiscent of the similar results turned in by ATA drives under multi-user loads. The 10K.7 lags behind the category leaders (one of which is the manufacturer’s own 10K.6) by about 6-8%.
As we have been wont to do lately, we should qualify these results by noting that IOMeter in its preferred (unpartitioned) mode does not account for the performance improvement that one may expect to gain from an increase in capacity. The flagship 10K.7 enjoys double the space of the largest 10K.6- given highly random accesses on a similar amount of data, the 10K.7’s deeper cylinders would yield it a performance advantage. Further, in a related case, a 147 GB 10K.7’s lighter actuator may enjoy better positional performance than the older 10K.6.
Legacy PerformanceeTesting Lab’s WinBench 99 Disk WinMark tests are benchmarks that attempt to measure desktop performance through a rather dated recording of high-level applications. Despite their age, the Disk WinMarks are somewhat of an industry standard. The following results serve only as a reference; SR does not factor them into final judgments and recommends that readers do the same. |
|
Note: Scores on top are better. |
|
|||||||||||||||||||||||||||||||||||||||||||||||||||
|
|
||||||||||||||||||||||||||||||||||||||||||||||||||
Heat and NoiseIdle Noise– The sound pressure emitted from a drive measured at a distance of 18 millimeters. The close-field measurement allows for increased resolution between drive sound pressures and eliminates interactions from outside environmental noise. Note that while the measurement is an A-weighted decibel score that weighs frequencies in proportion to human ear sensitivity, a low score does not necessarily predict whether or not a drive will exhibit a high-pitch whine that some may find intrusive. Conversely, a high score does not necessarily indicate that the drive exhibits an intrusive noise envelope. Net Drive Temperature– The highest temperature recorded from a 16-point sample of a drive’s top plate after it has been under heavy load for 80 minutes. The figures provided are net temperatures representing the difference between the measured drive temperature and ambient temperature. For more information, please click here. |
|
Note: Scores on top are better. |
|
|||||||||||||||||||||||||||||||||||||||||||||||||||
|
|
||||||||||||||||||||||||||||||||||||||||||||||||||
FDB motors have finally migrated down to the 10,000 RPM Cheetahs (15K RPM Seagates have enjoyed FDB motors for over three years already). The result is a noticeably lower idle sound pressure measurement- just 42.8 d/BA at a distance of 18 millimeters. Subjective impressions mirror the drop. While the older 10K.6 delivered a noticeable midrange hum, the 10K.7’s idle noise floor is pleasantly analogous to that of a quiet ATA drive.
Seek noise remains more or less the Cheetah’s trademark- a light, hollow sound significantly louder than today’s ATA drives yet a far cry from the heavy rumbles of earlier SCSI units.
Operating temperatures have risen slightly from those of the 10K.6, though they still remain relatively low compared to similar drives. A top plate measurement of 25.4 degrees Celsius above ambient room temperature places the 10K.7 well below the level reached by drives from Maxtor and Hitachi.
ReliabilityThe StorageReview.com Reliability Survey aims to amalgamate individual reader experiences with various hard disks into a comprehensive warehouse of information from which meaningful results may be extracted. A multiple-layer filter sifts through collected data, silently omitting questionable results or results from questionable participants. A proprietary analysis engine then processes the qualified dataset. SR presents results to readers through a percentile ranking system. According to filtered and analyzed data collected from participating StorageReview.com readers, the |
According to filtered and analyzed data collected from participating StorageReview.com readers, a predecessor of the
Seagate Cheetah 10K.7, the
Seagate Cheetah 10K.6
, is more reliable than of the other drives in the survey that meet a certain minimum floor of participation.
Note that the percentages in bold above may change as more information continues to be collected and analyzed. For more information, to input your experience with these and/or other drives, and to view comprehensive results, please visit the SR Drive Reliability Survey.
ConclusionInterestingly, the overall pattern delivered by Seagate’s trio of new-generation models reinforces the likelihood that these regressions are not a result of individual, outlier drives and instead signals that these performance changes may be an artifact of the manufacturer’s latest initiatives in balancing densities, performance, and reliability. Improvements in the first two factors are admittedly easy to assess. Detecting a change in the latter, however, is a much larger task. |
Do high densities, high performance, and high reliability suffer from a ternary-exclusive relationship? Ultimately, only time itself can answer this question. The hesitation of next-generation drives such as the 10K.7 when it comes to delivering anticipated performance improvements, however, suggests that there may indeed be limitations involved.


 Amazon