

Note: Since the publication of this review, this drive has been retested under Testbed4, a newer hardware/software/benchmark platform. Please see this article for updated results. This review remains for reference purposes only.
|
2001’s Cheetah X15-36LP further tweaked the X15’s design with yet lower seek times and a higher 36-gigabyte capacity. It also heralded the maturity of fluid dynamic bearing motors, a feature that previously found a home only in less robust ATA designs. The integration of FDB motors finally meant that whisper-quiet idle operation and ultra-high rotation speeds were no longer mutually exclusive.
 Seagate’s 2002 offering, the impressive Cheetah 15K.3, further refined noise and heat output while delivering an eminently-usable 73 gigabytes of storage. By this time, however, competition arrived from the likes of Fujitsu, Hitachi, and Maxtor. Though it retained a proud first-mover heritage, the 15K.3 certainly received a run for its money when it came to sheer performance.
Enterprise drive manufacturers took a breather in 2003 as the realities of both media and head limitations gripped the industry. While ATA drives inched forward here and there, SCSI drive families, ostensibly a level above their consumer-class brothers in reliability, rested where they were. This year, however, finally saw the announcement of next-generation product from all major players.
The Cheetah 15K.4 packs over 36 gigabytes of data on each of its four miniscule 2.6 inch platters to expand flagship capacity up to 147 GB. Seagate’s specs cite a 3.3 millisecond seek time, shaving 0.3 ms off of the 15K.3’s claim. Buffer size remains an industry-standard eight megabytes.
With the 15K.4, Seagate sees its competitive advantage resting more than ever in reliability and rock-solid operation. The firm has bumped the drive’s Mean Time Between Failure spec from 1.2 million to 1.4 million hours and claims the 15K.4 is the quietest and coolest 15K Cheetah yet.
Seagate’s SeaTools Enterprise utility provides diagnostic and configuration functions for the manufacturer’s SCSI drives. One particular setting permits the user to modify buffer segmentation settings between static allocation (hence allowing data read in advance to remain longer) and dynamic allocation (allowing the size of buffer segments to change as loads and patterns vary). The former paradigm achieves higher buffer hit rates in localized patterns (single-user applications) while the latter tends to lend advantage to highly-random accesses (multi-user applications). In the past, these modes did not drastically change the performance of Seagate’s offerings. With next-generation drives such as the Cheetah 15K.4, 10K.7, and Savvio 10K.1, however, significant differences surface. For the purposes of this review, we have run tests on the 15K.4 in both Desktop (static segment allocation with the drive’s default of 32 segments) and Server (dynamic allocation) modes.
The Cheetah 15K.4 aims to maintain Seagate’s share of the market servicing databases, data warehousing/mining, transaction servers, and other applications that feature highly-random accesses under heavy loads. In the following tests, the Cheetah 15K.4 will be compared against the following drives for the following reasons:
Fujitsu MAS3735 (73 GB) | Manufacturer’s previous-generation unit |
Hitach Ultrastar 15K73 (73 GB) | Previous-generation competing unit |
Maxtor Atlas 15K (73 GB) | Previous-generation competing unit |
Seagate Cheetah 15K.3 (73 GB) | Manufacturer’s previous-generation unit |
Low-Level ResultsFor diagnostic purposes only, StorageReview measures the following low-level parameters: Average Read Access Time– An average of 25,000 random accesses of a single sector each conducted through IPEAK SPT’s AnalyzeDisk suite. The high sample size permits a much more accurate reading than most typical benchmarks deliver and provides an excellent figure with which one may contrast the claimed access time (claimed seek time + the drive spindle speed’s average rotational latency) provided by manufacturers. WB99 Disk/Read Transfer Rate – Begin– The sequential transfer rate attained by the outermost zones in the hard disk. The figure typically represents the highest sustained transfer rate a drive delivers. WB99 Disk/Read Transfer Rate – End– The sequential transfer rate attained by the innermost zones in the hard disk. The figure typically represents the lowest sustained transfer rate a drive delivers. |
For more information, please click here.
|
Note: Scores on top are better. |
|
||
ST3146754LW Average Read Service Time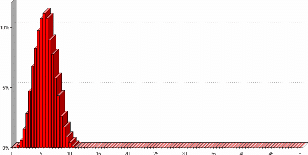
|
||
|---|---|---|
In its default, server-oriented mode, the Cheetah 15K.4 improves upon its predecessor by a small 0.2 millisecond margin and records an access time of 5.7 milliseconds. After taking the into account the average rotational latency of a 15K RPM spindle, the 15K.4’s measured seek time weighs in at 3.7 ms, a bit higher than the firm’s 3.3 ms claim. The 15K.4 nonetheless closes the gap between itself and the competition.
When set to a desktop-oriented buffer segmentation strategy, however, the Cheetah’s access time slips ever so slightly. A 5.9 ms score matches that turned in by the 15K.3.
|
Note: Scores on top are better. |
|
|||||||||||||||||||||||||||||||||||||||
|
|
||||||||||||||||||||||||||||||||||||||
ST3146754LW Transfer Rate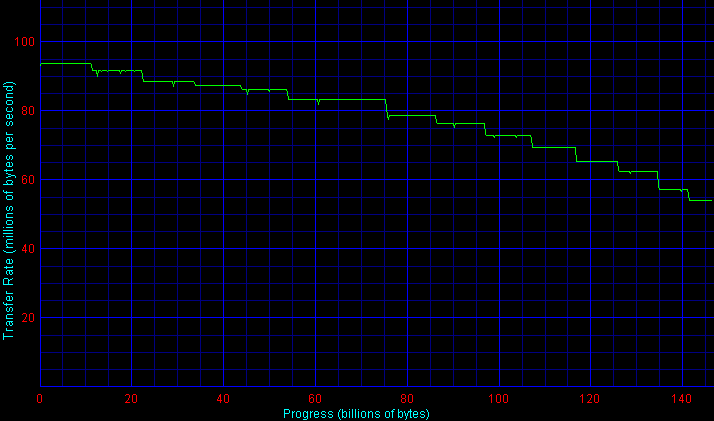
|
|||||||||||||||||||||||||||||||||||||||
A 15,000 RPM spindle speed combined with a record areal density yields impressive maximum transfer rates. The Cheetah 15K.4 delivers 93.2 megabytes per second in its outer zone, easily besting the previous record holder, Fujitsu’s MAS3735. As data moves towards inner cylinders, however, it becomes clear that the 15K.4’s zone layout remains a bit less aggressive than the competition’s. Though an inner-zone score of 56.9 MB/sec is nothing to sneeze at, it falls slightly short of the rate sustained by the MAS.
Single-User PerformanceStorageReview uses the following tests to assess non-server use: StorageReview.com Office DriveMark 2002– A capture of 30 minutes of actual computer productivity use that exactingly recreates a typical office-style multitasking environment. The applications include: Outlook XP, Word XP, Excel XP, PowerPoint XP, Calypso (a freeware e-mail client), SecureCRT v3.3 (a telnet/SSH client), CuteFTP Pro v1.0 (an FTP/SSH client), ICQ 2000b), Palm Hotsync 4.0, Gravity 2.3 (a Usenet/newsgroups client), PaintShop Pro v7.0, Media Player v8 for the occasional MP3, and Internet Explorer 6.0. StorageReview.com High-End DriveMark 2002– A capture of VeriTest’s Content Creation Winstone 2001 suite. Applications include Adobe Photoshop v5.5, Adobe Premiere v5.1, Macromedia Director v8.0, Macromedia Dreamweaver v3.0, Netscape Navigator v4.73, and Sonic Foundry Sound Forge v4.5. Unlike typical productivity applications, high-end audio- and video- editing programs are run in a more serial and less multitasked manner. The High-End DriveMark includes significantly more sequential transfers and write (as opposed to read) operations. |
StorageReview.com Bootup DriveMark 2002– A capture of the rather unusual Windows XP bootup process. Windows XP’s boot procedure involves significantly different access patterns and queue depths than those found in other disk accesses. This test recreates Windows XP’s bootup from the initial bootstrap load all the way to initialization and loading of the following memory-resident utilities: Dimension4 (a time synchronizer), Norton Antivirus 2002 AutoProtect, Palm Hotsync v4.0, and ICQ 2000b.
StorageReview.com Gaming DriveMark 2002– A weighted average of the disk accesses featured in five popular PC games: Lionhead’s Black & White v1.1, Valve’s Half-Life: Counterstrike v1.3, Blizzard’s Diablo 2: Lord of Destruction v1.09b, Maxis’s The Sims: House Party v1.0, and Epic’s Unreal Tournament v4.36. Games, of course, are not multitasked- all five titles were run in a serial fashion featuring approximately half an hour of play time per game.
For more information, please click here.
|
Note: Scores on top are better. |
|
|||||||||||||||||||||||||||||||||||||||
|
|
||||||||||||||||||||||||||||||||||||||
|
|
||||||||||||||||||||||||||||||||||||||
StorageReview’s Desktop DriveMarks uncover amazing differences in the Cheetah 15K.4’s different segmentation strategies.
With dynamic (server-oriented) segmentation, the 15K.4 manages an Office DriveMark of just 433 I/Os per second, a score surpassed by the majority of today’s 7200 RPM ATA disks! Static segmentation, on the other hand, turns in a far more impressive mark of 633 I/Os per second- a gap of 46 percent! The latter score edges by the Atlas 15K to set a new Office DriveMark record.
The trend continues in the High-End DriveMark. When in dynamic segmentation mode, the Cheetah delivers an anemic 439 I/Os per second. When buffer segmentation remains static, however, the 15K.4 climbs to the top of the chart at 559 I/Os per second and again bests all other 15,000 RPM disks. The actual margin between the modes shrinks to 27%, still a massive difference.
At its default setting, Seagate’s drive achieves 433 I/Os per second in the Bootup DriveMark. Toggling the buffer improves the Cheetah’s score by 36% to 588 I/Os per second. This time, however, the Cheetah’s trick fails to propel it past Fujitsu’s MAS3735.
Finally, the 15K.4’s dynamic and static scores in the Gaming Drivemark weigh in respectively at 512 I/Os and 788 I/Os per second. The latter score again falls just short of unseating the category leader, this time the Maxtor Atlas 15K.
Multi-User PerformanceStorageReview uses the following tests to assess server performance: StorageReview.com File Server DriveMark 2002– A mix of synthetically-created reads and writes through IOMeter that attempts to model the heavily random access that a dedicated file server experiences. Individual tests are run under loads with 1 I/O, 4 I/Os, 16 I/Os, and 64 I/Os outstanding. The Server DriveMark is a convenient at-a-glance figure derived from the weighted average of results obtained from the four different loads. StorageReview.com Web Server DriveMark 2002– A mix of synthetically-created reads through IOMeter that attempts to model the heavily random access that a dedicated web server experiences. Individual tests are run under loads with 1 I/O, 4 I/Os, 16 I/Os, and 64 I/Os outstanding. The Server DriveMark is a convenient at-a-glance figure derived from the weighted average of results obtained from the four different loads. For more information click here. |
|
Note: Scores on top are better. |
|
|||||||||||||||||||||||||||||||||||||||
|
|
||||||||||||||||||||||||||||||||||||||
Differences between dynamic and static segmentation narrow significantly under server loads.
The Cheetah 15K.4 endeavors, of course, to service busy multi-user servers rather than hot rod owners who insist on having the latest and (ostensibly) greatest. With its ‘out of the box’ strategy (dynamic segmentation), the 15K.4 hits 338 I/Os per second in the File Server DriveMark. Although doing so unveils huge performance gains under single-user loads, switching to static segments here results in regression. The disparity, however, is relatively slight- approximately 5%.
Distinctions muddy further in the read-only Web Server DriveMark. Despite the test’s decidedly random access, the Cheetah performs ever-so-slightly better (by 2%) when segmentation is kept static rather than dynamic. The Web Server pattern’s exclusive use of reads, however, is not the most realistic of loads- even a web server writes data in certain cases- virtual memory management, for example.
Most interesting of all, however, is how the 15K.4 compares against its predecessor- neither mode allows it to match the performance delivered by the older 15K.3 under either server load.
In the 15K.4’s defense, one must remember that the synthetic nature of these IOMeter tests prevent them from fully accounting for a drive’s increased capacity. Given a fixed amount of data, the 147 GB 15K.4 enjoys significantly deeper cylinders than the 73 GB 15K.3 and would confine its seeks to an appreciably smaller area. In a similar vein, a 73 GB Cheetah 15K.4 features a lighter, more nimble actuator than that of a 73 GB 15K.3.
In the end, however, the 15K.4 is the first drive that does not improve on its predecessor’s multi-user performance- an interesting if dubious distinction.
Legacy PerformanceeTesting Lab’s WinBench 99 Disk WinMark tests are benchmarks that attempt to measure desktop performance through a rather dated recording of high-level applications. Despite their age, the Disk WinMarks are somewhat of an industry standard. The following results serve only as a reference; SR does not factor them into final judgments and recommends that readers do the same. |
|
Note: Scores on top are better. |
|
|||||||||||||||||||||||||||||||||||||||
|
|
||||||||||||||||||||||||||||||||||||||
Heat and NoiseIdle Noise– The sound pressure emitted from a drive measured at a distance of 18 millimeters. The close-field measurement allows for increased resolution between drive sound pressures and eliminates interactions from outside environmental noise. Note that while the measurement is an A-weighted decibel score that weighs frequencies in proportion to human ear sensitivity, a low score does not necessarily predict whether or not a drive will exhibit a high-pitch whine that some may find intrusive. Conversely, a high score does not necessarily indicate that the drive exhibits an intrusive noise envelope. Net Drive Temperature– The highest temperature recorded from a 16-point sample of a drive’s top plate after it has been under heavy load for 80 minutes. The figures provided are net temperatures representing the difference between the measured drive temperature and ambient temperature. For more information, please click here. |
|
Note: Scores on top are better. |
|
|||||||||||||||||||||||||||||||||||||||
|
|
||||||||||||||||||||||||||||||||||||||
The Cheetah 15K.4 does not quite attain its forerunner’s enviably low heat and noise floors. That said, while a sound pressure 48.7 d/BA at a distance of 18 millimeters may sound rather high, the Seagate’s overall noise profile is not bothersome at all, thanks largely due to its fluid dynamic bearing motors. Though one may be able to hear the drive’s idle noise over an ultra-quiet power supply and CPU fan, it is highly likely that the subtle, inconspicuous hum will fade from conscious audibility. On the other hand, seek noises are what one would expect from a drive that boasts access times of less than 6 milliseconds. Though the 15K.4 does not rumble away like an older drive, the hollow, light actuator noise is definitely there.
As a four-platter drive with a 15,000 RPM spindle speed, the Cheetah hits a top-plate temperature of more than 30 degrees Celsius above ambient room temperature. Care must be taken to ensure that plenty of ventilation and airflow support the drive.
ReliabilityThe StorageReview.com Reliability Survey aims to amalgamate individual reader experiences with various hard disks into a comprehensive warehouse of information from which meaningful results may be extracted. A multiple-layer filter sifts through collected data, silently omitting questionable results or results from questionable participants. A proprietary analysis engine then processes the qualified dataset. SR presents results to readers through a percentile ranking system. According to filtered and analyzed data collected from participating StorageReview.com readers, the |
According to filtered and analyzed data collected from participating StorageReview.com readers, a predecessor of the
Seagate Cheetah 15K.4, the
Seagate Cheetah 15K.3
, is more reliable than of the other drives in the survey that meet a certain minimum floor of participation.
Note that the percentages in bold above may change as more information continues to be collected and analyzed. For more information, to input your experience with these and/or other drives, and to view comprehensive results, please visit the SR Drive Reliability Survey.
ConclusionNext-generation 15,000 RPM screamers have been a long time in coming- corporate purchasers, VARs, OEMs, and ever-vocal enthusiasts all have been carefully eyeing products announced so many months ago. Seagate’s Cheetah 15K.4 is a decidedly mixed bag. Ironically, despite the drive’s target market, performance increases are most abundant in single-user scenarios rather than multi-user applications- and these increases arise only when the drive’s buffer segmentation strategy is toggled through the SeaTools Enterprise utility. In multi-user loads, however, the 15K.4 actually backtracks slightly when contrasted with the Cheetah 15K.3 and does not quite match the low thermal and acoustic levels of its predecessor. |
In fact, the glaring lack of improvements in overall performance is enough to make one wonder whether or not this review sample operates properly. When approached, however, Seagate frankly admits that the numbers borne out above represent the differences in performance that one may expect between the 15K.4 and its precursor.
With its latest generation of 10K and 15K units, Seagate claims a greater-than-ever emphasis on reliability and implies that delivering the across-the-board improvements that some expect would compromise this goal.
Generally speaking, SR refrains from direct comments on unit reliability, a measure that remains beyond the scope of even the largest publications. Even our Drive Reliability Database‘s results usually stand on their own- we prefer readers to draw their own conclusions rather than commenting directly on the scores.
That said, it is hard to ignore the stellar 92nd percentile mark that the Cheetah 15K.3 currently boasts in the Reliability Database. If Seagate maintains or even builds upon such a record with the 15K.4, its lack of key performance improvements may become easier to overlook.


 Amazon