

We all know SSDs are fast, but we also know they’re fast for a finite period of time. SSDs wear out as they’re written to, some faster than others depending on NAND, how much or what type of data is written to the SSD and so on. The fear of SSD death, or poor performance in an old SSD, keeps many people from migrating to solid state. Coming to grips with endurance is difficult for consumers, because as with cell phone minutes, most of us don’t know how much data we write in a given day. So the notion of counting program/erase cycles in an SSD as it ages, is more than a bit foreign. To help SSD buyers and current owners get a better perspective on SSD life and endurance, we’ve been torturing a Patriot Wildfire SSD with constant drive writes for the better part of a month and have benchmarked it for this review, 270TB later. In this review, we look at just how much performance changes over time when you bring a 120GB LSI SandForce SF-2200-powered SSD to 21% of remaining life.
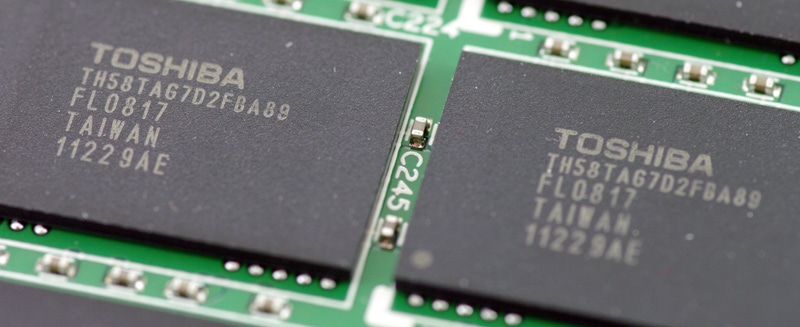
When it comes to analyzing the performance of flash storage media over time, it’s important to realize that SSDs change as the NAND wears in. When we talk about this performance change, it isn’t from garbage collection, TRIM being enabled, or even steady-state use, but instead it surrounds how the flash degrades as it nears its program/erase (P/E cycle) limit. For this particular drive that limit is around 5,000 P/E cycles using 32nm Toshiba MLC Toggle NAND.
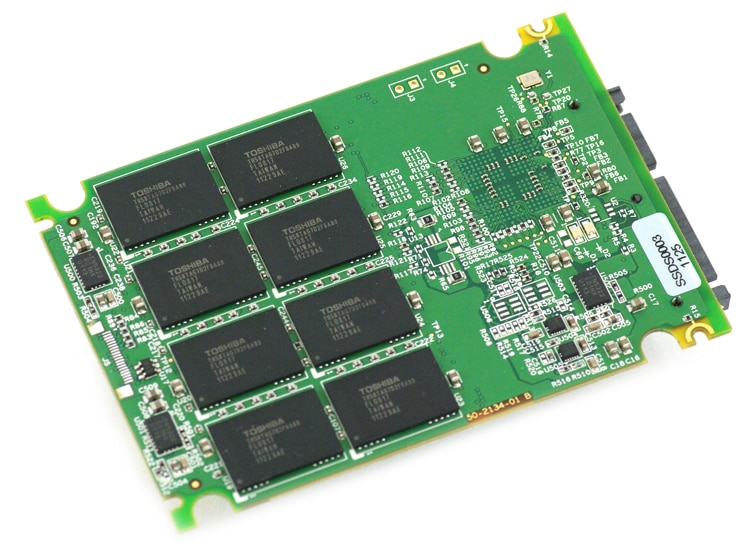
To show what these changes look like as an SSD ages we took a 120GB Patriot WildFire SSD down to 21% life remaining, with 270TB of incompressible data written to it, and secure erased it to test it in an almost fresh “out of box” state. The firmware was also updated during this time to improve reliability from the SandForce BlueScreen Bug, going from version 319A originally reviewed to 332A, which is the latest available, but isn’t a performance upgrade.
Synthetic Benchmarks
Out of the box, the Patriot Wildfire listed speeds topping 555MB/s read and write speeds of 520MB/s; right at the upper limits of the SATA III interface. To see how performance leveled off after a write-intensive period of time, we used IOMeter with a 2MB sequential transfer test to gauge the straight line performance of this drive. These tests only last a few minutes long, looking at sustained burst speeds, but not dipping into steady-state.
Performance largely remained the same with large-block transfers. With compressible data the peak 2MB read speed dropped 5MB/s but looking at incompressible performance the drive actually gained 9MB/s in write speed.
Switching to random transfers, our next test keeps the same 2MB transfer size in IOMeter, but changes from a sequential to random workload.
In this area incompressible speeds remained largely the same, while with incompressible data the aged Patriot Wildfire still had a lead of 5MB/s in write speed.
Transitioning to small-block transfers out next test looks at 4K random performance also using IOMeter.
With small-block random transfers the aged Patriot Wildfire with 270TB written was faster on all counts, picking up with incompressible and compressible random read and write speeds. With compressible data the aged drive picked up speed by 6.4%, while looking at incompressible performance it got a boost of just 0.7%. Still not too shabby for a drive this far into its useful life.
Keeping the 4K random transfer test, we look at performance under an ever-increasing workload. This simulates a multithreaded work environment, scaling from a queue depth of 1 to 64.
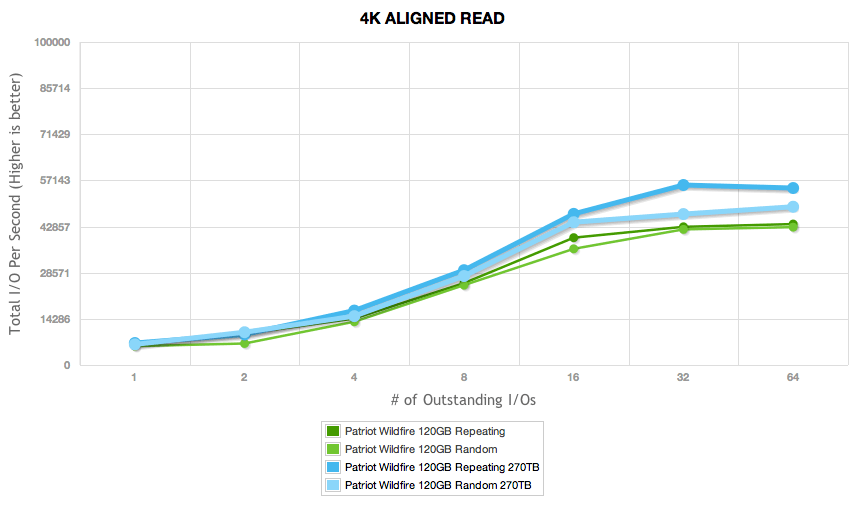
The worn Patriot Wildfire maintained its lead over the fresh “out of the box” Patriot Wildfire all the way up through the higher queue depths, peaking at 55,000 IOPS versus 44,000 IOPS new.
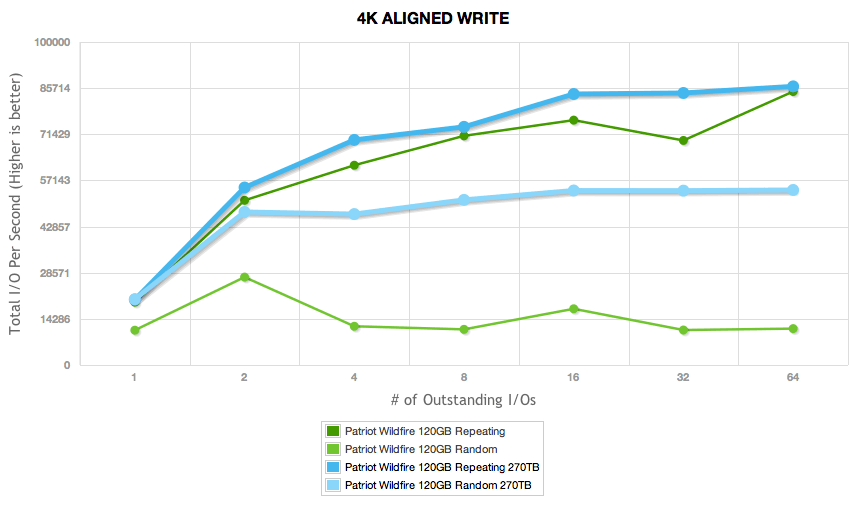
4K random write speeds were an interesting change, which either came as an undisclosed benefit to one of the recent stability-related firmware updates or as a change from the drive as the NAND started to break in. Across the board performance improved and became much more stable at higher queue depths with a random 4K write workload for both incompressible and compressible data.
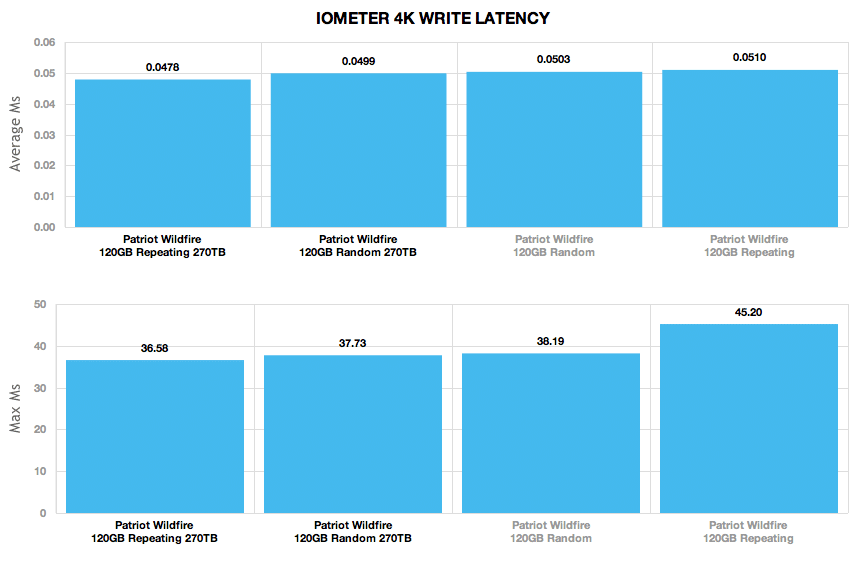
Our next test looks at drive latency at a queue depth of one. In this test we are looking not only at the average response time, but also if peak latency has changed as the drive got more worn. Average latency dropped with the increase in random 4K write performance, measuring 0.0478ms worn to 0.0510ms new with repeating data and 0.0499ms worn to 0.0503ms new with randomized data. Peak latency also dropped as got closer to its end of life, with a new peak latency speed of 36.58ms compared to 45.20 out of the box.
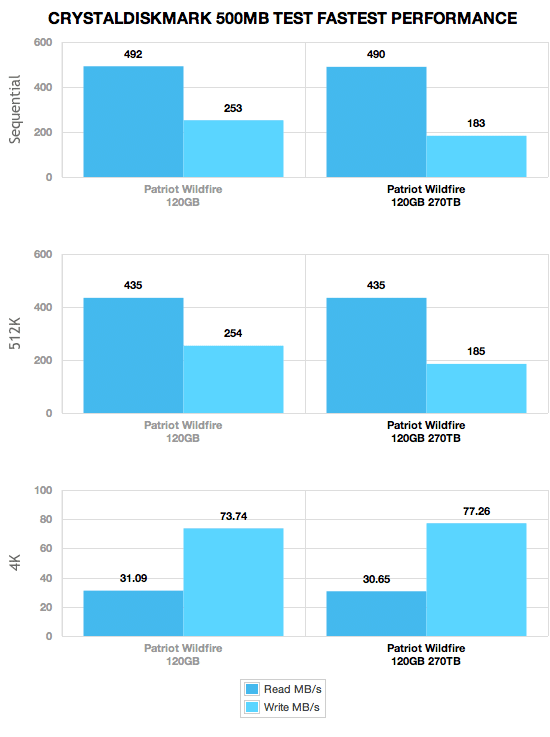
Using CrystalDiskMark with incompressible data, we started to see more noticeable differences with the new versus worn SSD. CrystalDiskMark showed slower sequential and random 512K write speeds, dropping from 253MB/s when new to 183MB/s when worn in. With this drop though it still showed the worn model as having higher random 4K write speeds.
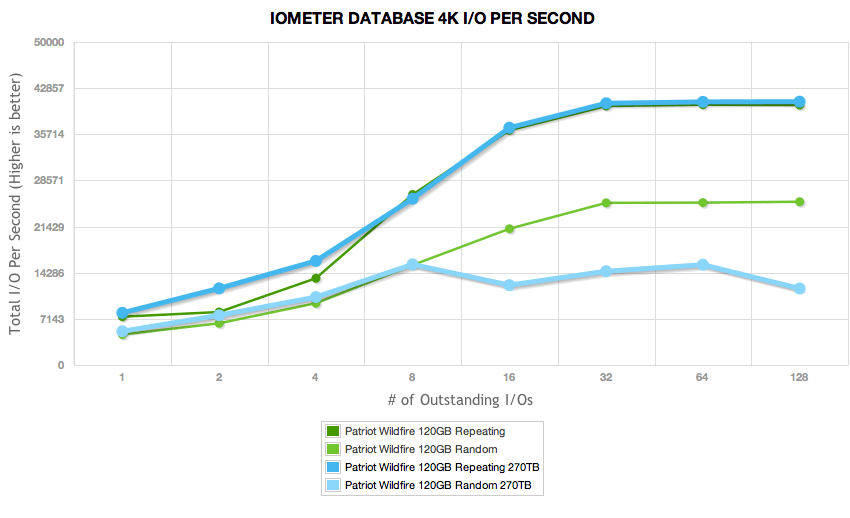
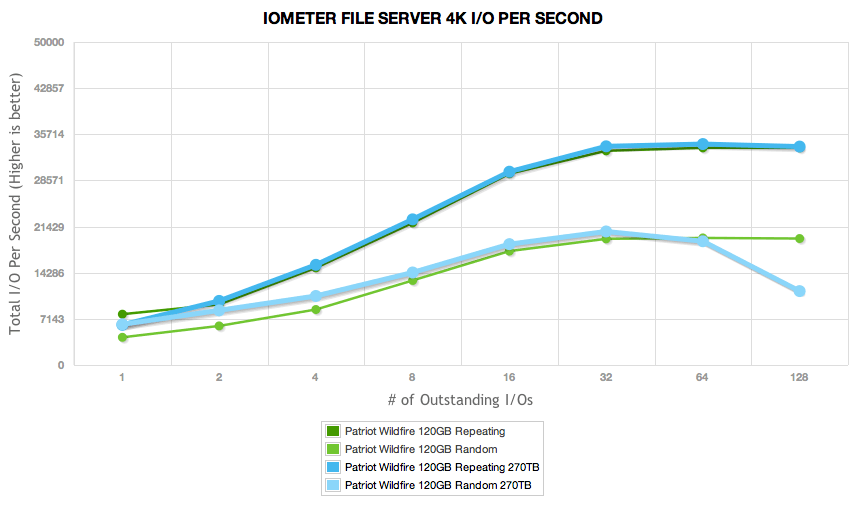
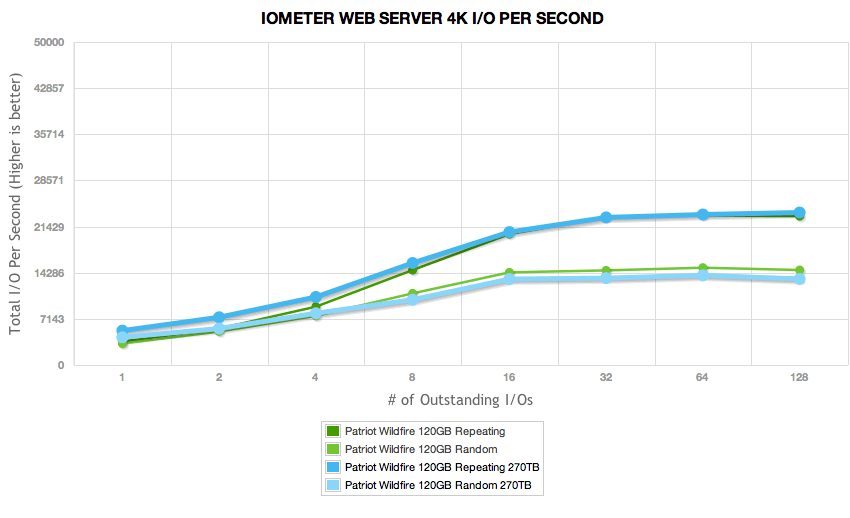
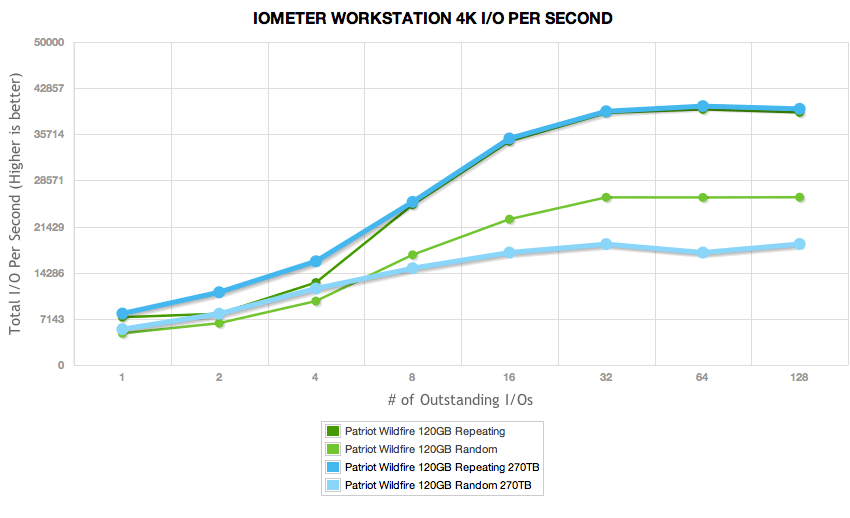
Our last group of synthetic benchmarks looks at a mixed high-queue depth workload covering server profiles. These tests scale from a queue depth of 1 to a queue depth of 128. The biggest change we could see in this areas was that under a constant mixed read/write-workload, performance of the Patriot Wildfire with 270TB on the clock finally started to drop, specifically with incompressible data speeds. In our Database and Workstation profiles specifically, performance dropped significantly right around a queue depth of 8. File server and read-only Webserver performance remained mostly the same under both data profiles, with some drifting performance of the worn Wildfire past a queue depth of 64.
Real-World Benchmarks
The first real-life test is our HTPC scenario. In this test we include: playing one 720P HD movie in Media Player Classic, one 480P SD movie playing in VLC, three movies downloading simultaneously through iTunes, and one 1080i HDTV stream being recorded through Windows Media Center over a 15 minute period. Higher IOps and MB/s rates with lower latency times are preferred. In this trace we recorded 2,986MB being written to the drive and 1,924MB being read.
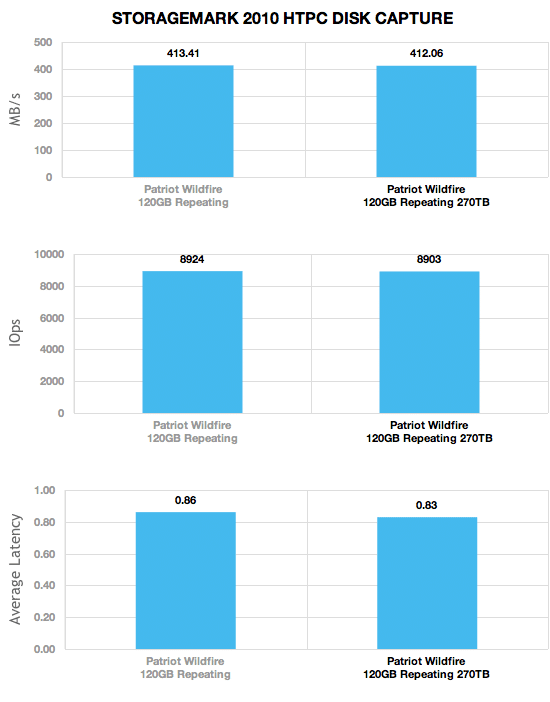
HTPC trace performance maintained the same, although average latency on the worn drive dropped from 0.86ms to 0.83ms.
Our second real-life test covers disk activity in a productivity scenario. For all intents and purposes this test shows drive performance under normal daily activity for most users. This test includes: a three hour period operating in an office productivity environment with 32-bit Vista running Outlook 2007 connected to an Exchange server, web browsing using Chrome and IE8, editing files within Office 2007, viewing PDFs in Adobe Reader, and an hour of local music playback with two hours of additional online music via Pandora. In this trace we recorded 4,830MB being written to the drive and 2,758MB being read.
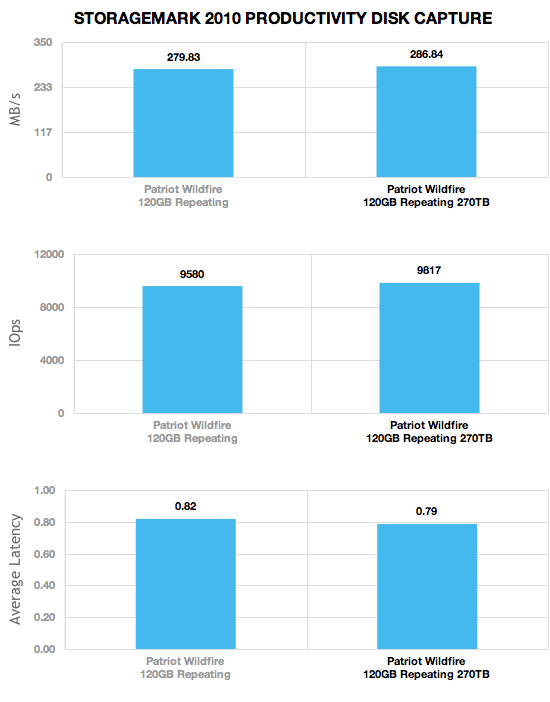
In a productivity setting the worn Patriot Wildfire picked up 7MB/s in overall transfer speed as well as improved on latency figures dropping from 0.82ms to 0.79ms.
Our third real-life test covers disk activity in a gaming environment. Unlike the HTPC or Productivity trace, this one relies heavily on the read performance of a drive. To give a simple breakdown of read/write percentages, the HTPC test is 64% write, 36% read, the Productivity test is 59% write and 41% read, while the gaming trace is 6% write and 94% read. The test consists of a Windows 7 Ultimate 64-bit system pre-configured with Steam, with Grand Theft Auto 4, Left 4 Dead 2, and Mass Effect 2 already downloaded and installed. The trace captures the heavy read activity of each game loading from the start, as well as textures as the game progresses. In this trace we recorded 426MB being written to the drive and 7,235MB being read.
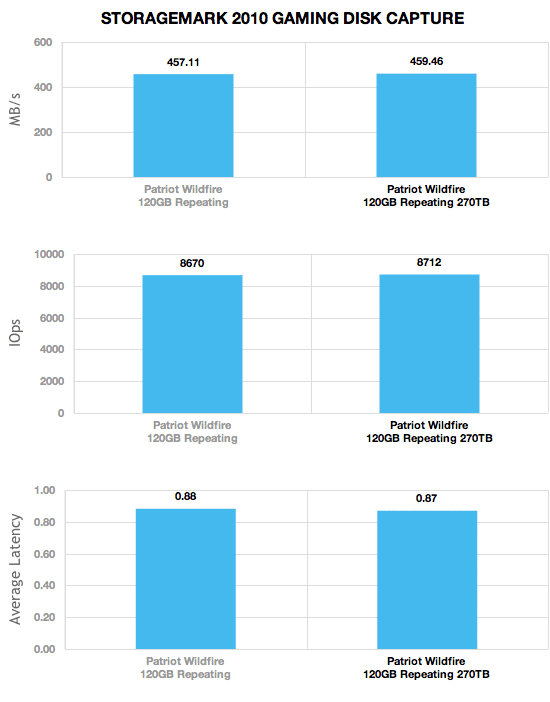
Similar to the productivity performance we measured, gaming performance also improved, picking up 2.35MB/s and speeding up in average response time by 0.01ms.
Power Consumption
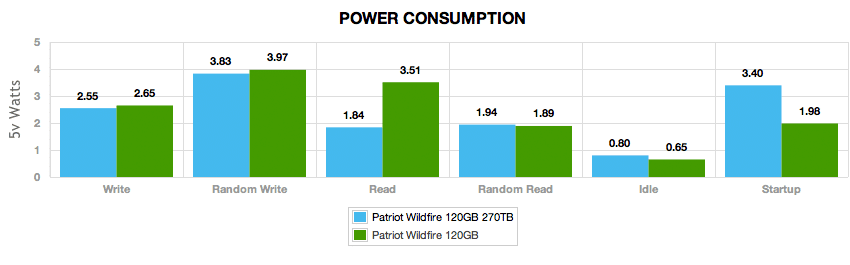
While we could see changes in performance, it was also important for us to measure power consumption after our torture test. On the worn SSD, power usage during write activity dropped for both compressible and incompressible data. Sequential read power usage dropped significantly, from 3.51 watts new to 1.84 watts broken in. All other activity remained roughly the same, with a spike in startup power requirements.
Conclusion
As we compare the 120GB Patriot Wildfire in its out of the box new state to a beaten near-to-death state, the results are pretty impressive. Granted this is a single drive sample, but consumers looking for a mainstream SSD should be at least somewhat comforted with these results. With 20% remaining and 270TB written to the drive, performance gained in some areas falters mildly in others, but at the end of the day the drive is still cruising along at near new speeds. We also learned that under certain usage profiles, namely those that might affect enterprise users, performance did start to drop with incompressible data at high queue depths. With eMLC NAND, those types of conditions wouldn’t be neared until way more data had been written to the drive.
If we figure a five year projected life for the Wildfire, that means even if we stopped using the SSD now with 20% remaining, the 270TB written equates to roughly 150GB written to the drive per day, more than a full drive write per day. Even the most aggressive consumers won’t come close to punishing an SSD that bad and if you do, you likely know it and will accept a shorter than five year drive life. The type of NAND inside this drive also makes a difference, using 32nm MLC Toggle NAND, rated for 5,000 P/E cycles versus 3,000 from 2xnm.
While admittedly a sample size of one, the data is still interesting and relevant as the adoption of SSDs increases. StorageReview is continuing to develop additional endurance testing with the goal of bringing more of this information to the public, to help better educate consumers around SSD life expectations.
Patriot Wildfire at Amazon.comDiscuss This Review


 Amazon