

The Synology RackStation RS3412xs and RS3412RPxs 2U rack mount NAS units offer 10 3.5″ drive bays and Synology’s robust DiskStation Manager 4.1 (DSM). Synology offers several enterprise-class features, note the RP in the RS3412RPxs stands for redundant power supply, and Synology offers an optional 10GbE card to take advantage of top-line performance of 100,000+ IOPS using SSDs in RAID5. The chassis supports up to 40TB natively with 4TB hard drives, and can scale to 136TB of total capacity using the RX1211 or RX1211RP expansion shelves.
Internally, the RS3412xs uses a dual core 3.1GHz processor and 2GB DDR3 RAM, which is expandable to 6GB. With an eye toward use in virtualized environments, Synology has had the unit certified to work with VMware, Citrix and Microsoft Hyper-V. The RS3412xs slots in at the entry-point of Synology’s large scale business line, which has been growing and adding features as a rapid clip. Other units in the family scale in performance with quad core CPUs and additional RAM, which helps support higher capacities and new features like SSD caching.
Like all Synology units, the RS3412xs is sold without disks, customers may populate the bays with whatever they wish off of Synology’s compatibility list. A three year warranty comes standard, though it can be bought out to five years. The RS3412xs carries a street price of roughly $3000, while the RS3412RPxs runs $4000.
Synology RackStation RS3412xs Specifications
- CPU: Dual Core 3.1GHz
- Memory: DDR3 2GB ECC RAM (Expandable, up to 6GB)
- Internal HDD/SSD : 3.5″ or 2.5″ SATA(II) x 10
- Max Internal Capacity: 40TB (Capacity will vary by RAID types)
- Hot Swappable Drive Bays
- External HDD Interface: USB 2.0 Port x 4, Expansion Port x 2
- Rail Kit: Synology 2U Rail Kit Sliding (optional)
- Size (HxWxD): 88 X 445 X 570 mm
- Weight: 12.77Kg (RS3412xs), 14.87Kg (RS3412RPxs)
- LAN: Gigabit X4 (optional 10GbE x 2 add-on card is supported)
- Link Aggregation
- Wake on LAN/WAN
- System Fan: 80x80mm X4
- Noise Level: 41 dB(A) (RS3412xs), 41.8 dB(A) (RS3412RPxs)
- Power Consumption: 115.5W (Access); 57.2W (HDD Hibernation)
- Redundant Power Supply: RS3412RPxs
- Operating Temperature: 5°C to 35°C (40°F to 95°F)
- Storage Temperature: -10°C to 70°C (15°F to 155°F)
- Relative Humidity: 5% to 95% RH
- Maximum Operating Altitude: 6,500 feet
- Warranty: 3 Years
Design and Build
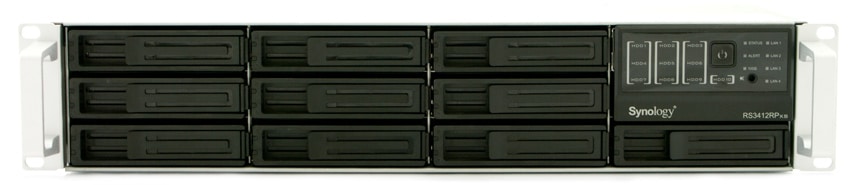
The Synology RackStation RS3412RPxs is a 2U rack-mounted SAN/NAS designed for medium to large businesses. It offers 10 front-mounted hot-swappable 3.5″ bays that can be equipped with either 3.5″ or 2.5″ drives, including high-capacity HDDs or high-performance SSDs. From the front, users can quickly assess overall health of the RackStation as well as focus in on individual components. Synology provides activity LEDs for each individual hard drive and each network connection so IT can quickly diagnose problems by just looking at the system, instead of logging into a management screen.
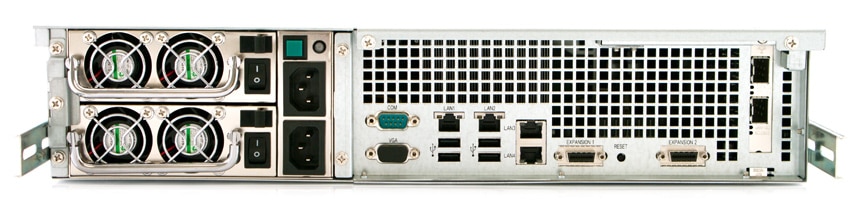
The rear of the RackStation RS3412RPxs is setup with four 1GbE LAN ports, four USB 2.0 ports, two expansion interfaces to connect to additional disk shelves, as well as two 10GbE SFP+ ports on units equipped with optional 10GbE support. Also visible are four 40mm fans (rated at 41.8dB in use) on the back of the two redundant power supplies. The RS3412RPxs includes two power supplies, whereas the RS3412xs just includes one standard power unit and is not equipped to be upgraded later on.
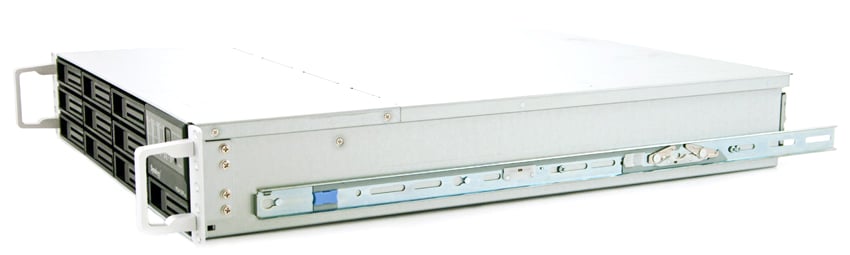
Synology includes sliding rails with the RackStation that are fairly easy to install and setup. Some guesswork had to be taken to extend the rails (as those steps weren’t included in the rail manual) but if you are familiar with this type of equipment it was very simple to handle those additional steps. Once the rails are installed inside the rack as well as onto the side of the RackStation, you slide the system into position and they lock in place. The rails give a full range of motion, and bring the RackStation about 3-4″ outside of the front of the rack when fully extended, allowing for complete servicing with the unit still connected to the rails.
Testing Background and Comparables
When it comes to testing enterprise hardware, the environment is just as important as the testing processes used to evaluate it. At StorageReview we offer the same hardware and infrastructure found in many datacenters where the devices we test would ultimately be destined for. This includes enterprise servers as well as proper infrastructure equipment like networking, rack space, power conditioning/monitoring, and same-class comparable hardware to properly evaluate how a device performs. None of our reviews are paid for or controlled by the manufacturer of the equipment we are testing.
StorageReview Enterprise Test Lab
StorageReview 10GbE Enterprise Testing Platform:
- 2 x Intel Xeon X5650 (2.66GHz, 12MB Cache)
- Windows Server 2008 Standard Edition R2 SP1 64-Bit and CentOS 6.2 64-Bit
- Intel 5500+ ICH10R Chipset
- Memory – 8GB (2 x 4GB) 1333Mhz DDR3 Registered RDIMMs
Mellanox SX1036 10/40Gb Ethernet Switch and Hardware
- 36 40GbE Ports (Up to 64 10GbE Ports)
- QSFP splitter cables 40GbE to 4x10GbE
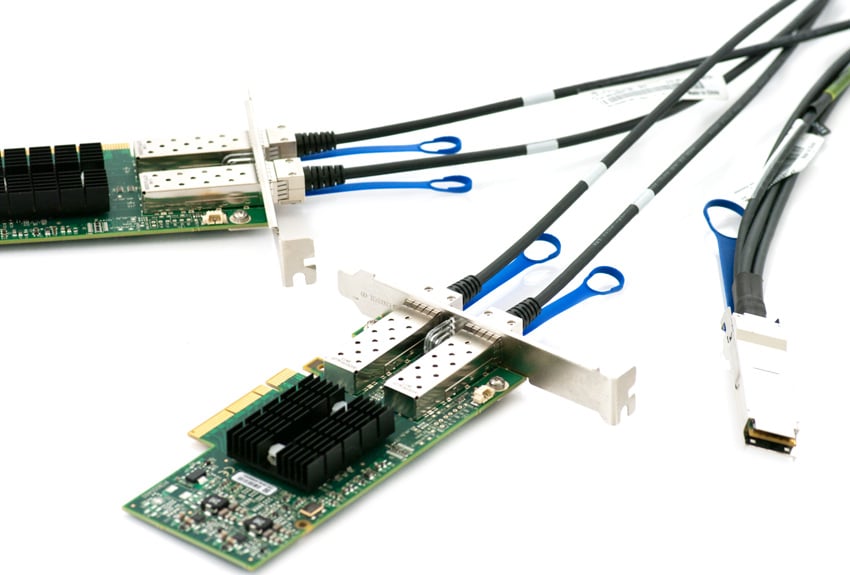
- Mellanox ConnectX-3 EN PCIe 3.0 Twin 10G Ethernet Adapter
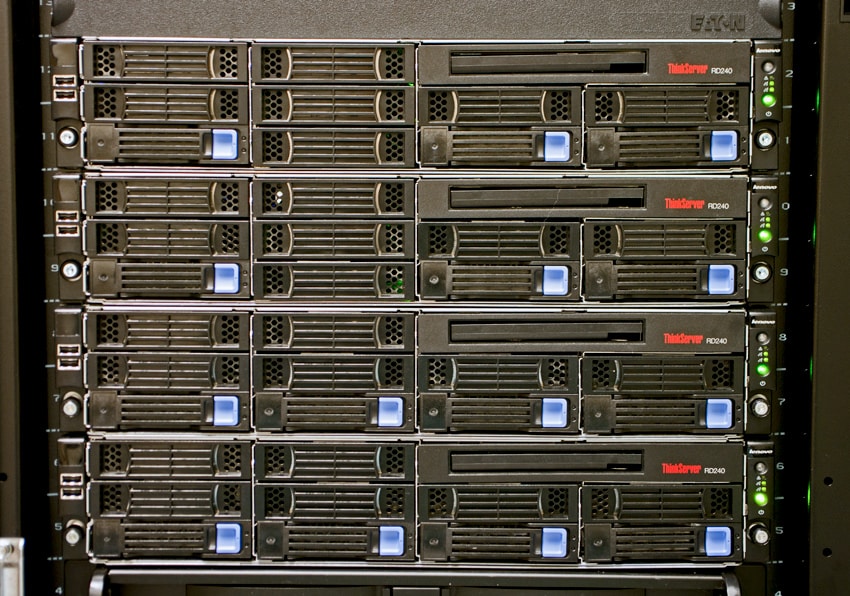
Our current 10/40Gb Ethernet SAN and NAS testing infrastructure consists of our Lenovo ThinkServer RD240 testing platform equipped with Mellanox ConnectX-3 PCIe adapters connected through Mellanox’s 36-port 10/40GbE switch. This environment allows the storage device we are testing to be the I/O bottleneck, instead of the networking gear itself.
Enterprise Synthetic Workload Analysis
For storage array reviews we precondition with a heavy load of 8 threads with an outstanding queue of 8 per thread, and then test in set intervals in multiple thread/queue depth profiles to show performance under light and heavy usage. For tests with 100% read activity, preconditioning is with the same workload, although flipped to 100% write.
Preconditioning and Primary Steady-State Tests:
- Throughput (Read+Write IOPS Aggregate)
- Average Latency (Read+Write Latency Averaged Together)
- Max Latency (Peak Read or Write Latency)
- Latency Standard Deviation (Read+Write Standard Deviation Averaged Together)
At this time Enterprise Synthetic Workload Analysis includes common sequential and random profiles, which can attempt to reflect real-world activity. These were picked to have some similarity with our past benchmarks, as well as a common ground for comparing against widely published values such as max 4K read and write speed, as well as 8K 70/30 commonly used for enterprise drives. We also included two legacy mixed workloads, including the traditional File Server and Webserver offering a wide mix of transfer sizes.
- 4K (Random)
- 100% Read or 100% Write
- 8K (Sequential)
- 100% Read or 100% Write
- 8K 70/30 (Random)
- 70% Read, 30% Write
- 1024K (Sequential)
- 100% Read or 100% Write
- File Server (Random)
- 80% Read, 20% Write
- 10% 512b, 5% 1k, 5% 2k, 60% 4k, 2% 8k, 4% 16k, 4% 32k, 10% 64k
- Webserver (Random)
- 100% Read
- 22% 512b, 15% 1k, 8% 2k, 23% 4k, 15% 8k, 2% 16k, 6% 32k, 7% 64k, 1% 128k, 1% 512k
For our review of the Synology RackStation RS3412RPxs we configured the system using both high-capacity platter drives and high-performance flash drives. In our high-capacity array, we used 10 4TB Hitachi Ultrastar 7K4000 hard drives, while our high-performance array used 10 200GB Kingston SSDNow E100 SSDs. In both setups we utilized a RAID10 configuration. To connect our Lenovo ThinkServer RD240 to the RackStation RS3412RPxs we utilized its twin 10GbE network interface to attach an iSCSI share with MPIO. From each iSCSI share interacted with a 50GB partition.
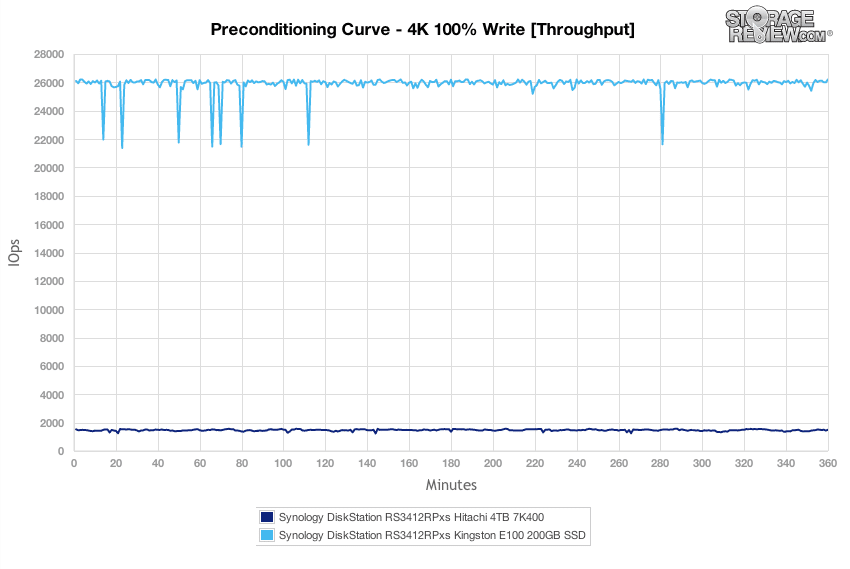
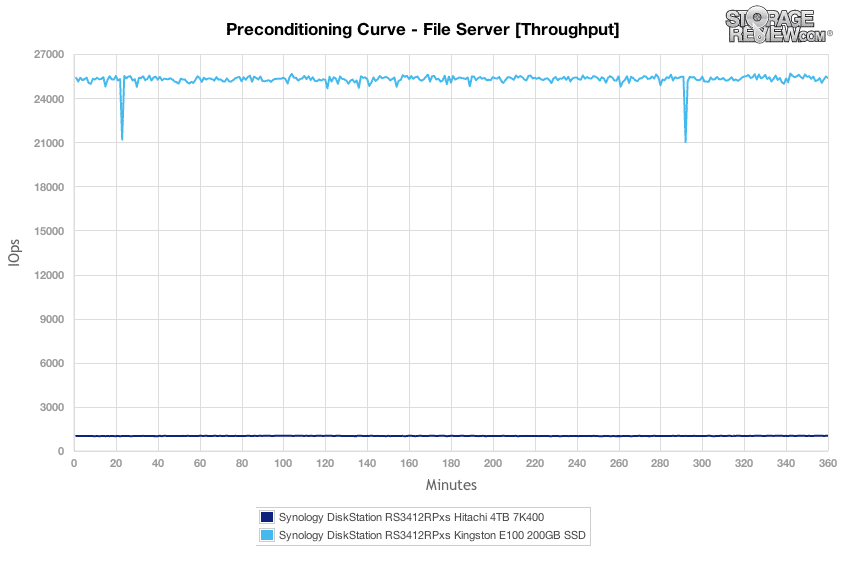
Our first test measures 100% 4K random write performance in a preconditioning stage lasting 6 hours with a load of 16 threads and 16 queue (effective 256). In this test we measured roughly 26,000 IOPS over the course of the test from the SSD array, while the HDD array came in at 1,500 IOPS.
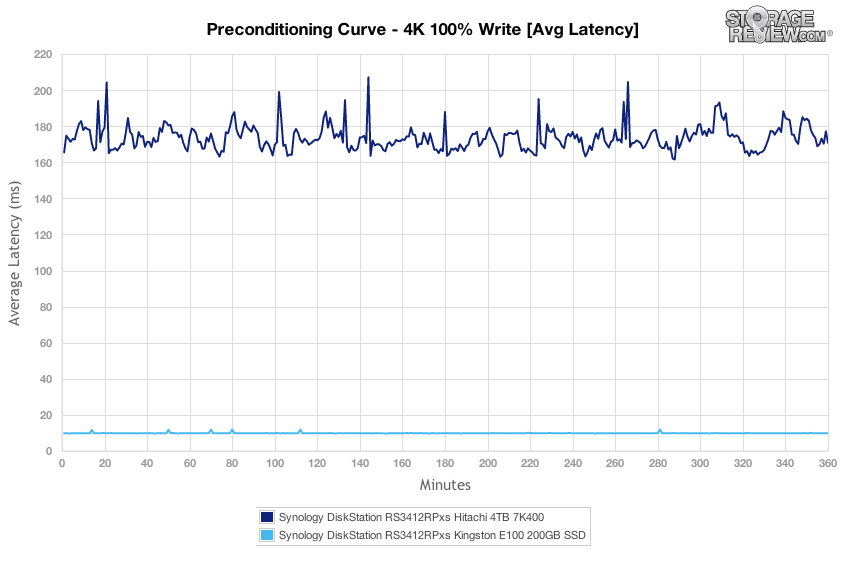
Comparing average latency between the two configurations, we measured an average latency of 165 to over 200ms from the hard drive array, while the SSDs measured about 9.8ms with a 16T/16Q load.
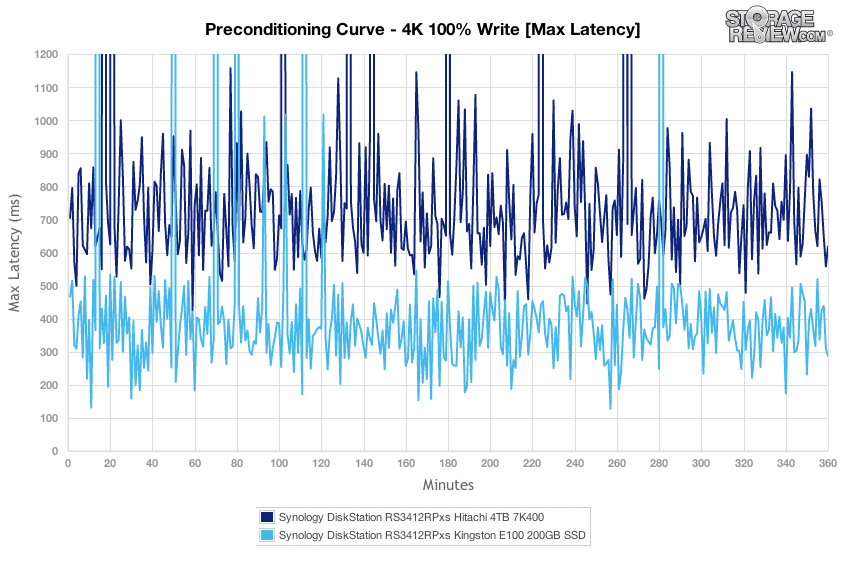
Over the 100% 4K random write preconditioning stage, we measured max latency ranging in bulk from 200-500ms using SSDs while our HDD array measured in bulk from 500-1000ms.
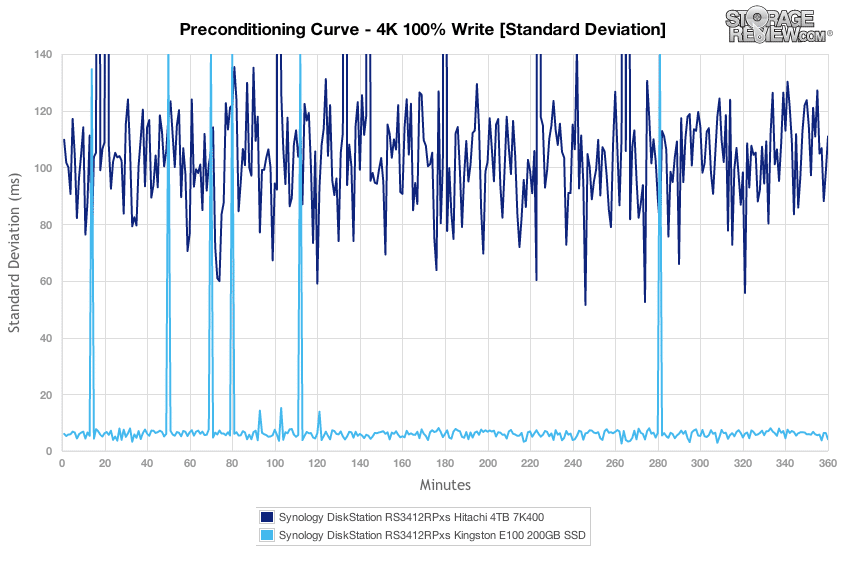
With a heavy effective queue depth of 256, latency consistency from the SSD array measured much greater than the hard drives, although that isn’t too surprising given the performance differences between the two drives types.
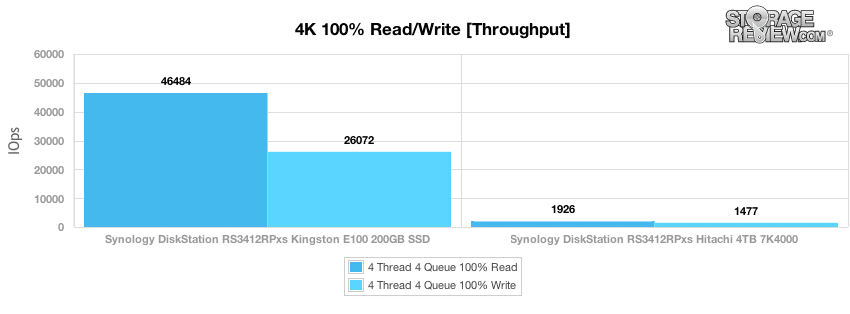
After our 6 hour preconditioning stage had finished, we took a longer performance sample from both the SSD and HDD configuration inside the Synology RackStation RS3412RPxs with a load of 16T/16Q. With 100% random 4K read activity, we measured 46,484 IOPS from the SSD array and 1,926 IOPS from the HDD array. Switching to 100% random 4K write activity, we measured 26,072 IOPS from the SSD array and 1,477 IOPS from the HDD array.
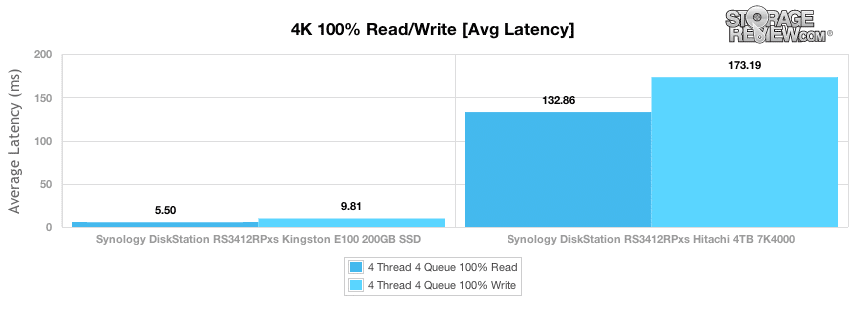
Average latency with 100% random 4K read activity and an effective queue depth of 256 measured 5.5ms from the SSD array and 132ms from the HDD array. With write activity, latency increased to 9.81ms with SSDs to 173ms with HDDs.
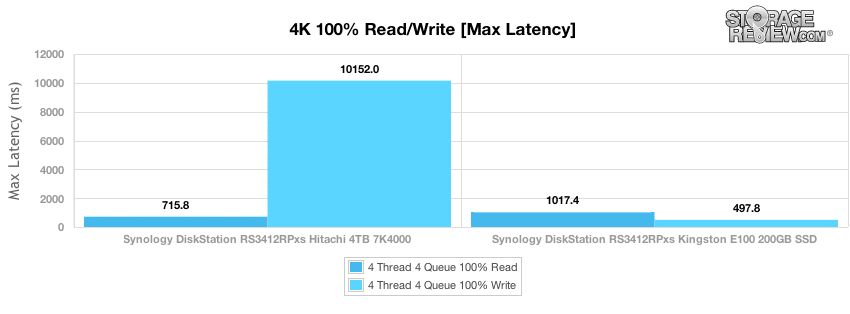
Under a heavy load of 16T/16Q, the max latency from the HDD RAID10 array measured 715ms read and 10,152ms write. The SSD RAID10 array in the same environment measured 1,017ms read and 479ms write.
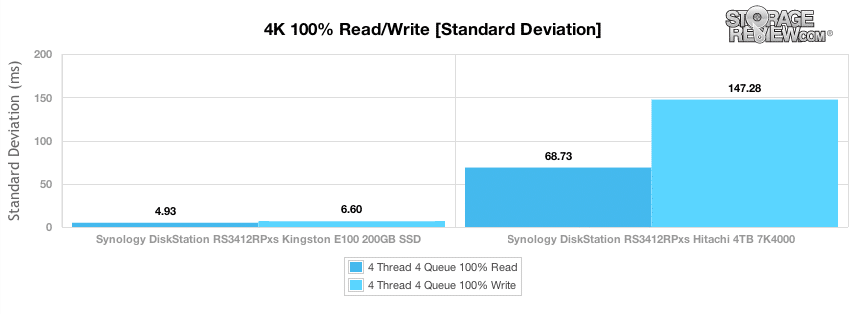
Latency consistency with a fully random 4K workload was excellent on the SSD array, while the hard drive array had more variation, especially with write activity.
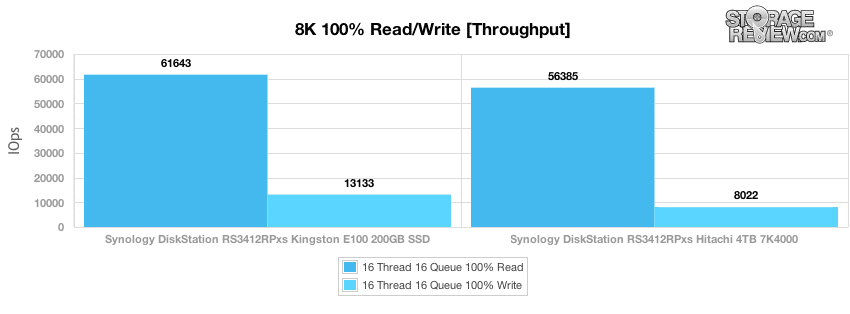
Our next workload measures 100% 8K sequential throughput with a 16T/16Q load, putting both the hard drives and SSDs on near equal ground. In this setting the SSDs measured 61,642 IOPS in 8K sequential read activity, while the hard drives trailed behind with 56,385 IOPS over two 10GbE connections with MPIO. 8K sequential write activity was lower measuring 13,133 IOPS while the hard drive array measured 8,022 IOPS.
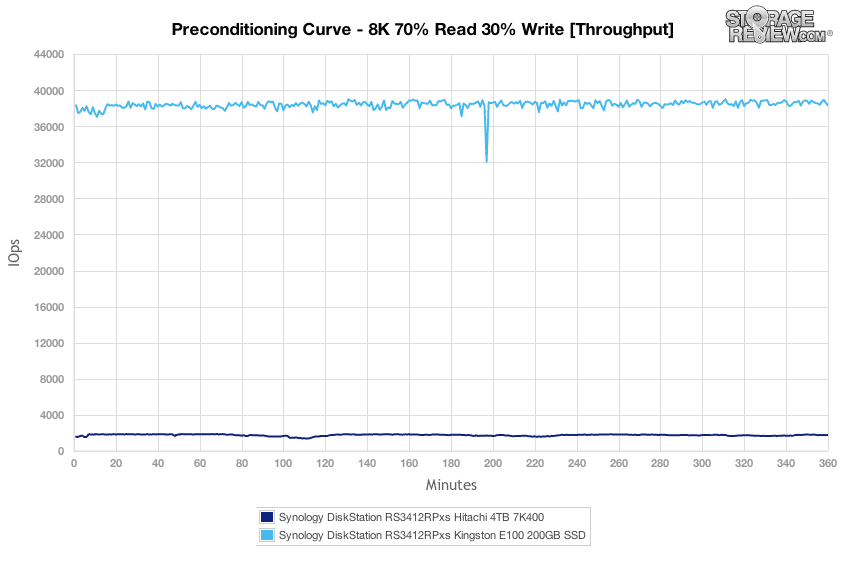
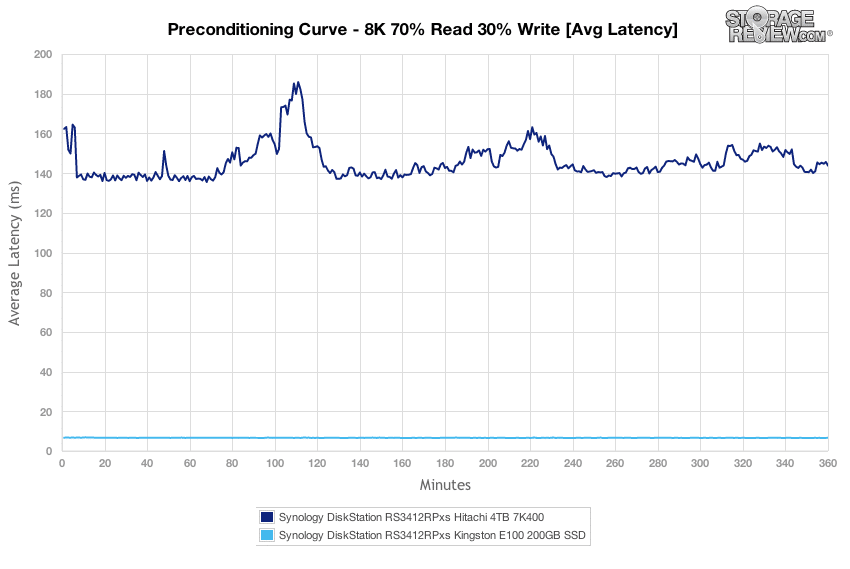
Our next workload keeps the 8K transfer size, but switches to a full random workload with a 70/30 R/W mix. In this workload during the preconditioning stage, the SSD array measured around 38,000 IOPS over the course of the test, while the HDD array measured about 1,800 IOPS.
Comparing average latency between each array time, the SSDs came in around 6.6ms over the duration of the test, while the HDD array fluctuated between 140ms to above 180ms over the preconditioning process.
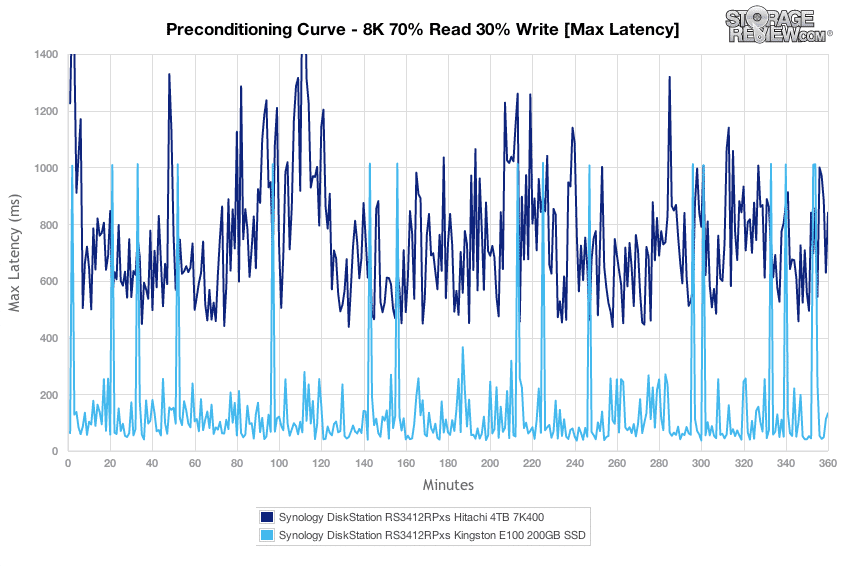
In our 8K 70/30 profile, the max latency output over our preconditioning stage had the bulk of the peak latencies from the SSD array measuring between 100-200ms while the HDD array came in higher at 500-900ms.
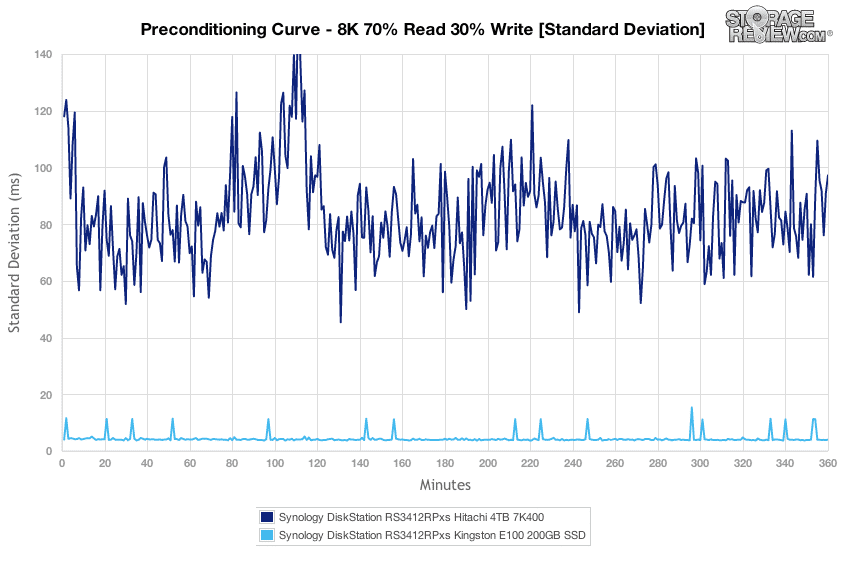
Diving into latency consistency in our 8K 70/30 test, there was a clear advantage of the all-flash array inside the RackStation compared to the platter array. The SSD array also fluctuated less over the course of our 6 hour test.
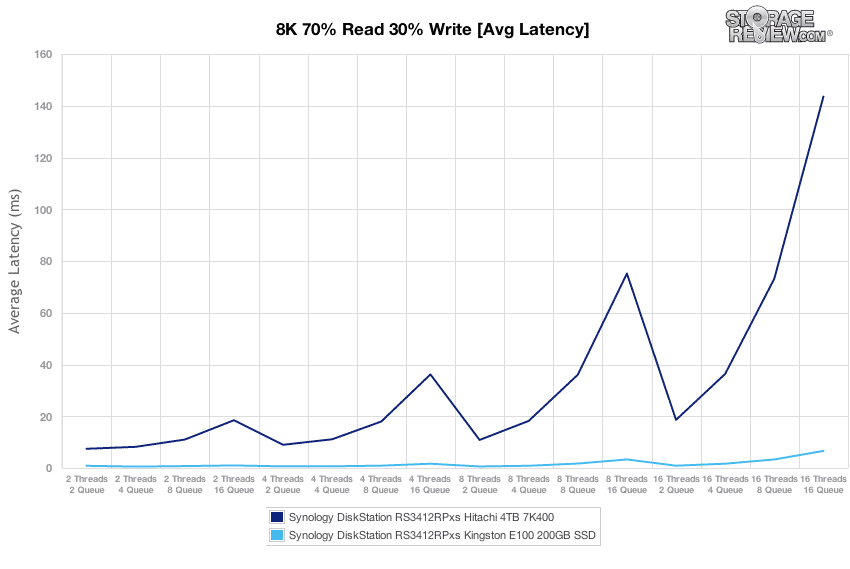
After the preconditioning stage had completed with a constant load of 16T/16Q, we dropped into our main test where we scaled the workload from 2T/2Q up to 16T/16Q. From a low load the SSD array scaled from 4,677 IOPS up to 38,708 IOPS at its peak (reached at QD32 and above). The 7,200RPM hard drive array by comparison scaled from 537 IOPS up to 1,782 IOPS at its peak (which it was able to hit at QD32 and above as well).
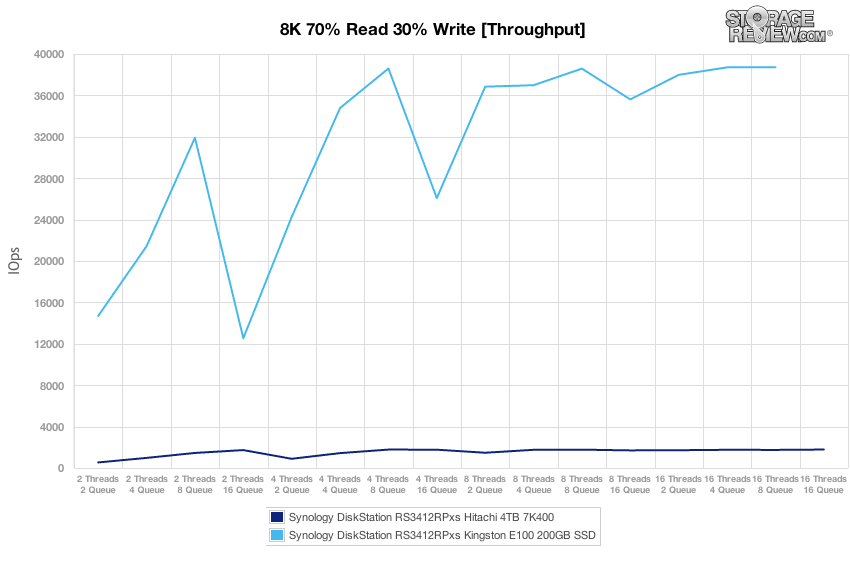
Comparing average latency from both disk configurations, the SSD array supported greater speeds and lower latency even at much greater effective queue depths. The hard drives array offered optimal performance, with its lowest latency, at QD16 and below.
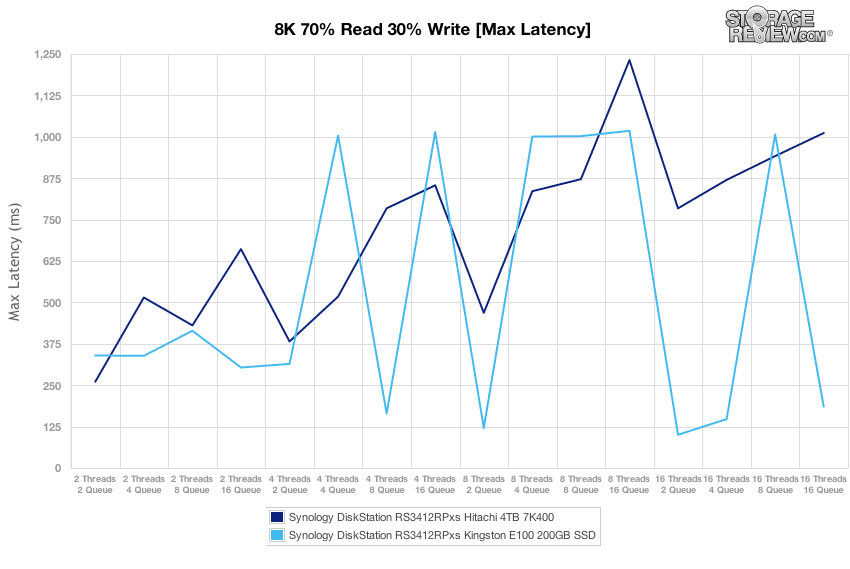
Peak latency in our 8K 70/30 showed similar max latency between each array-type, although the HDD array had growing response times as the effective queue depth increased.
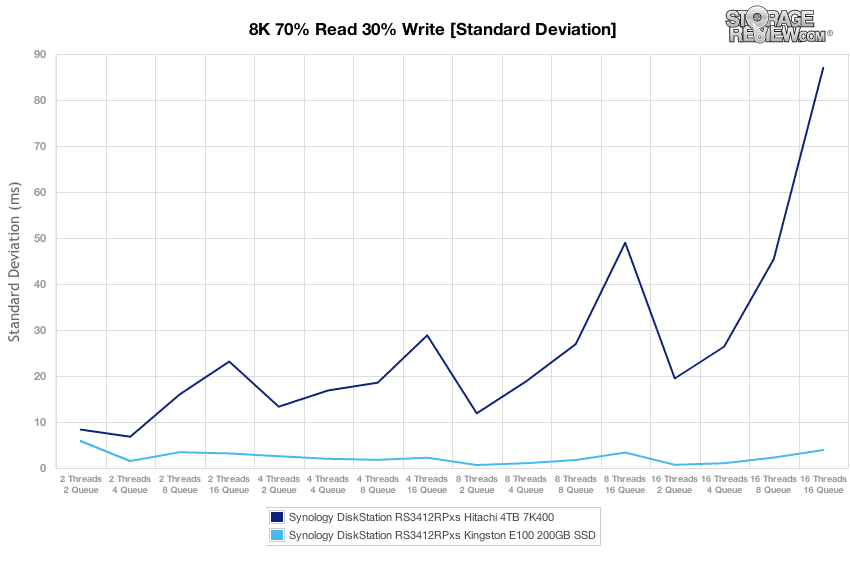
Comparing latency consistency between the platter and flash disk configurations, the SSD configuration remained stable across the entire thread/queue range, while the HDDs offered their optimal standard deviation at QD16 and below.
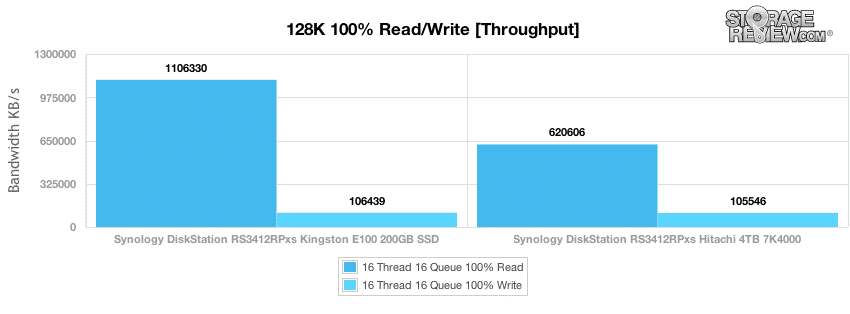
Our next workload measures sequential 128K transfer speed with a 16T/16Q workload also tested over a twin 10GbE MPIO connection. In this test we measured read speeds of 1.1GB/s from the RS3412RPxs with SSDs and 620MB/s from the system with HDDs. The write speeds we measured from both array types were roughly the same, with a write speed of 106MB/s from the SSD array and 105MB/s from the HDD array.
Our next test looks at a File Server workload, with a 512-byte to 64KB transfer spread with an 80/20 Read/Write ratio. With a 16T/16Q load and an effective queue depth of 256, the SSD array averaged about 25,500 IOPS while the HDD array measured slightly over 1,000 IOPS.
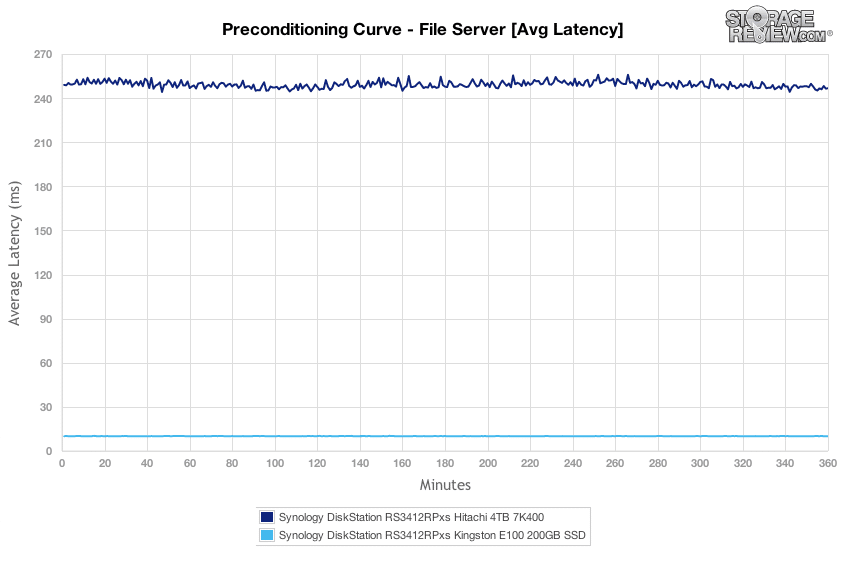
Looking at average latency in our File Server preconditioning test, the SSD array measured just over 10ms, while the HDD array came in at 250ms.
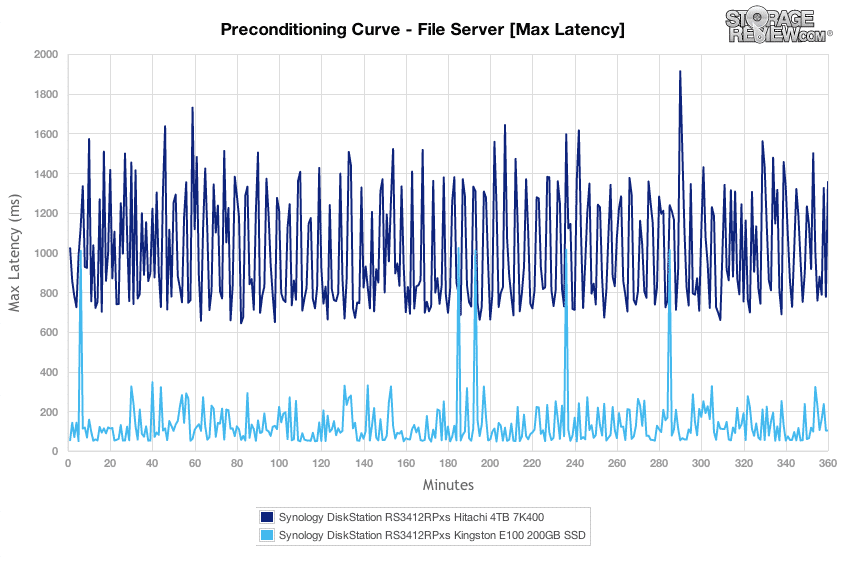
With a larger transfer spread the peak response times of the SSD array came in measuring between 50-250ms, while the HDD array had a wider and higher spread between 700-1,400ms.
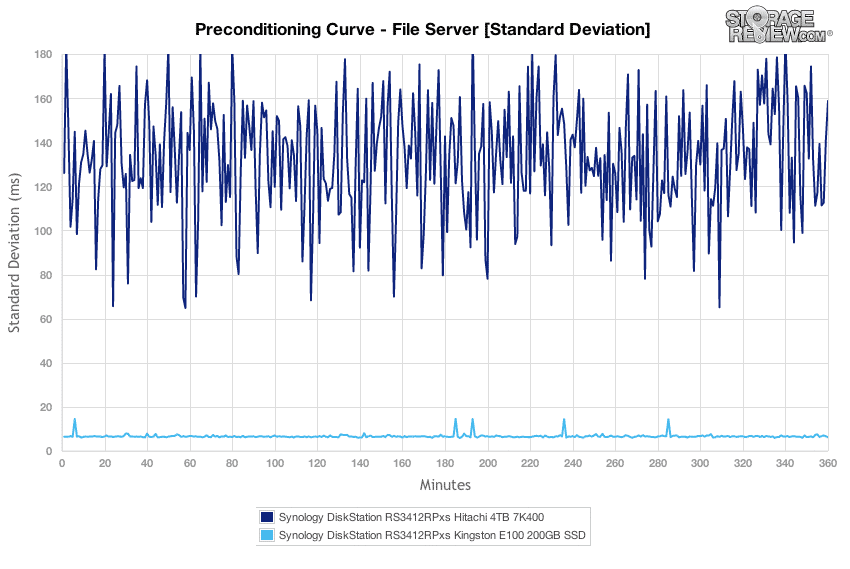
Comparing latency consistency between the flash and platter drives, the HDD array had higher standard deviation with this workload than it did with the 8K 70/30 workload. The SSD array also had higher standard deviation, but the impact wasn’t as severe.
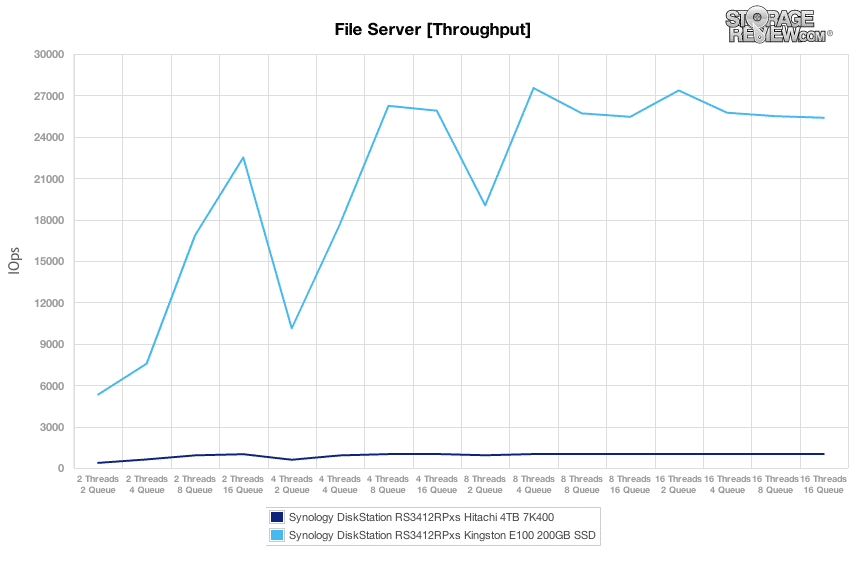
After our 6 hour preconditioning stage had finished, we dropped into the main section of our test where we scale the load from 2T/2Q to 16T/16Q. At a 2T/2Q load the SSD array measured 5,323 IOPS while the HDD array measured 371 IOPS. At the loads the scaled up, the HDD array peaked at 1,018 IOPS while the SSD array peaked much higher at 27,532 IOPS at 8T/4Q.
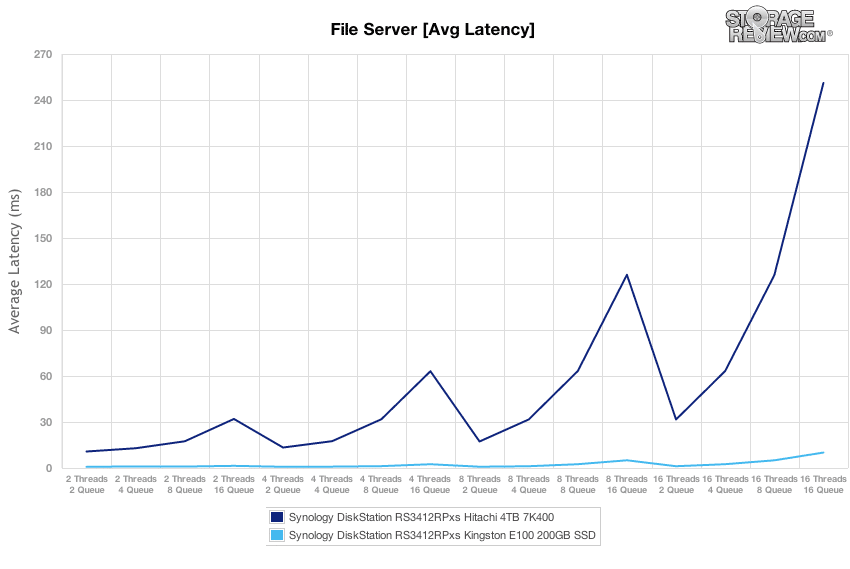
Average latency from the HDD array scaled from 10.75ms at 2T/2Q upwards to 251ms at 16T/16Q. The SSD array on the other hand offered an extremely low latency of 0.74ms at 2T/2Q rising to 10.07ms at 16T/16Q.
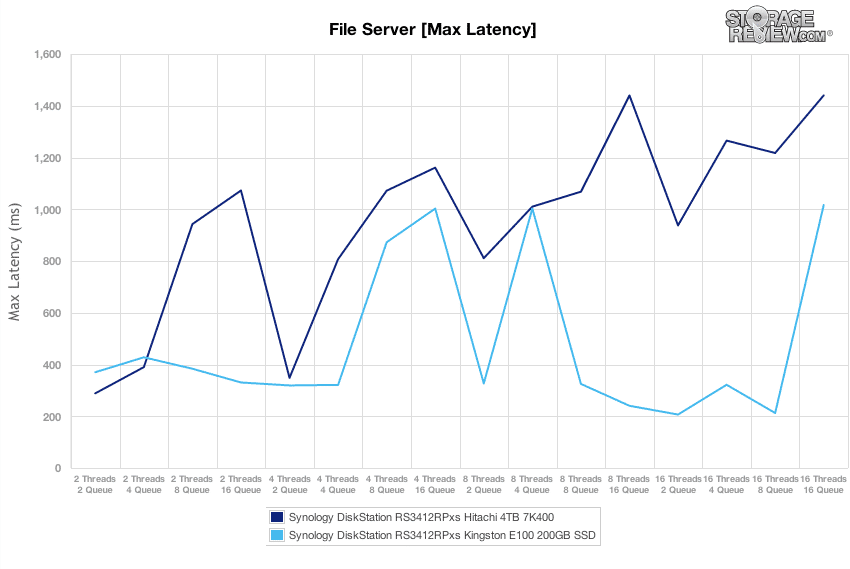
Comparing peak latency from each array type, both configurations had max latency increase as the effective queue depth increased, although the HDDs progressively got higher at each higher level.
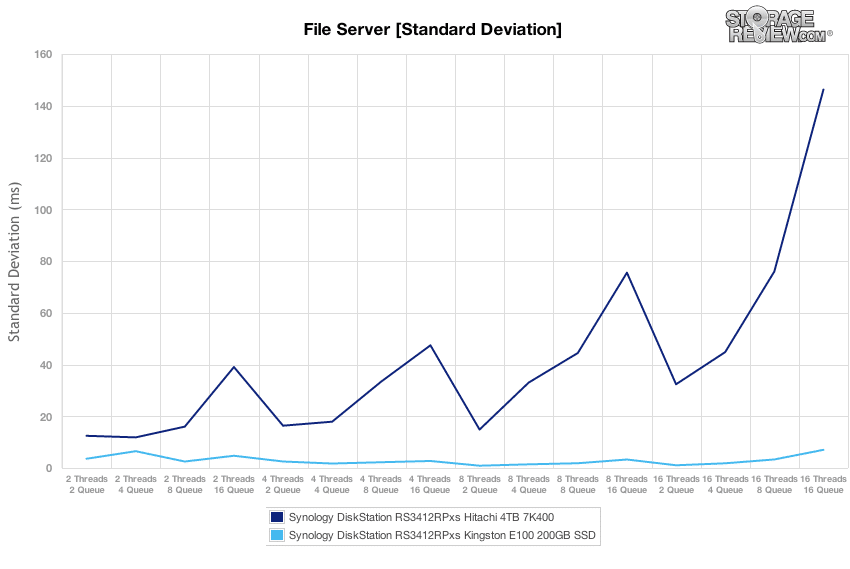
Switching to latency standard deviation, the consistency of the HDD array was at its best at effective queue depths at or below QD16. The SSD array maintained itself much better, coping easily as loads increased.
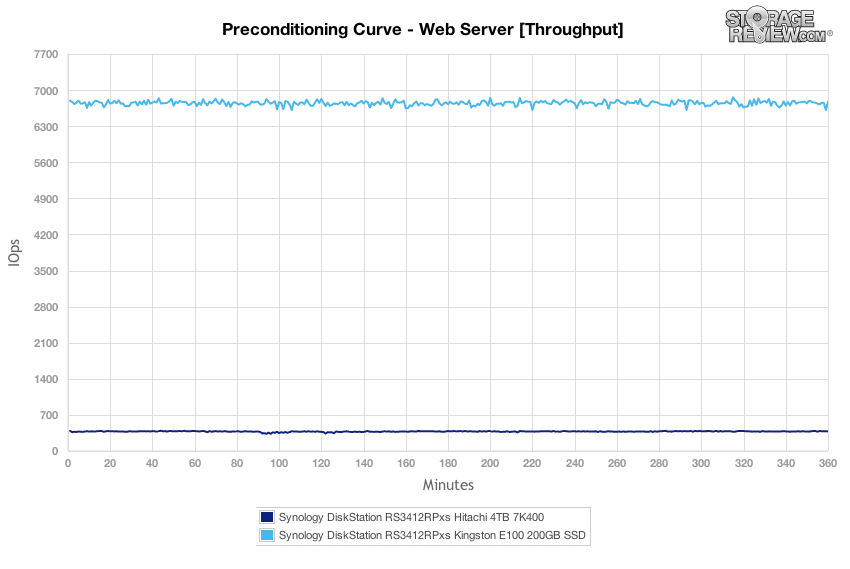
In our last synthetic workload covering a Web Server profile, which is traditionally a 100% read test, we apply 100% write activity to fully precondition each drive before our main tests. In this write-heavy workload, the SSD array measured around 6,700 IOPS while the HDD array came in with about 380 IOPS.
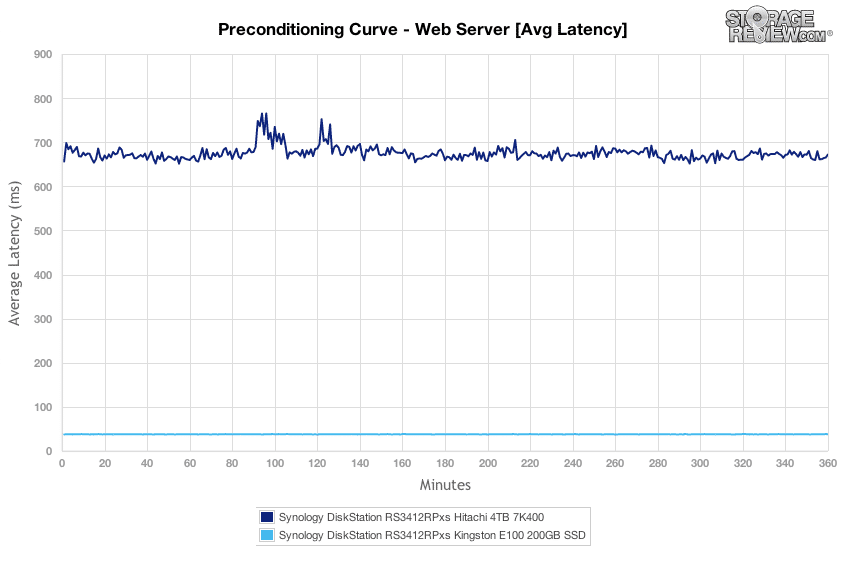
Comparing average latency, the HDD array measured just below 700ms with a few blips, while the SDD array ran much smoother with an average response time of around 38ms.
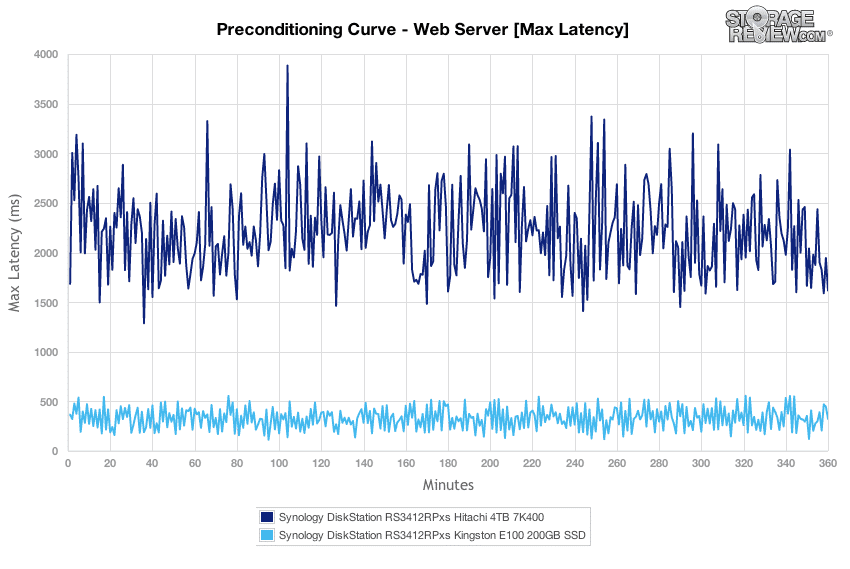
Comparing peak latency between the two different array types, the HDD array had max latency in a band between 1,500-3,000ms while the SSDs were much lower and tighter with a band between 200-500ms.
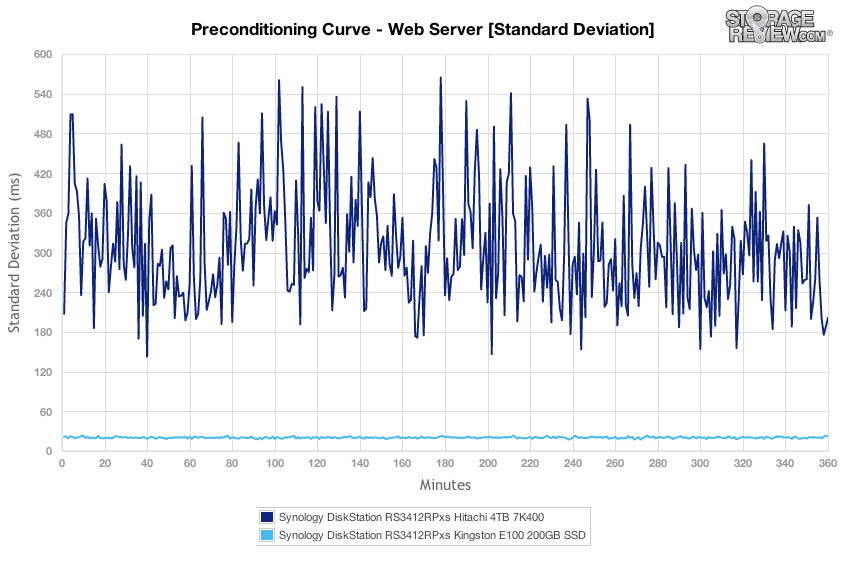
Looking at latency standard deviation in our Web Server preconditioning stage, we noted great consistency in our RAID10 SSD array, while the HDD array had more variation under its heavy 100% write workload.
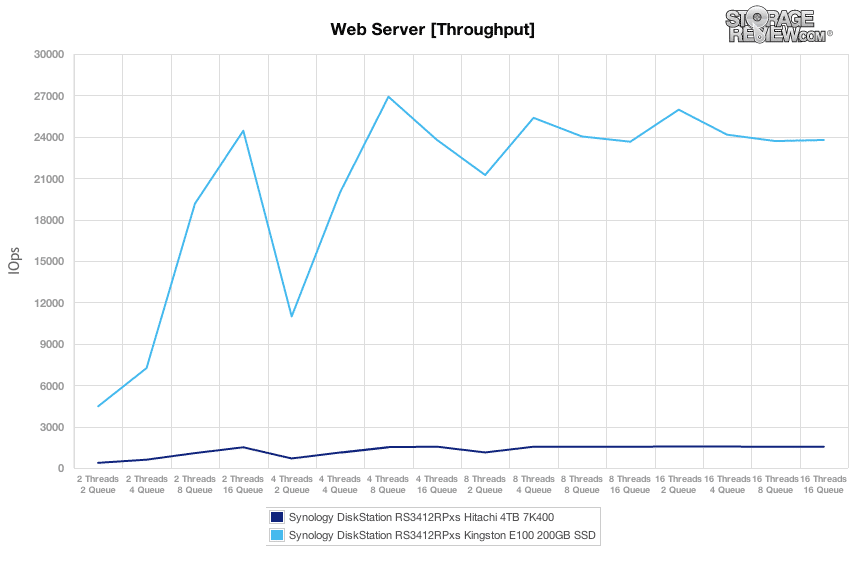
Switching to the main segment of our Web Server test with a 100% read profile, we saw performance scale from 374 IOPS at 2T/2Q up to 1,544 IOPS at 16T/16Q from the HDD array. The 10-drive SSD array scaled much higher, starting at 4,470 at 2T/2Q and peaking at 26,905 IOPS at 4T/8Q.
Comparing average latency, we noticed response times ranged from 10.67ms at 2T/2Q and increasing to 165ms at 16T/16Q from the HDD array. The SSD array offered sub-1ms latency, scaling from 0.891ms at 2T/2Q and increased to 10.7ms at 16T/16Q.

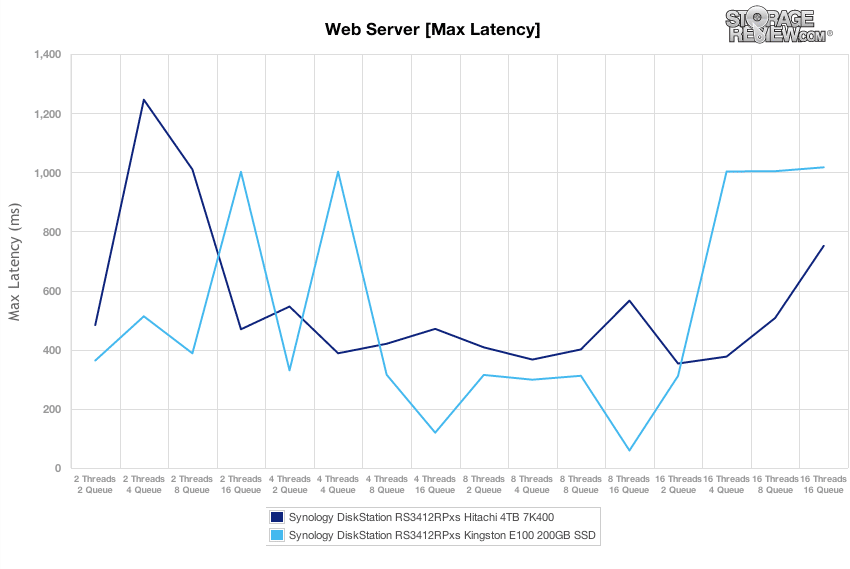
Comparing peak response times between the type different array builds, we noticed higher latency peaks from the SSDs as the effective queue depth increased, where the hard drives started high and then slowly stabilized as the test increased in load before rising again.
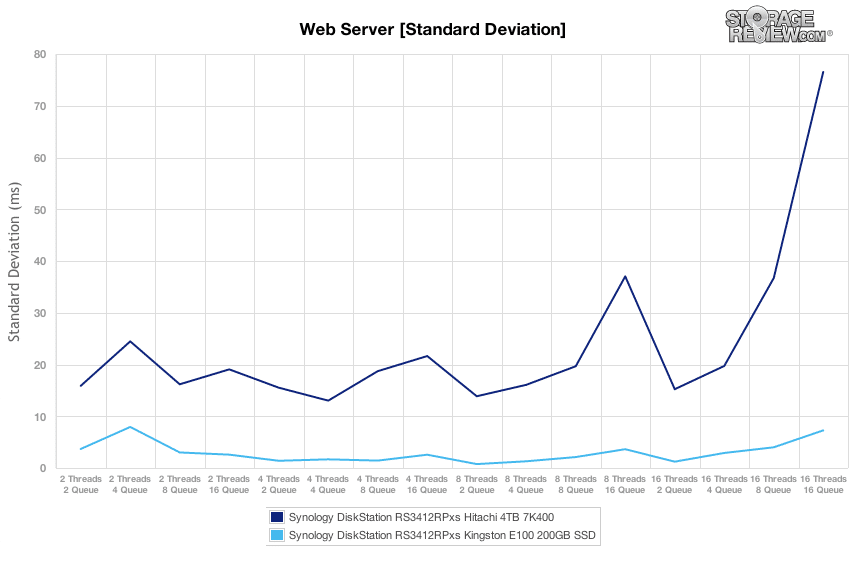
In our last chart comparing standard deviation between the HDD and SSD arrays on the Synology RackStation, both the hard drives and SSDs say slightly worse consistency at 2T/4Q before stabilizing more as the test continued.
Conclusion
The Synology RackStation RS3412xs/RS3412RPxs takes the easy to use DSM software and layers it on top of a rack-friendly 2U NAS that supports up to 40TB of storage natively and merges it with fast hardware to push upwards of 100,000 IOPS when used with flash. For small businesses who find their data needs growing due to sheer capacity demands or through virtualized environments and are familiar with rack-based solutions, the RS3412xs and the redundant power RS3412RPxs brother are pretty compelling solutions. While not Synology’s highest-end rack units, they are still quite capable as we saw, driving good to great performance with both Hitachi Ultrastar 7K4000 hard drives and Kingston E100 enterprise SSDs.
The RS3412xs family starts at $3,000 without drives, making the unit very affordable in the small to medium business category. While some may prefer to buy a single storage solution with disks installed, Synology gives their customers flexibility, letting them populate the RackStation with just a few drives to start if they wish, growing the drive count and capacity as data needs grow. For heavily-virtualized businesses with more I/O pain, the RackStation showed great performance with flash drives, peaking at 38,000 IOPS in our 8K 70/30 mixed workload over a 10GbE interface. While capacity would be limited, businesses looking to add fixed-tier flash storage to their network could affordably use two or more SSDs for certain applications and populate the rest of the RackStation with HDDs for bulk storage. When considering the high I/O potential the RackStation RS3412xs/RS3412RPxs offers in the sub-$10,000 segment loaded with disks, it’s hard to find a competitor that comes close in performance or price.
Pros
- Brings a gorgeous and easy to use interface into the SMB space
- Extremely fast when populated with SSDs
- Supports 10GbE connectivity with the performance to make use of it
Cons
- No SSD caching support in this model
- $1,000 price premium for power redundancy
Bottom Line
The Synology RackStation RS3412xs/RS3412RPxs offers an easy to use interface for SMBs or branch/remote offices that need enterprise-grade storage without the often-found enterprise-grade complexity and expense.
Synology RS3412xs/RS3412RPxs at Amazon.com

 Amazon