

With a lovely supply of AMD Genoa-X CPUs in the lab, we set out to see if we could effectively build the most powerful workstation ever. With essentially a limitless budget thanks to partners who supplied the equipment, we submit the results of many weeks of labor, the ultimate AMD Genoa-X workstation.
Before we even get started, this is a $30K+ build at the time of this review; prices have come down a good bit since we started. Also, we recognize that we’re calling this a workstation when really it’s an upright server with a server CPU, DDR, and some of the storage. All that aside, this rig may be a splendid alternative for professionals who want more than what’s available off the rack.
AMD Genoa-X Workstation Foundation – TYAN Transport HX FT65T-B8050
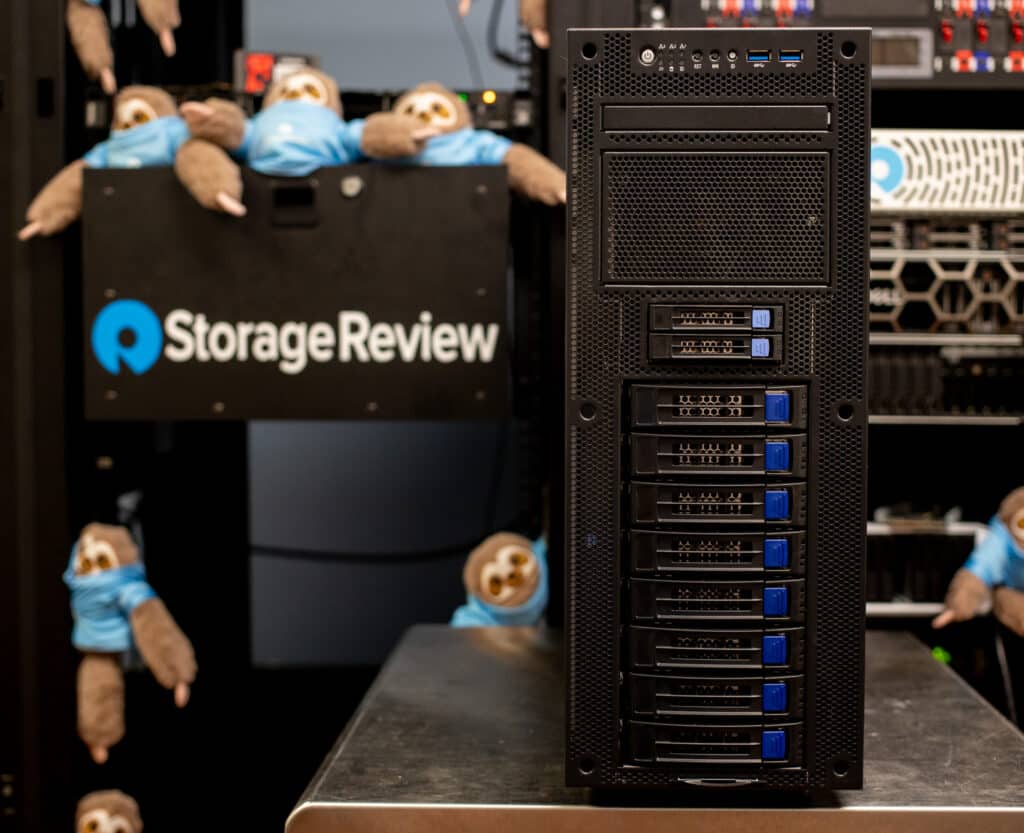
The TYAN Transport HX FT65T-B8050 is a “deskside server” (as Tyan calls it) that promises users an impressive combination of performance and versatility. They aren’t kidding because this system can fit a ridiculous amount of storage devices and supports a range of CPUs with multiple GPUs.
At its heart lies a single-socket AMD EPYC 9004 Series Processor, focusing on performance. Users will also benefit from 8 DIMM slots compatible with DDR5 4800 memory to help ensure swift and lag-free data processing. Regarding its GPU support, the FT65T-B8050’s design allows for two double-width x16 and two single-width x16 GPU cards.
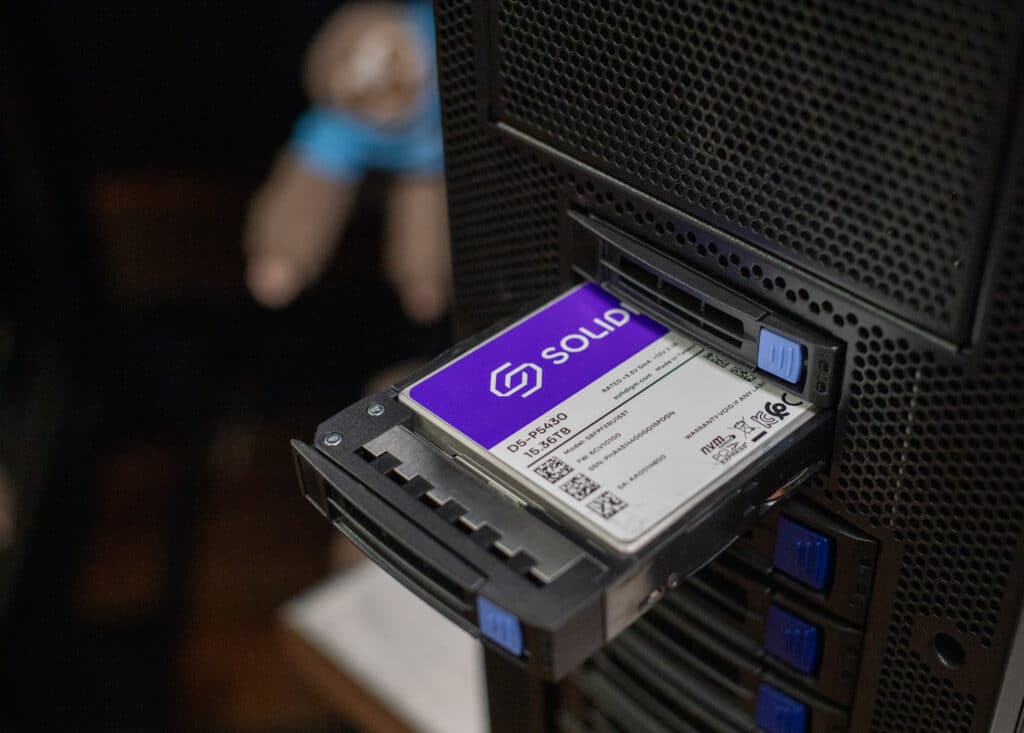
One of the most essential features of this server is its comprehensive storage. It comprises eight 3.5″ SATA and 2 NVMe U.2 hot swap, tool-less drive bays (located and stacked vertically on the front panel). Two NVMe M.2 22110/2280 slots are also on the motherboard to add to its capabilities.
The model we are looking at is the “-2T”, which is distinct in its configuration and is particularly well-suited for high-bandwidth applications. It comes fitted with two 10GBase-T ports, which allow for faster data transmission speeds. In comparison, the other two models have a more basic configuration with just two 1000Base-T ports and one IPMI, making the -2T variant a more robust choice for demanding applications.
Tyan Transport HX FT65T-B8050 Specifications
| System | Form Factor | 4U Tower |
| Chassis Model | FT65T | |
| Dimension (D x W x H) | 25.5” x 16.8” x 6.9” (650 x 427 x 176mm) | |
| Motherboard Name | S8050GM4NE-2T | |
| Board Dimension | CEB, 12″x10.5″ (305x267mm) | |
| Front Panel | Buttons | (1) ID / (1) PWR w/ LED / (1) RST |
| LEDs | (1) HDD / (1) ID / (2) LAN / (1) System Event | |
| I/O Ports | (2) USB 3.0 ports + (1) RJ-45 / (1) COM Port / (1) VGA port / (4) Standalone RJ-45 | |
| External Drive Bay | Q’ty / Type | (2) 2.5″ Hot-Swap NVMe HDD/SSDs / (8) 3.5″ Hot-swap HDD/SSDs |
| Front Drive Bay Interface | (2) SATA 6Gb/s / NVMe / (8) SATA 6Gb/s / SAS 12Gb/s | |
| Front HDD Backplane Support | SAS 12Gb/s /SATA 6Gb/s /NVMe | |
| Notification | The SAS/SATA HDD backplane is connected to onboard SATA connection by default. Please contact Tyan technical support if a discrete SAS HBA/RAID adapter is required. | |
| System Cooling Configuration | FAN | (2) 8038 exhausted fans module at rear / (3) easy-swap 12038 fans |
| Power Supply | Type | ATX |
| Input Range | AC 100~240V/15~12A | |
| Frequency | 50-60 Hz | |
| Output Watts | 1,200 Watts (100-115Vac input) / 1,500 Watts (115-200Vac input) / 2,000 Watts (200-240Vac) | |
| Efficiency | 80 plus Gold (200-240Vac) / 80 plus Platinum (100-200Vac) | |
| Processor | Q’ty / Socket Type | (1) AMD Socket SP5 |
| Supported CPU Series | (1) AMD EPYC™ 9004 Series Processor | |
| Thermal Design Power Wattage | Max up to 320W (cTDP) | |
| Memory | Supported DIMM Qty | (8) DIMM slots |
| DIMM Type / Speed | RDIMM DDR5 4800 MHz (1DPC) / 3600MHz (2DPC) / 3DS RDIMM DDR5 3600MHz (2DPC) | |
| Capacity | Up to 2,048GB RDIMM/3DS RDIMM DDR5 4800/3600 memory | |
| Memory channel | 8 Channels per CPU | |
| Memory voltage | 1.1V | |
| Expansion Slots | PCIe | (5) PCIe Gen.5 x16 slots |
| Physical Dimension Abbreviation | FH/10.5”L (Full-height / 10.5” in length ): 4.4″ x 10.5″ (111.2 x 266.7mm) | |
| LAN | Q’ty / Port | (2) 10GbE ports + (2) GbE ports + (1) GbE dedicated for IPMI |
| Controller | Intel I210-AT / Intel X710-AT2 | |
| PHY | Realtek RTL8211F | |
| Storage SATA | Connector | (10) SATA |
| Controller | Direct from AMD EPYC CPU | |
| Speed | 6Gb/s | |
| RAID | N/A | |
| Storage NVMe | Connector (M.2) | (2) 22110/2280 (by PCIe Gen.4 interface) |
| Connector (U.2) | (2) 2.5″NVMe SSD | |
| Graphic | Connector type | D-Sub 15-pin |
| Resolution | Up to 1920×1200 | |
| Chipset | Aspeed AST2600 | |
| I/O Ports | USB | (2) USB3.0 ports (@ rear) |
| COM | (1) DB-9 COM port | |
| VGA | (1) D-Sub 15-pin port | |
| RJ-45 | (2) 10GbE ports + (2) GbE ports + (1) dedicated GbE for IPMI | |
| Button | ID Button | |
| TPM (Optional) | TPM Support | Please refer to our TPM supported list. |
| Interface | SPI | |
| System Monitoring | Chipset | Aspeed AST2600 |
| Temperature | Monitors temperature for CPU & memory & system environment | |
| Voltage | Monitors voltage for CPU, memory, chipset & power supply | |
| LED | Over temperature warning indicator / Over voltage warning indicator | |
| Others | Watchdog timer support | |
| Server Management | Onboard Chipset | Onboard Aspeed AST2600 |
| AST2600 iKVM Feature | 24-bit high-quality video compression / Supports storage over IP and remote platform-flash / USB 2.0 virtual hub | |
| AST2600 IPMI Feature | IPMI 2.0 compliant baseboard management controller (BMC) / 10/100/1000 Mb/s MAC interface | |
| BIOS | Brand / ROM size | AMI / 32MB |
| Feature | Hardware Monitor / FAN speed control automatic / Boot from USB device/PXE via LAN/Storage / Console Redirection / SMBIOS 3.0/PnP/Wake on LAN / ACPI sleeping states S0, S5 | |
| Operating Environment | Operating Temp. | 10° C ~ 35° C (50° F~ 95° F) |
| Non-operating Temp. | – 40° C ~ 70° C (-40° F ~ 158° F) | |
| In/Non-operating Humidity 90 | 90%, non-condensing at 35° C | |
| Regulation | FCC (SDoC) | Class A |
| CE (DoC) | Class A | |
| VCCI | Class A | |
| C-Tick | Class A | |
| Operating System | OS supported list | Please refer to our AVL support lists. |
| RoHS | RoHS 6/6 Compliant | Yes |
Ultimate AMD Genoa-X Workstation Build
The AMD Genoa-X Workstation is powered by the AMD Genoa-X 9684X, part of the company’s EPYC series of processors. These CPUs are highlighted by their vCPU density, delivering enhanced performance for AI applications and cloud-based tasks.
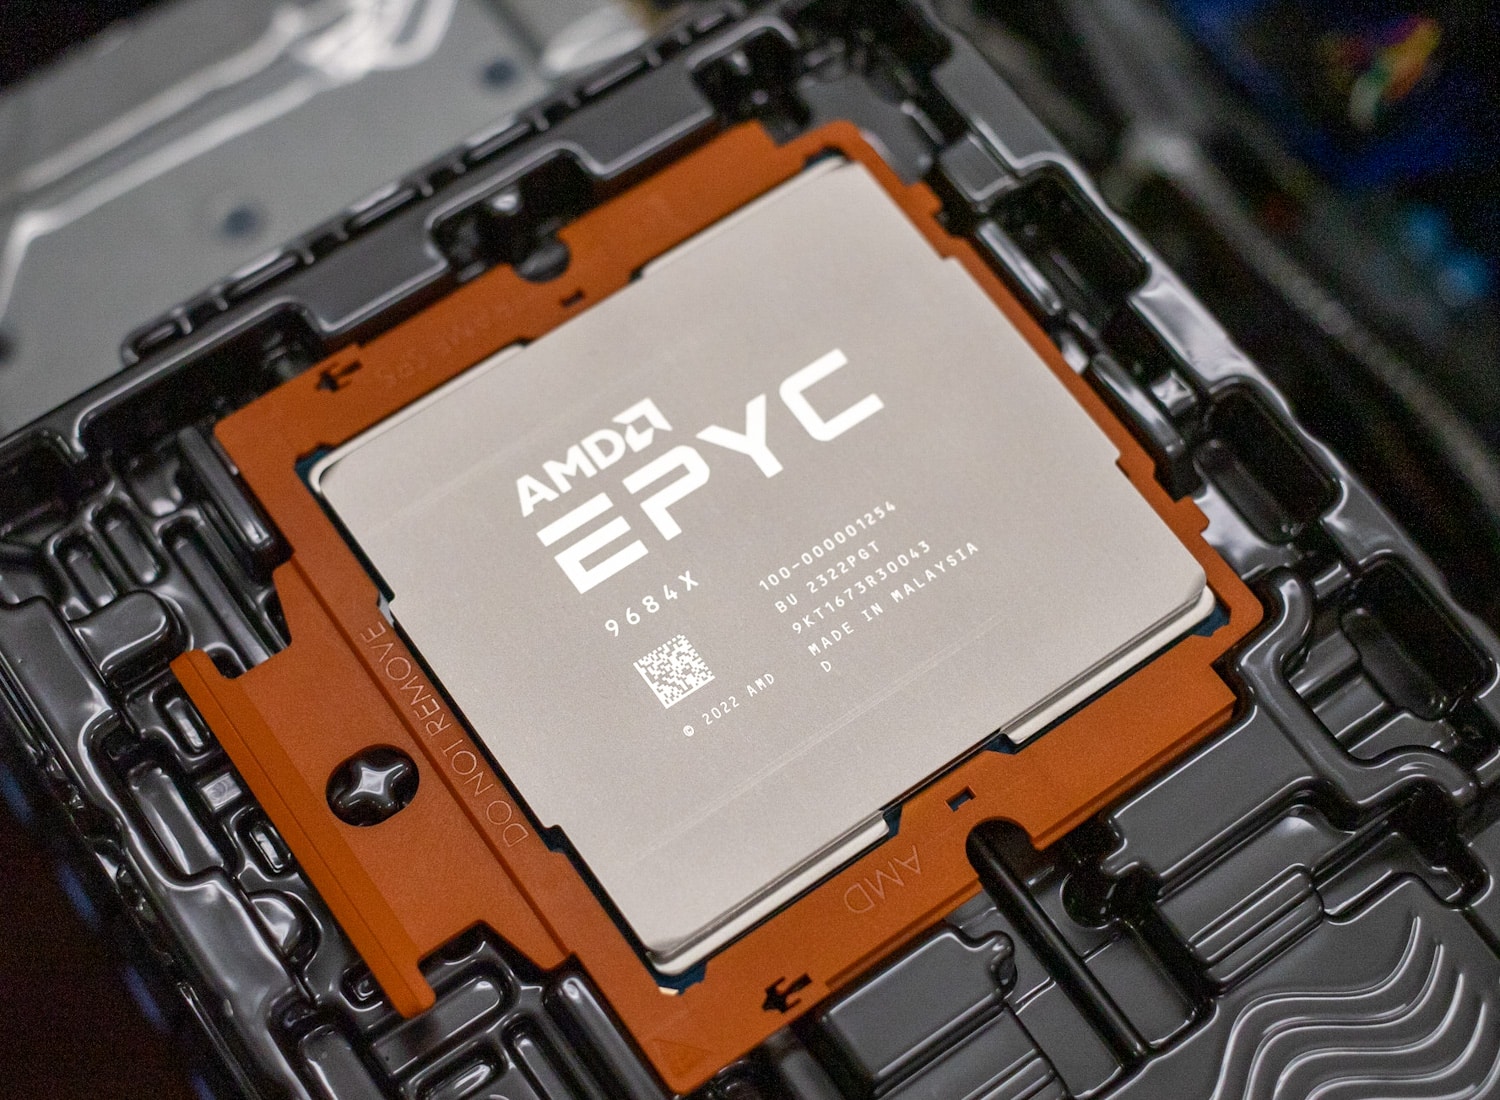
The EPYC 9684X runs AMD’s Zen 4 micro-architecture with AVX-512, 12-channel DDR5 memory, and a plethora of other advancements found within the EPYC 9004 series. With a whopping 96 cores, 192 threads, a 2.55 GHz base frequency, a 3.70 GHz boost frequency, and 1,152MB L3 cache, the 9684X indeed defines performance.
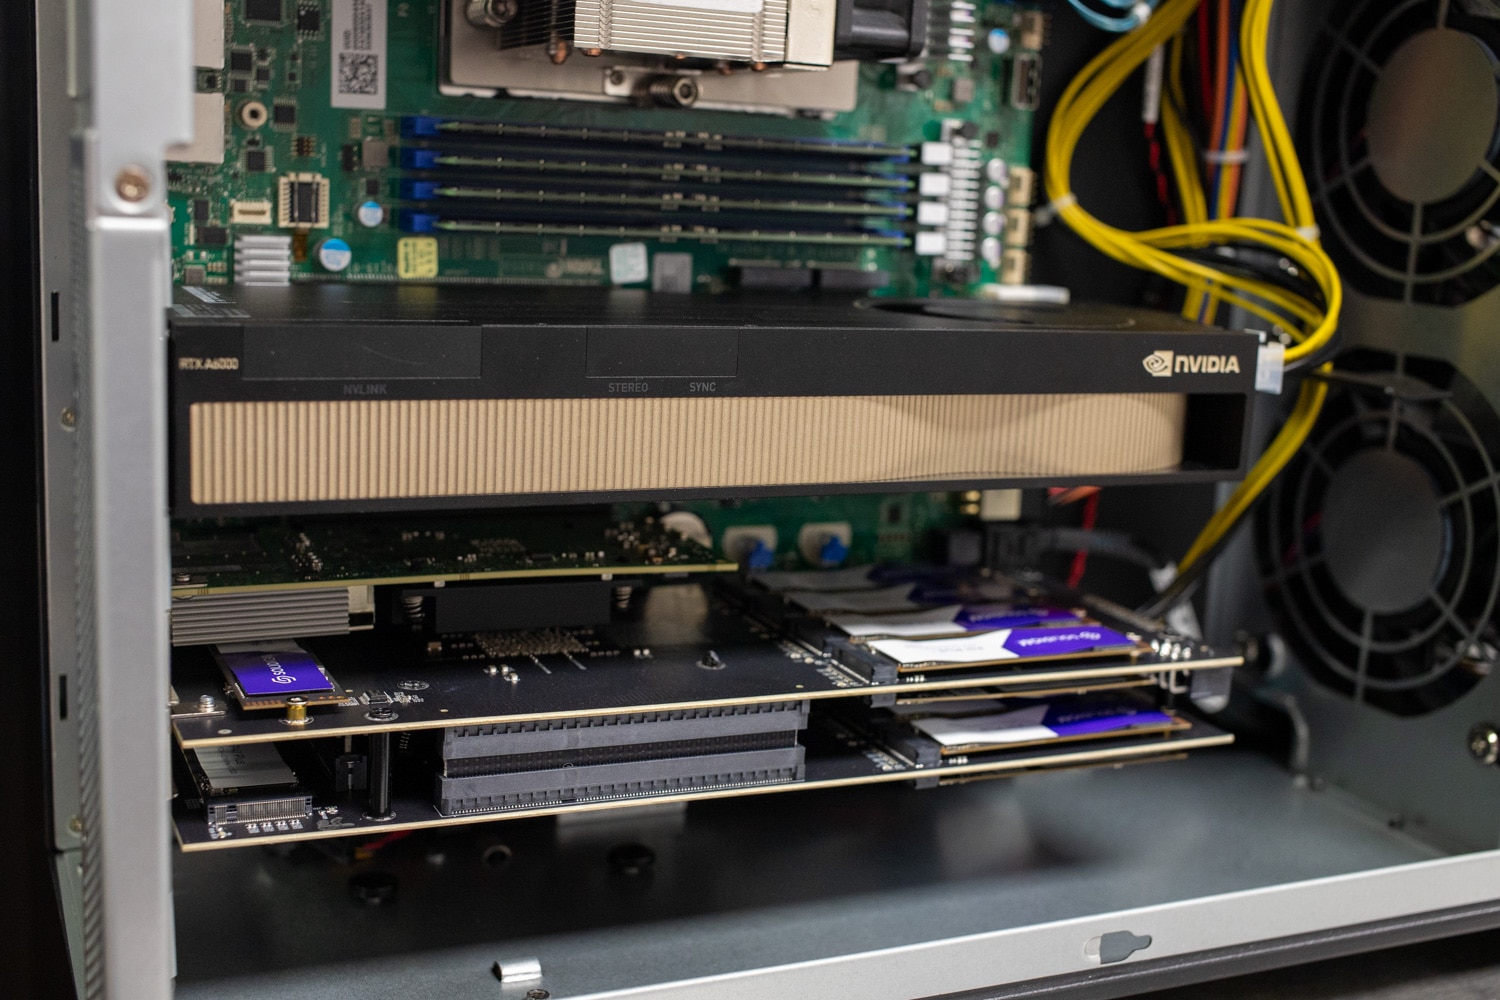
Complementing our computational power is the NVIDIA A6000 GPU. As one of the most formidable professional graphics cards available, the Ampere-based A6000 is equipped with a generous 48GB GDDR6 ECC memory and provides a variety of ports, including 4x DisplayPort 1.4a, positioning it as an invaluable asset for professionals requiring graphical power. The NVLink feature further enhances its potential by enabling a 2-way connection with another A6000, unlocking even more capabilities.
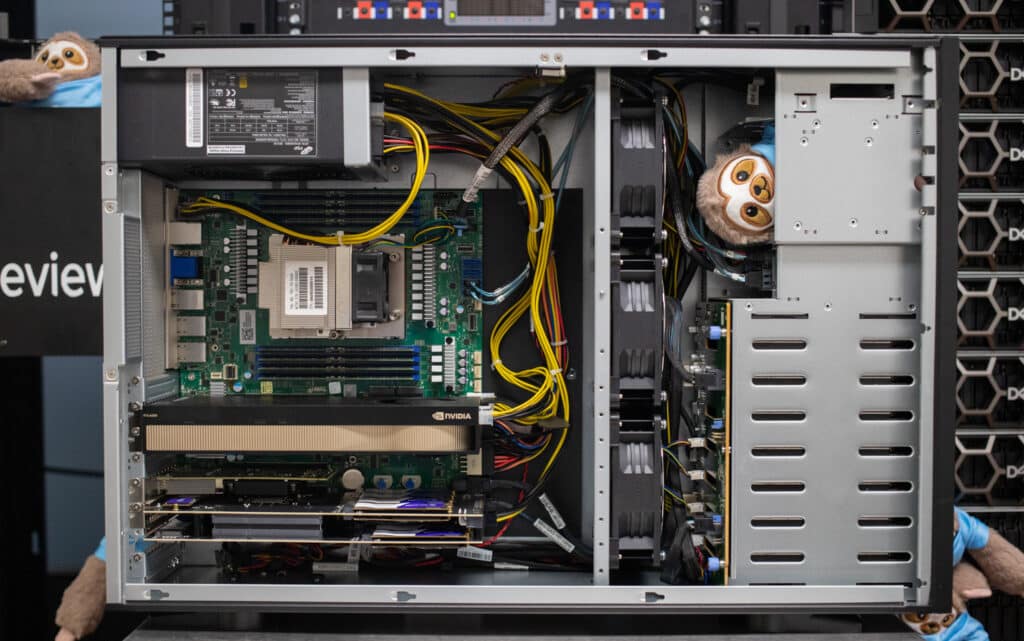
We’ve also installed 8 x 64GB Kingston DDR5-5600 Registered ECC DRAM modules (KSM56R46BD4PMI-64HAI). These modules are specifically designed to meet the stringent JEDEC standards, offering DDR5-5600 timing of 46-45-45 at 1.1V. Each of these 288-pin DIMMs sports gold contact fingers, ensuring optimal connectivity and signal transmission.
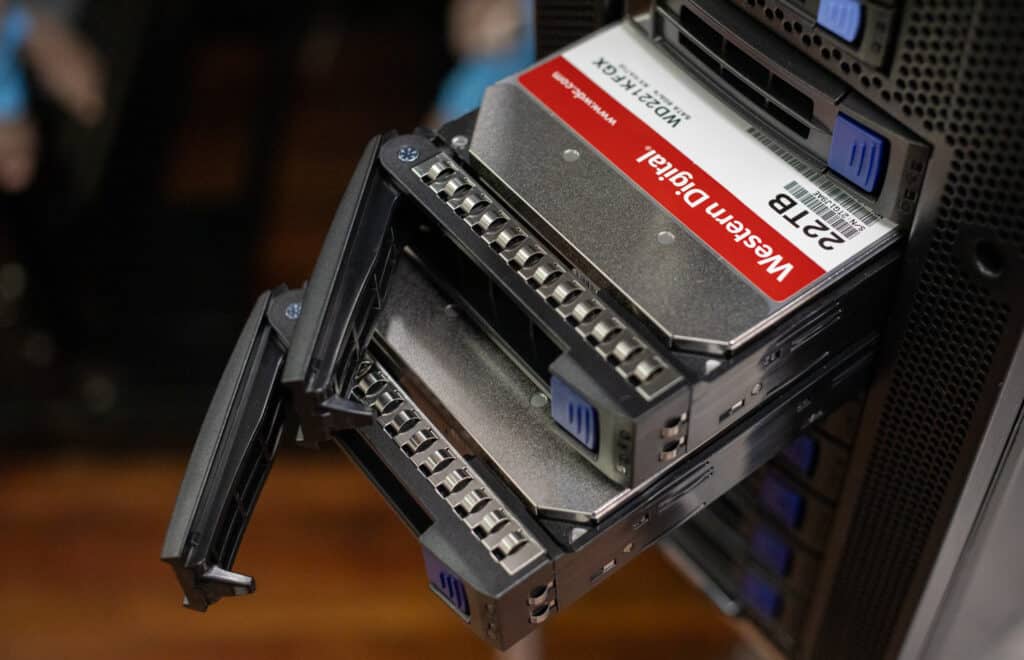
Below the panel board are all the toolless, hot-swappable drive bays. This includes two 2.5-inch HDD bays and eight 3.5-inch HDD bays, all stacked horizontally for easy access. A status and active LED lights accompany each bay to indicate if a drive is dynamic, rebuilding, or failing.
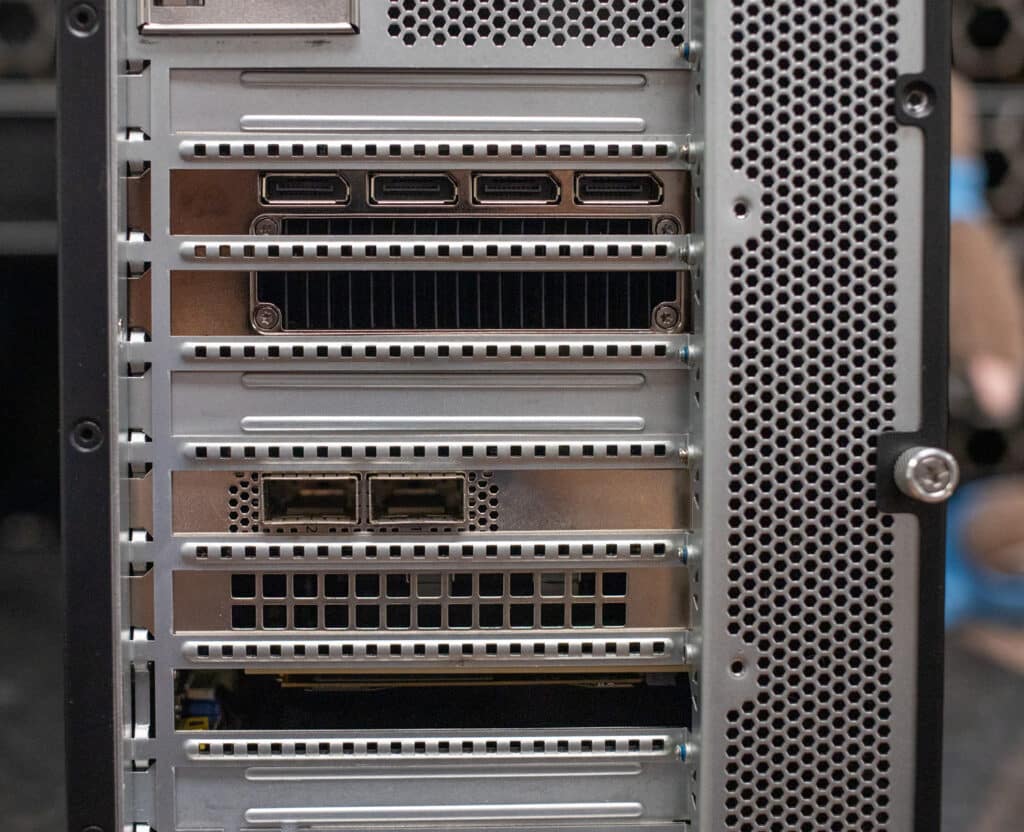
The rear panel of the workstation offers a range of connectivity and functionality. Anchoring the layout is the PSU (with options: 1,200 Watts (100-115Vac input) / 1,500 Watts (115-200Vac input) / 2,000 Watts (200-240Vac)), ensuring that more than enough power is delivered to the server’s components.
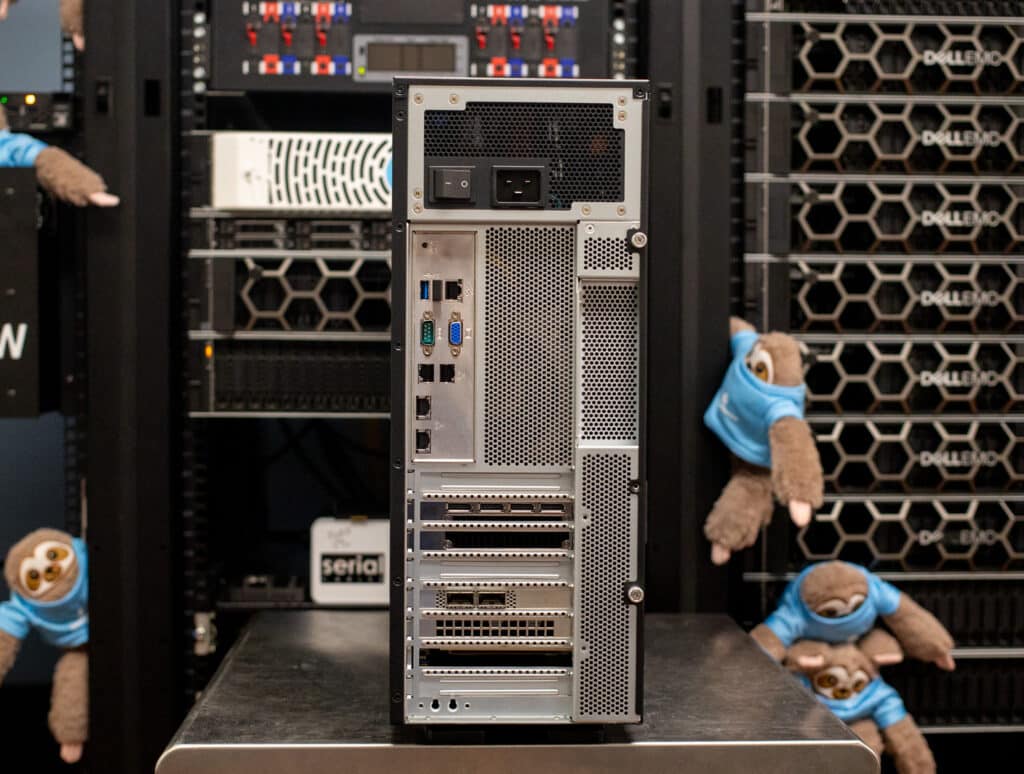
Multiple RJ45 LAN ports are located at the bottom middle part of the rear panel, with two LAN Ports designed explicitly for high-speed 10GbE connections, while the other two ports cater to the 1GbE traffic. Another LAN port is dedicated exclusively to IPMI for out-of-band management. Users also have a few USB 3.2 Gen1 ports for rapid data transfer and device connections, the usual VGA Port for visual output capabilities, and the COM Port for facilitating serial device communications. An ID Button is also on the rear panel for easy identification and system management.
Taking up most of the right side are three 80x80x38mm fans, helping the server with efficient heat dissipation and sustained server performance.
System Pricing
Estimated component pricing at the time of this review is as follows.
- Tyan bare-bones system: $4,000
- NVIDIA A6000: $4,800
- AMD Genoa-X 9684X: $13,000
- Kingston DDR5 RAM (KSM56R46BD4PMI-64HAI): $2200
- Solidigm P41 Plus (21x 1TB): $735
- WD Red Pro 8x 22TB: $3360
- Apex Storage x21 Card: $2,800
- Solidigm P5430 15.36TB: $1,050
Total price: $32,145
AMD Genoa-X Workstation Performance
To demonstrate the capabilities of the AMD Genoa-X Workstation, we put it through a series of rigorous performance tests designed to gauge its competence in processing, graphics, and overall suitability for a diverse range of applications. As such, benchmarking includes SPECviewperf 2020, SPECworkstation 3, Cinebench, geekbench, Blender OptiX, Luxmark, 7-Zip Compression, Blackmagic RAW Speed Test, and UL Procyon. We intend to shed light on its ability to handle tasks (spanning from graphics-intensive design to computational efficiency) so our readers can make an informed decision.
Our build has the following key specs:
- Windows 11 Pro
- AMD Genoa-X 9684X
- NVIDIA A6000
- 512GB Kingston DDR5-5600 Registered ECC DRAM modules (8 x 64GB / KSM56R46BD4PMI-64HAI)
- Apex Storage x21 Card w/ 21x Solidigm P41 Plus PCIe Gen4 SSDs
Benchmark Competitor Specifications
Our main comparable is the Precision 7865, the most recent Threadripper workstation to hit our lab. The Dell Precision 7865 is a top-tier enterprise workstation that excels in performance and versatility. With 64 CPU cores on a single chip, it offers a more economical and easier-to-manage solution than dual-CPU setups, delivering competitive results in enterprise benchmarks.
- Windows 11 Pro
- AMD Threadripper Pro 5995WX (64 cores, 128 threads)
- Nvidia A6000 (48GB)
- 64GB DDR4-3200 ECC (8x 8GB)
- 2x 1TB Gen4 SSD RAID0 (Dell Class 40)
In some benchmarks, we also compared the AMD Genoa-X Workstation to the powerful Dell Precision 7960, which was configured with the following specs:
- Windows 11 Pro
- Intel Xeon w9-3495X (56 Core/ 112 Threads)
- NVIDIA Ada Lovelace RTX 6000 with 48GB GDDR6 memory
- 128GB of DDR5 ECC Memory (4x32GB)
- RAID 0 with 2x 1GB M.2 2280 Class 40 SSD
We will also show the results of our initial AMD Bergamo/Genoa-X Review from July (specifically the Bergamo 9754 model – 1p/128c) in certain benchmarks, just for scale.
SPECviewperf 2020
Our first test is SPECviewperf 2020, the worldwide standard for measuring graphics performance of professional applications under the OpenGL and Direct X application programming interfaces. The viewsets (or benchmarks) represent graphics content and behavior from actual applications without having to install the applications themselves. The newest version of this benchmark went through significant updates late last year, including new viewsets taken from traces of the latest versions of 3ds Max, Catia, Maya, and Solidworks applications. In addition, they added support within all viewsets for both 2K and 4K resolution displays.
| SPECviewperf2020 Viewsets (Higher is better) | Transport HX FT65T-B8050 (AMD Genoa-X 9684X, NVIDIA A6000) | Dell Precision 7865 (AMD 5995WX, RTX A6000) | Dell Precision 7960 (Xeon w9-3495X, RTX 6000 Ada) |
| 3dsmax-07 | 137.15 | 140.79 | 218.62 |
| Catia-06 | 101.31 | 100.57 | 114.68 |
| Creo-03 | 141.58 | 137.39 | 128.74 |
| Energy-03 | 43.1 | 42.95 | 84.46 |
| Maya-06 | 341.36 | 334.18 | 424.08 |
| Medical-03 | 68.33 | 35.98 | 74.16 |
| Snx-04 | n/a | 453.83 | 932.85 |
| Sw-05 | 168.18 | 170.08 | 299.69 |
The SPECviewperf2020 benchmark results for the Transport HX FT65T-B8050 server showed remarkable performance when outfitted with an AMD Genoa-X 9684X processor and NVIDIA A6000 GPU. Notably, it excelled in viewsets like Maya-06 with a score of 341.36, indicating excellent performance in 3D animation and modeling tasks. It also performed well in 3dsmax-07, Creo-03, and Sw-05 viewsets with scores of 137.15, 141.58, and 168.18, respectively, showcasing its proficiency in graphics-intensive applications. The overall performance of the FT65T-B8050 in the SPECviewperf2020 benchmark is impressive, making it a solid choice for a wide range of professional graphical workloads.
SPECworkstation 3
SPECworkstation3 specializes in benchmarks designed for testing all key aspects of workstation performance; it uses over 30 workloads to test CPU, graphics, I/O, and memory bandwidth. The workloads fall into broader categories such as Media and Entertainment, Financial Services, Product Development, Energy, Life Sciences, and General Operations. We will list the broad-category results for each instead of the individual workloads. The results are an average of all the individual workloads in each category.
| SPECworkstation 3 (Higher is better) | Transport HX FT65T-B8050 (AMD Genoa-X 9684X, NVIDIA A6000) |
| Media and Entertainment | 7.45 |
| Product Development | DNF |
| Life Sciences | 14.35 |
| Financial Services | 25.45 |
| Energy | 20.97 |
| General Operations | 2.64 |
| GPU Compute | 7.4 |
In the SPECworkstation 3 benchmark, results vary across different workload categories. In the Media and Entertainment category, it scored 7.45, indicating decent performance for tasks related to media and entertainment production. The Life Sciences category saw a more solid score of 14.35.
The server excelled in the Financial Services category with a score of 25.45, making it a strong choice for financial-related computational tasks. It also demonstrated good performance in the Energy category with a score of 20.97, while General Operations scored 2.64, suggesting moderate performance for these types of applications. Finally, in GPU Compute, the FT65T-B8050 scored 7.4, indicating its competence in GPU-intensive computing tasks. Overall, the server is well-suited for certain professional applications but could be better for others.
Blender OptiX
Blender is an open-source 3D modeling application. This benchmark was run using the Blender Benchmark utility. The score is samples per minute, with higher being better.
| Blender OptiX (Samples per minute; Higher is better) | TYAN Transport HX FT65T-B8050 (AMD Genoa-X 9684X, NVIDIA A6000) | Dell Precision 7865 (AMD 5995WX, RTX A6000) | Dell Precision 7960 (Xeon w9-3495X, RTX 6000 Ada) | AMD Bergamo 9684X (CPU-only) |
| Monster | 2,875 | 2,839 | 6,709 | 879 |
| Junkshop | 1,714 | 1,595 | 3,165 | 605 |
| Classroom | 1,490 | 1,384 | 3,176 | 421 |
The results showcase a similar performance between the AMD Genoa-X Workstation and the Dell Precision 7865.
The Dell workstation with NVIDIA RTX 6000 Ada significantly outperformed the rest due to its larger CUDA core count, higher memory bandwidth, and support for real-time ray tracing and AI-accelerated tasks. Nonetheless, the Transport HX FT65T-B8050 still performed very well.
Luxmark
Another 3D benchmark we will look at is LuxMark, an OpenCL GPU benchmarking utility. Again, the HX FT65T-B8050 displayed similar results to the Threadripper Dell Precision 7865.
| Luxmark (Higher is better) | TYAN Transport HX FT65T-B8050 (AMD Genoa-X 9684X, NVIDIA A6000) | Dell Precision 7865 (AMD 5995WX, RTX A6000) | Dell Precision 7960 (Xeon w9-3495X, RTX 6000 Ada) |
| Hallbench | 20,904 | 20,991 | 31,731 |
| Food | 7,927 | 7,866 | 13,471 |
ESRI
Next up is the Environmental Systems Research Institute (Esri) benchmark. Esri is a supplier of Geographic Information System (GIS) software. Esri’s Performance Team designed their PerfTool add-in scripts to launch the ArcGIS Pro automatically. This application uses a “ZoomToBookmarks” function to browse various predefined bookmarks and create a log file with all the key data points required to predict the user experience. The script automatically loops the bookmarks three times to account for caching (memory and disk cache). In other words, this benchmark simulates heavy graphical use that one might see through Esri’s ArcGIS Pro software.
The tests consist of three main datasets. Two are 3-D city views of Philadelphia, PA, and Montreal, QC. These city views contain textured 3-D multipatch buildings draped on a terrain model and draped aerial images. The third dataset is a 2-D map view of the Portland, OR region. This data contains detailed information for roads, land use parcels, parks and schools, rivers, lakes, and hill-shaded terrain.
The Transport HX FT65T-B8050 produced solid results and, overall, slightly better than the Precision 7865. While they both expectedly fell behind the 6000 Ada-equipped Precision 7960, the gap was smaller than in previous tests, and the TYAN actually showed better results in one case.
Nonetheless, first up is the Montreal model:
| ESRI ArcGIS Pro 2.3 Montreal | |
| Average FPS | Average |
| TYAN Transport HX FT65T-B8050 (AMD Genoa-X 9684X, NVIDIA A6000) | 582.63 |
| Dell Precision 7865 (AMD 5995WX, A6000) | 574.46 |
| Dell Precision 7960 (Xeon w9-3495X, RTX 6000 Ada) | 809.92 |
| Minimum FPS | Average |
| TYAN Transport HX FT65T-B8050 (AMD Genoa-X 9684X, NVIDIA A6000) | 283.24 |
| Dell Precision 7865 (AMD 5995WX, A6000) | 272.18 |
| Dell Precision 7960 (Xeon w9-3495X, RTX 6000 Ada) | 345.45 |
Next is the Philly model:
| ESRI ArcGIS Pro 2.3 Philly | |
| Average FPS | Average |
| TYAN Transport HX FT65T-B8050 (AMD Genoa-X 9684X, NVIDIA A6000) | 461.57 |
| Dell Precision 7865 (AMD 5995WX, A6000) | 451.09 |
| Dell Precision 7960 (Xeon w9-3495X, RTX 6000 Ada) | 603.84 |
| Minimum FPS | Average |
| TYAN Transport HX FT65T-B8050 (AMD Genoa-X 9684X, NVIDIA A6000) | 256.25 |
| Dell Precision 7865 (AMD 5995WX, A6000) | 254.78 |
| Dell Precision 7960 (Xeon w9-3495X, RTX 6000 Ada) | 321.11 |
Last is the Portland model, where the TYAN server had a better average FPS than the Precision 7960.
| ESRI ArcGIS Pro 2.3 Portland | |
| Average FPS | Average |
| TYAN Transport HX FT65T-B8050 (AMD Genoa-X 9684X, NVIDIA A6000) | 2,538.7 |
| Dell Precision 7865 (AMD 5995WX, A6000) | 1,986.56 |
| Dell Precision 7960 (Xeon w9-3495X, RTX 6000 Ada) | 2,172.16 |
| Minimum FPS | Average |
| TYAN Transport HX FT65T-B8050 (AMD Genoa-X 9684X, NVIDIA A6000) | 1,144.50 |
| Dell Precision 7865 (AMD 5995WX, A6000) | 1,280.95 |
| Dell Precision 7960 (Xeon w9-3495X, RTX 6000 Ada) | 1,270.35 |
OctaneBench
Next, we look at OctaneBench, a benchmarking utility for OctaneRender, another 3D renderer with RTX support similar to V-Ray.
As you can see below, the performance is again almost identical between the HX FT65T-B8050 and Precision 7865. The differences between the A6000 and RTX 6000 Ada systems are also very evident. However, the TYAN still performed well here.
| OctaneBench (Score, higher is better) | Kernel | TYAN Transport HX FT65T-B8050 (AMD Genoa-X 9684X, NVIDIA A6000) | Dell Precision 7865 (AMD 5995WX, A6000) | Dell Precision 7960 (Xeon w9-3495X, RTX 6000 Ada) |
| Interior | Info channels | 18.38 | 18.39 | 42.64 |
| Interior | Direct lighting | 68.09 | 66.64 | 125.49 |
| Interior | Path tracing | 88.12 | 86.40 | 156.94 |
| Idea | Info channels | 11.64 | 11.33 | 24.40 |
| Idea | Direct lighting | 53.49 | 52.14 | 99.20 |
| Idea | Path tracing | 65.79 | 64.19 | 118.34 |
| ATV | Info channels | 28.92 | 28.75 | 67.51 |
| ATV | Direct lighting | 75.17 | 74.09 | 127.96 |
| ATV | Path tracing | 94.61 | 93.20 | 161.16 |
| Box | Info channels | 15.57 | 15.60 | 34.24 |
| Box | Direct lighting | 67.38 | 66.25 | 119.04 |
| Box | Path tracing | 76.12 | 75.01 | 130.36 |
Blackmagic RAW Speed Test
We have also started running Blackmagic’s RAW speed test, which tests video playback performance. Additionally, this test is more of a hybrid test pooling both CPU and GPU in a Real-World scenario for RAW decoding.
| Blackmagic RAW Speed Test (Higher is better) | TYAN Transport HX FT65T-B8050 (AMD Genoa-X 9684X, NVIDIA A6000) | Dell Precision 7865 (AMD 5995WX, A6000) | Dell Precision 7960 (Xeon w9-3495X, RTX 6000 Ada) |
| 8K CPU | 115 FPS | 122 FPS | 124 FPS |
| 8K CUDA | 185 FPS | 153 FPS | 194 FPS |
7-Zip Compression
The built-in memory benchmark in the popular 7-Zip utility demonstrates the CPU performances of each machine well. The Threadripper in the 7865 certainly was the best performer here compared to the Xeon W9-3495X in the 7960 and the FT65T-B8050 with the AMD Genoa-X 9684X.
We run this test at a 128MB dictionary size when possible.
| 7-Zip Compression Benchmark (Higher is better) | TYAN Transport HX FT65T-B8050 (AMD Genoa-X 9684X, NVIDIA A6000) | Dell Precision 7865 (AMD 5995WX, A6000) | Dell Precision 7960 (Xeon w9-3495X, RTX 6000 Ada) |
| Current CPU Usage | 4,327% | 3,302% | 3,279% |
| Current Rating/Usage | 3.571 GIPS | 6.913 GIPS | 6.917 GIPS |
| Current Rating | 154.498 GIPS | 228.231 GIPS | 226.810 GIPS |
| Resulting CPU Usage | 4,317% | 3293% | 3,316% |
| Resulting Rating/Usage | 3.597 GIPS | 6.973 GIPS | 6.934 GIPS |
| Resulting Rating | 155.293 GIPS | 229.630 GIPS | 229.905 GIPS |
| Current CPU Usage | 4,703% | 6,181% | 6,106% |
| Current Rating/Usage | 5.235 GIPS | 5.265 GIPS | 3.760 GIPS |
| Current Rating | 155.293 GIPS | 325.422 GIPS | 229.591 GIPS |
| Resulting CPU Usage | 4,657% | 6,188% | 5,860% |
| Resulting Rating/Usage | 5.297 GIPS | 5.265 GIPS | 2.954 GIPS |
| Resulting Rating | 246.655 GIPS | 325.813 GIPS | 231.485 GIPS |
| Total CPU Usage | 4,478% | 4,740% | 4,588% |
| Total Rating/Usage | 4.447 GIPS | 6.119 GIPS | 5.444 GIPS |
| Total Rating | 200.974 GIPS | 277.721 GIPS | 230.695 GIPS |
Geekbench 6
Geekbench 6 is a cross-platform benchmark that measures overall system performance. However, looking at the single-core vs. multi-core and the OpenCL benchmark would be interesting. Higher scores are better.
Here, results were very close (the TYAN server outpaced the Dell in Multi-cores) with the apparent exception of the GPU-heavy OpenCL test.
You can find comparisons to any system you want in the Geekbench Browser.
| Geekbench 6 | TYAN Transport HX FT65T-B8050 (AMD Genoa-X 9684X, NVIDIA A6000) | Dell Precision 7960 (Xeon w9-3495X, RTX 6000 Ada) | AMD Bergamo 9754 1p/128c (stock configuration) |
| CPU Benchmark – Single-Core | 2,097 | 2,302 | 17,38 |
| CPU Benchmark – Multi-Core | 21,077 | 18157 | 18,683 |
| GPU Benchmark – OpenCL | 211,091 | 303,158 | N/A |
Cinebench R23
Maxon’s Cinebench R23 is a CPU rendering benchmark that utilizes all CPU cores and threads. We ran it for both multi- and single-core tests. Higher scores are better.
Again, the AMD Genoa-X Workstation noticeably outpaced Dell’s Xeon in multicore performance due to the difference in core count (96 vs 56).
| Cinebench R23 | TYAN Transport HX FT65T-B8050 (AMD Genoa-X 9684X, NVIDIA A6000) | Dell Precision 7960 (Xeon w9-3495X, RTX 6000 Ada) | AMD Bergamo 9754 1p/128c (stock configuration) |
| CPU (Multi-Core) | 94,754 Points | 58,774 Points | 103,876 Points |
| CPU (Single-Core) | 1,299 Points | 1,689 Points | 1,098 Points |
| MP Ratio | 72.96x | 34.79x | 94.65x |
UL Procyon AI Inference
UL’s Procyon estimates a workstation’s performance for professional apps. We ran the AI Inference test for Windows Machine Learning on CPU, GPU, and NVIDIA Tensor RT. Lower times are better, and higher overall scores are better.
| UL Procyon Average Inference Times | FT65T-B8050 (AI Windows ML 9684X) |
FT65T-B8050 (AI Tensor RT – A6000) |
FT65T-B8050 (AI Windows ML – A6000) |
Dell Precision 7960 (AI Windows ML – RTX 6000 Ada) | Dell Precision 7960 (AI Tensor RT – RTX 6000 Ada ) | Dell Precision 7960 (AI Windows ML – w9-3495X) |
| MobileNet V3 | 2.76 | 0.94 | 0.69 | 0.54 | 0.59 | 2.22 |
| ResNet 50 | 6.81 | 3.00 | 1.47 | 0.95 | 0.99 | 6.27 |
| Inception V4 | 29.46 | 9.70 | 3.72 | 2.32 | 3.42 | 29.41 |
| DeepLab V3 | 28.50 | 7.87 | 11.86 | 26.87 | 2.95 | 24.27 |
| YOLO V3 | 43.70 | 9.06 | 6.14 | 5.34 | 2.68 | 37.83 |
| REAL-ESRGAN | 3762.94 | 126.07 | 121.91 | 86.18 | 84.15 | 1527.68 |
| Overall Score | 134 | 632 | 881 | 1009 | 1506 | 173 |
y-cruncher
y-cruncher is a multi-threaded and scalable program that can compute Pi and other mathematical constants to trillions of digits. Since its launch in 2009, y-cruncher has become a popular benchmarking and stress-testing application for overclockers and hardware enthusiasts. Faster is better in this test.
As this is a CPU-heavy test, the TYAN Transport HX FT65T-B8050’s AMD Genoa-X 9684X noticeably outpaced the Dell Precision 7960’s Xeon w9-3495X once we go to 10 billion digits.
| y-cruncher (Total Computation time) | TYAN Transport HX FT65T-B8050 (AMD Genoa-X 9684X, NVIDIA A6000) | Dell Precision 7960 (Xeon w9-3495X, RTX 6000 Ada) | AMD Genoa-X 9684X 1P/96C |
| 1 billion digits | 10.233 Seconds | 12.788 Seconds | 10.296 |
| 2.5 billion digits | 20.543 Seconds | 34.459 Seconds | N/A |
| 10 billion digits | 72.568 Seconds | 157.770 Seconds | 72.377 |
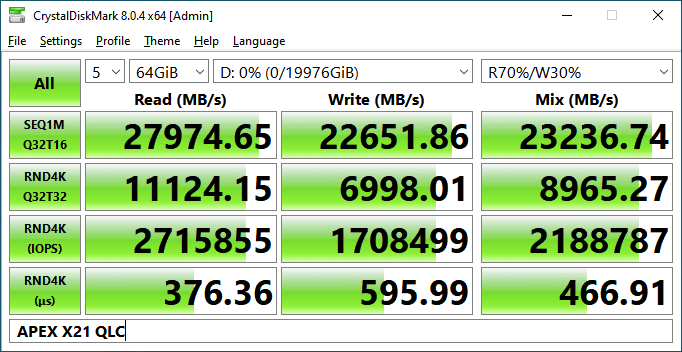
CrystalDiskMark (v. 8.0.4)
Crystal Disk Mark is a widely popular benchmarking tool designed to gauge read and write speeds of storage devices. Inside the TYAN server is the Apex X1 QLC PCIe SSD RAID Card. This type of AIC consolidates multiple SSDs onto a single card, allowing for enhanced storage performance through RAID configurations while saving physical space within a computer chassis. It also provides both speed and data redundancy benefits, making it an efficient solution for systems with demanding storage needs.
We deployed the AIC with a total of 21x Solidigm P41 Plus SSDs.
The AMD Genoa-X Workstation hit 27,975MB/s read and 22,651MB/s write (Sequential Q32/T16). See below for its complete results:
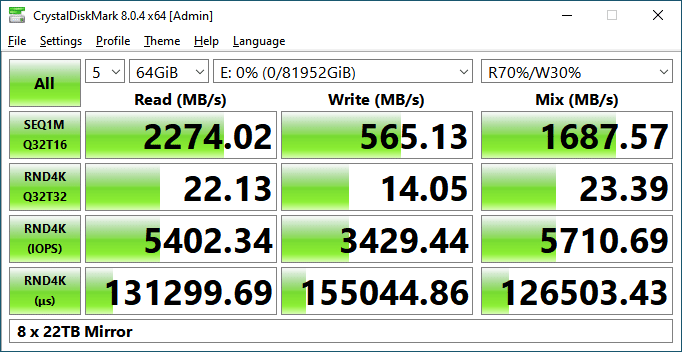
We also ran this test on a RAID mirror configuration for the eight installed WD Red 22TB drives, where it posted 2,274MB/s read and 565MB/s write (Sequential Q32/T16). Here are the complete results:
Blackmagic Performance
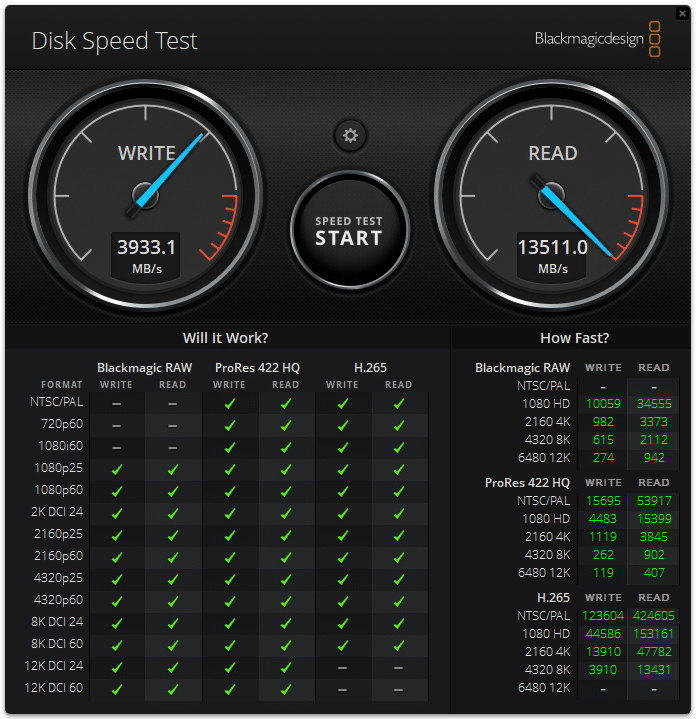
We also tested both drive configurations using the Blackmagic disk speed test. When looking at the performance of the Solidigm 41 Plus Apex X1 AIC setup, it was able to produce 13,511MB/s read, and 3,933MB/s write:
When testing the WD Red drives on the AMD Genoa-X Workstation, it showed:
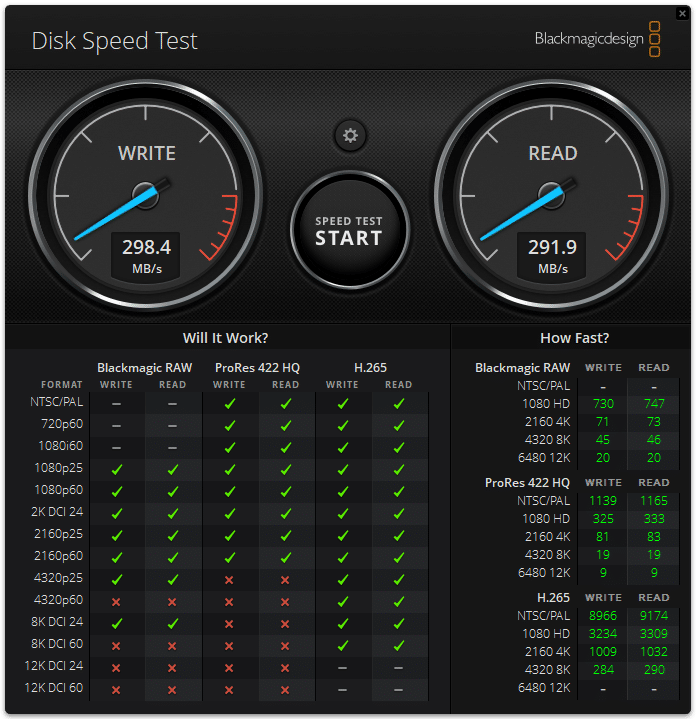
Results are slower than the CrystalDiskMark because Blackmagic primarily focuses on simulating real-world video production tasks, including high data throughput, which can be more demanding on storage systems. In comparison, CDM typically measures pure read and write speeds in a simplified scenario, which often yields higher numbers.
AMD Genoa-X Workstation Power Consumption
We do our power testing with the Quarch IEC Mains Power Analysis Module.
| Test | TYAN Transport HX FT65T-B8050 Power Consumption |
| Idle | 387 watts |
| GPU Load (Luxmark) | 662 watts |
| CPU Load (y-cruncher) | 691 watts |
| GPU + CPU Load (Luxmark + y-cruncher) |
1,010 watts |
The AMD Genoa-X Workstation power consumption is justifiable considering its impressive hardware configuration. Equipped with a 96-core Genoa-X CPU and a plethora of storage devices, including 8 HDDs and 21 SSDs facilitated by the Apex X21 AIC, it certainly adds wattage.
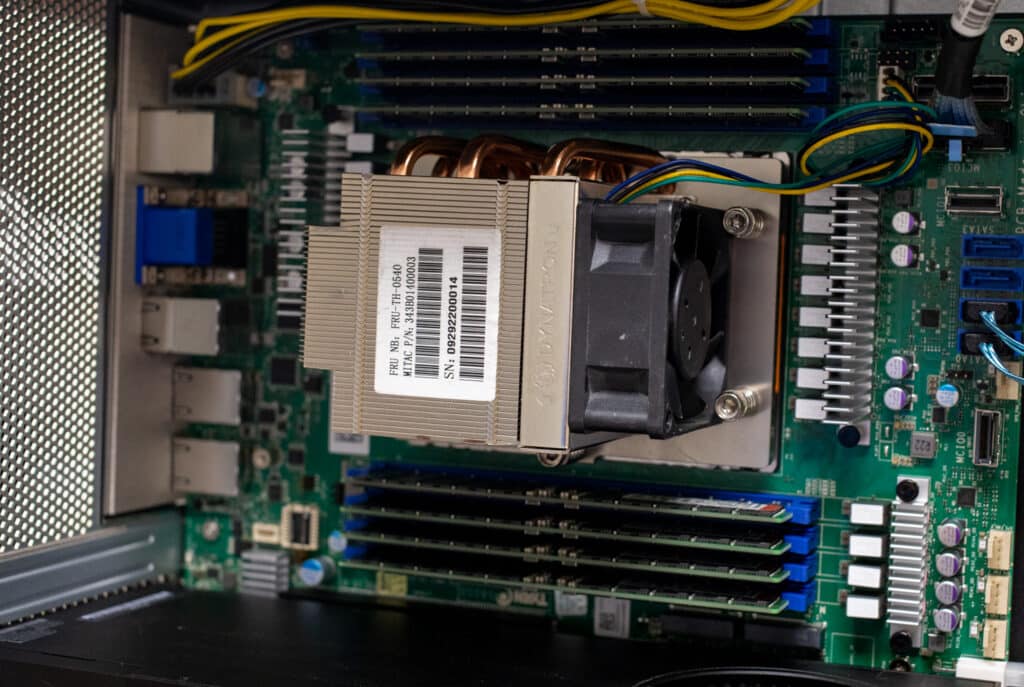
AMD Genoa-X Workstation Cooling
As we previewed this project across social media, we received dozens of comments and questions about platform cooling with such a small heatsink. It’s important to note that this is effectively a server platform turned on its side, and servers are cooled to a different standard than traditional PC systems. Tyan supports this Genoa-X CPU with an asterisk, so our build isn’t quite officially supported.
To be fair, we are running an AMD EPYC Genoa-X with the highest TDP offered of 400W; many are less than 300W. We also turned off C-states to lock the CPU into higher clock speeds versus scaling down and kept the system in a high-performance mode. By all accounts, we put the system under as much stress as possible.
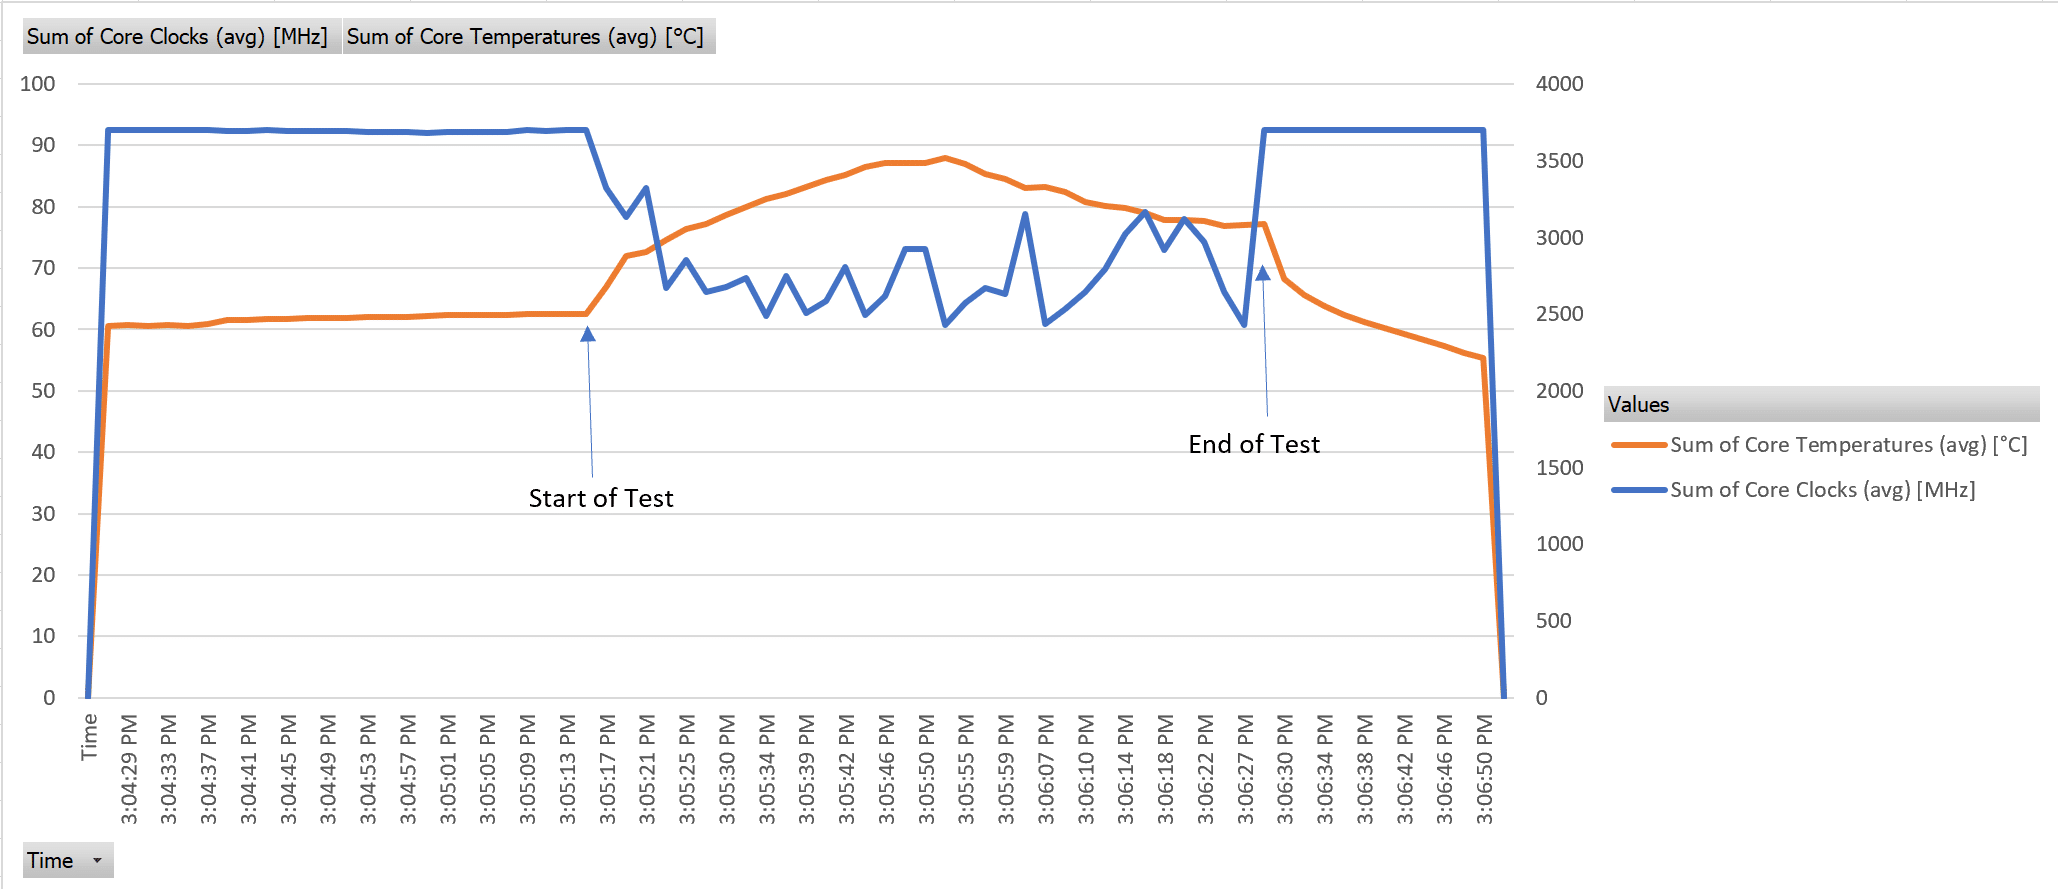
In the chart above, you can see that the CPU throttles during heavy load activity. Will this affect performance for most users? Probably not. For users looking to keep a high-bin CPU at full tilt 24/7, you might see some hit from throttling. In fact, we compared our CPU results in the AMD Genoa-X Workstation to a Tyan server platform with the same CPU, and this workstation build was actually a little faster.
The takeaway is that we are seeing some throttling under heavy load, but the performance is still outstanding. And if you were to build a rig like this for professional work, you may be able to squeeze out even more performance with a more robust cooling solution. We’ll leave that for another time.
Conclusion
Overall, the AMD Genoa-X Workstation build is an incredibly impressive workstation. When equipped with a flagship AMD Genoa-X CPU, an NVIDIA A6000 GPU, and a generous 512GB of Kingston DDR5-4800 Registered ECC DRAM, the workstation certainly showed its potential as a new standard-setter for performance and versatility.
What sets the FT65T-B8050 apart is its adaptability. If our build isn’t quite to snuff, you have the freedom to ramp up its power even more. You can slot in multiple GPUs or a different EPYC CPU to push its performance to even more impressive levels. While our unit might not look dramatic by consumer-rig standards, its computing power in the realm of gaming would be considerable. This rig could game like a behemoth if you configured it correspondingly.
Moreover, storage capacity is expansive. In addition to its eight 3.5-inch bays and two 2.5-inch bays, you can outfit it with an AIC expansion card that can add many terabytes of combined raw SSD speeds. We deployed an Apex X21 card, equipping it with a total of 21x Solidigm P41 Plus SSDs, which were able to get almost 30GB/s in reads during our CrystalDiskMark test, while the Blackmagic benchmark was able to reach nearly 14GB/s read.
The ultimate takeaway is that this could be the most impressive tower workstation we’ve had in our lab, setting a new benchmark for high-performance computing. The “-2T” variant is particularly compelling for high-bandwidth applications, standing head and shoulders above its simpler counterparts in the lineup.
The AMD Genoa-X Workstation certainly met our expectations, and more performance could be available with a more aggressive cooling setup. Overall, the underlying Tyan platform’s combination of serious computational might with impressive customization options makes it an essential system for anyone needing a powerful solution in pretty much any application. Whether you’re delving into the realms of artificial intelligence or data analysis (with the added side benefit of being a viable high-end gaming rig), the FT65T-B8050 is a server, errr, workstation that delivers nothing short of excellence.


 Amazon