

One of the most common ways to stress a storage platform is through synthetic workloads or four-corners type of testing. In this testing scenario, we look at the peak I/O a platform can generate, as well as the peak bandwidth. While these figures aren't supposed to be used in place of application tests, they are helpful in comparing one platform to another and provide valuable insight for customers working on a PoC. To that end we have migrated hyper-converged synthetic tests to HCIbench, which VMware released earlier this year. At its core HCIbench leverages the industry-accepted VDbench workload generator and distributes VMs across a target cluster and aggregates the results. We use our own I/O profiles for this tool, which are linked below for users to replicate our tests.
Dell PowerEdge R730xd VMware VSAN Specifications
- Dell PowerEdge R730xd Servers (x4)
- CPUs: Eight Intel Xeon E5-2697 v3 2.6GHz (14C/28T)
- Memory: 64 x 16GB DDR4 RDIMM
- SSD: 16 x 800GB Solid State Drive SAS Mix Use MLC 12Gbps
- HDD: 80 x 1.2TB 10K RPM SAS 6Gbps
- Networking: 4 x Intel X520 DP 10Gb DA/SFP+, + I350 DP 1Gb Ethernet
- Storage Capacity: 86.46TB
HCIbench Test Configuration
- 16 VMs
- 10 VMDK per VM
- 10GB VMDK (1.6TB footprint)
- 50GB VMDK (8TB footprint)
- 100GB VMDK (16TB footprint)
- Full-write storage initialization
- 1.5 hour test intervals (30 minute preconditioning, 60 minute test sample period)
For testing the hybrid configuration of our VMware VSAN we deployed three different configurations for our workload profiles. These include a 1.6TB (fully in-cache), 8TB (partially outside of cache) and 16TB (spilling outside of cache) footprint so show how the platform responds as hot-data grows. These sizes can be adjusted for each platform depending on how much flash is provisioned for cache or tiering.
StorageReview's HCIbench Workload Profiles
- 4K Random 100% read
- 4K Random 100% write
- 8K Random 70% read / 30% write
- 32K Sequential 100% read
- 32K Sequential 100% write
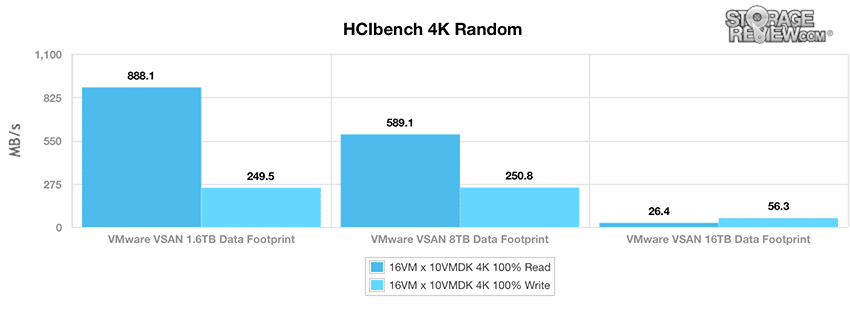
The first HCIbench test looks at peak random throughput from the VMware VSAN platform with a fully random 4K workload profile. Fully warmed up with data moved into cache, we measured 888MB/s read and 249MB/s write with a 1.6TB footprint (3.2TB with parity data). With that working set expanded to 8TB (16TB with parity data) with some data falling outside of cache, we still measured strong performance of 589MB/s read and 250MB/s write. With the largest dataset measuring 16TB (32TB across the cluster) with the workload spilling out onto the 10K HDDs, performance dropped to 26MB/s read and 56MB/s write.
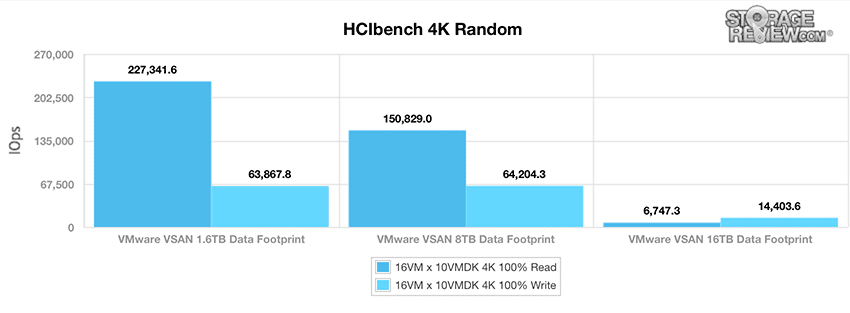
When looking at peak I/O in the same 4K profile, results told a similar story from the VMware VSAN platform. Unsurprisingly, the fully in-cache 1.6TB footprint measured an impressive 227,241.6 IOPS read and 63,867.8 IOPS write. When increased to 8TB, we recorded 150,829 IOPS read and 64,204.3 IOPS write. The 16TB footprint, our largest dataset, measured 6,747.3 IOPS read and 14,403.6 IOPS write.
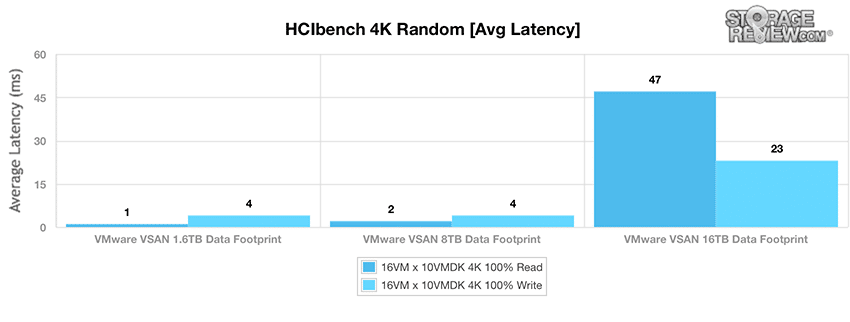
The next metric looks at the fully random 4K workload profile’s average latency. Here, the 1.6TB and 8TB footprints showed very low latency, with 1ms read/4ms write and 2ms read/4ms write, respectively. Because the workload continued to spill out to the 10K HDDs, performance dropped significantly with the VMware VSAN 16TB footprint configuration, measuring 47ms read and 23ms write.
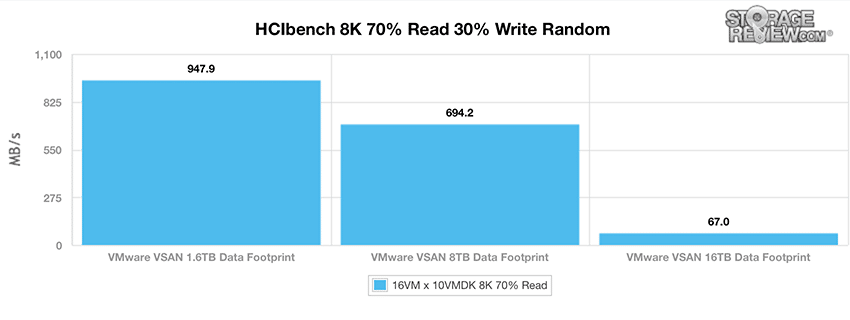
Switching to a larger 8K data profile with a mixture of 70% read and 30% write activity, the VMware VSAN hit 947.9MB/s using a 1.6TB footprint. When we increased the working set to 8TB, we measured 694.2MB/s, which is still very impressive. Again, due to the workload spilling out onto the hard-disk drives, the 16TB footprint showed a steep drop in performance to 67.0MB/s.
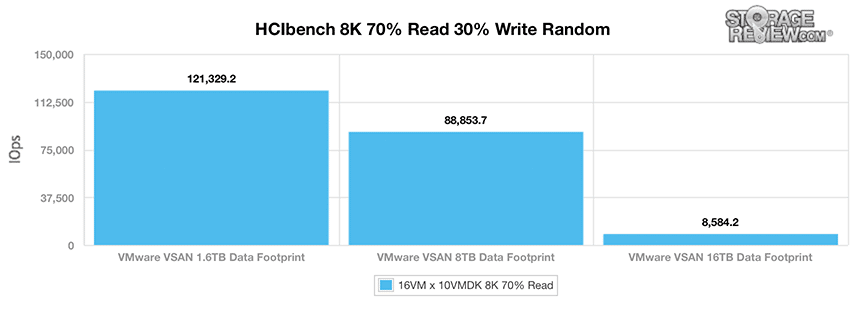
In I/O performance of the same 8K 70% read and 30% write workload, the VMware VSAN’s 1.6TB footprint recorded 121,329.2 IOPS. When configured with an 8TB footprint, performance dropped to 88,853.7 IOPS while the 16TB footprint reached only 8,584.2 IOPS.
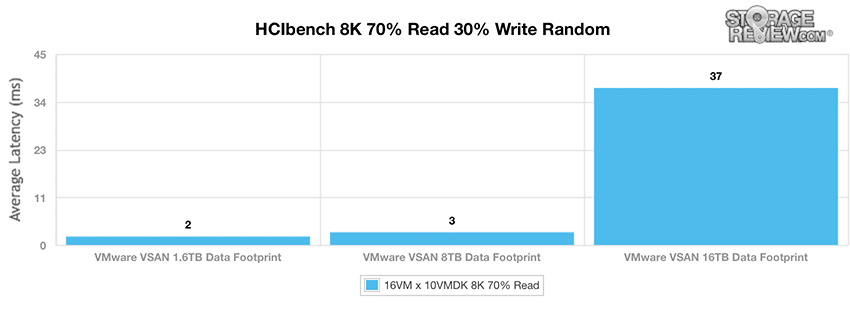
Moving to average latency, the fully in-cache 1.6TB configuration measured just 2ms while the 8TB footprint showed slightly higher results with 3ms. Our largest dataset measuring 16TB (32TB across the cluster) showed the highest average latency with 37ms.
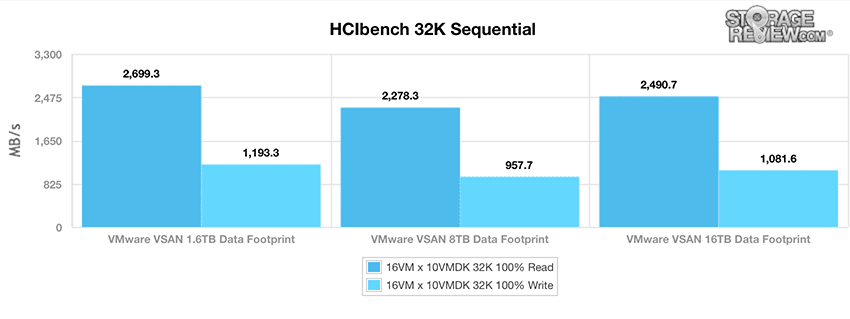
The last workload switches to a peak bandwidth focus, consisting of a 32K sequential read and write profile. Once it has completely warmed up, the 1.6TB footprint configuration showed an impressive 2,699.3MB/s read and 1,193.3MB/s write. When increased to 8TB (16TB with parity data with some data falling outside of cache), we measured 2,278.3MB/s read and 957.7MB/s write. The 16TB footprint showed 2,490.7MB/s read and 1,081.6MB/s write. While HDDs generally don't perform incredibly well with random workloads, it was nice to see a stable sequential profile as the footprint grew on VSAN.
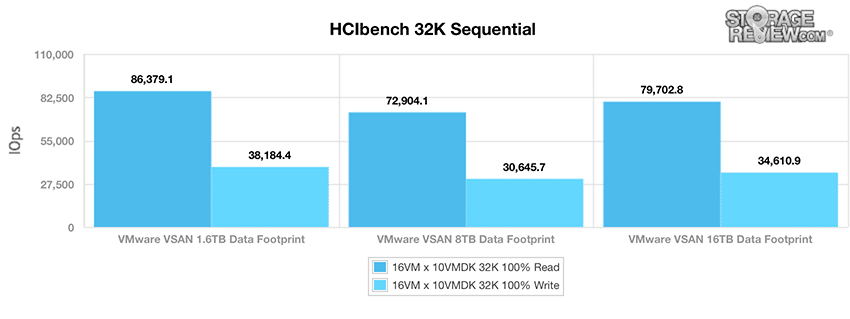
I/O measurements showed very similar results with the 1.6TB footprint measuring read and writes of 86,379.1 IOPS and 38,184.4 IOPS, respectively. When increasing the footprint to 8TB, the VMware VSAN hit 72,904.1 IOPS read and 30,645.7 IOPS write. Our largest footprint recorded 79,702.8 IOPS read and 34,610.9 IOPS write.
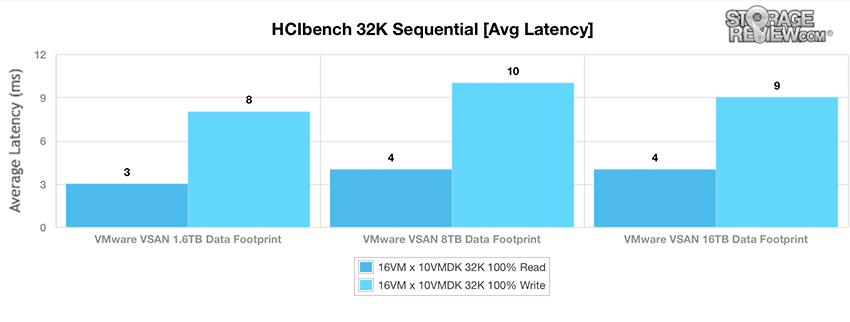
Looking at average latency, results were very similar between all footprint sizes. Our fully in-cache 1.6TB configuration measured 3ms read and 8ms write while the hitting 4ms read and 10ms write when the working set was expanded to 8TB. Our largest footprint also had a good showing with 4ms read and 9ms write.
Overall the VMware VSAN platform performed much as we'd expect this far into the review. In prime operating conditions VSAN performance was stellar and that remained true as the data footprint grew. We saw peak random 4K I/O measuring as high as 227k IOPS read and 64k IOPS write, with 8K 70/30 performance measuring 121k IOPS. Pushing the working set from 1.6TB to 8TB that performance dipped to 150k/64K R/W in the 4K profile, while the mixed 8K 70/30 performance dropped to 88k IOPS. At a certain point though, and this is true for all hybrid SSD/HDD platforms, performance will drop as hot-data spills out onto HDDs. With a large-pool of 10K HDDs providing the capacity layer, VSAN still offered a usable chunk of performance, measuring upwards of 14k IOPS random 4K write and 8.5k IOPS random 8K 70/30 with a large 16TB (32TB consumed) data footprint.
For buyers evaluating a platform or even going through the configuration steps before purchasing a storage array it is important to take note of what your current and projected future storage demands are. Starting off on the wrong foot can cause performance or capacity issues to crop up faster. VMware has done a good job at helping buyers work through this with VSAN, since the platform is highly configurable. Pick the drives you need now and if things change, you can add in more flash at the host-level. In the HCI space this isn't true across the board, some platforms require adding in a complete node if the storage/compute balance changes.
VMware Virtual SAN Review: Overview and Configuration
VMware Virtual SAN Review: VMmark Performance
VMware Virtual SAN Review: Sysbench OLTP Performance
VMware Virtual SAN Review: SQL Server Performance
VMware Virtual SAN Review: Scaled Sysbench OLTP Performance
VMware Virtual SAN Review: HCIbench Synthetic Performance


 Amazon