
Western Digital launched the Ultrastar DC SN630 in February of this year, as part of a refresh and rebranding of their Ultrastar line (formerly HGST) of data center drives. Within this portfolio Western Digital has several enterprise NVMe SSD offerings with the SN200 taking the throne as the performance leader and the new SN630 replaces the SN620 in the mainstream single port NVMe space, which is an increasingly popular alternative to SATA and SAS SSDs. The SN630, which is Western Digital’s workhorse NVMe SSD comes tuned either for read-centric workloads or high-endurance mixed-use workloads. The drive construction in either case is the same, the functional difference in the level of overprovisioning that goes into the drive, which in turn produces the desired endurance rating.
Western Digital launched the Ultrastar DC SN630 in February of this year, as part of a refresh and rebranding of their Ultrastar line (formerly HGST) of data center drives. Within this portfolio Western Digital has several enterprise NVMe SSD offerings with the SN200 taking the throne as the performance leader and the new SN630 replaces the SN620 in the mainstream single port NVMe space, which is an increasingly popular alternative to SATA and SAS SSDs. The SN630, which is Western Digital’s workhorse NVMe SSD comes tuned either for read-centric workloads or high-endurance mixed-use workloads. The drive construction in either case is the same, the functional difference in the level of overprovisioning that goes into the drive, which in turn produces the desired endurance rating.
From an SSD design perspective, the Ultrastar SN630 uses Western Digital’s in-house controller and firmware build and Western Digital’s own 64-layer BiCS3 3D NAND. From an engineering perspective, a vertically integrated solution like this is becoming the standard for leading-class enterprise SSDs. While it’s certainly possible to use NAND, controllers and firmware from different sources, we tend to see better performing and more reliable solutions from vendors who can do all the work on their own. The drive itself uses a 7mm 2.5″ U.2 form factor and like other SSDs Western Digital offers, the SN630 offers proprietary wear levelling algorithms and power loss protection.
As noted, the SN630 comes in mixed-use and read-intensive SKUs. The former ships in 6.40TB, 3.20TB, 1.60TB and 800GB capacities while the latter comes in 7.68TB, 3.84TB, 1.92TB and 960GB capacities. All of the drives offer Instant Secure Erase (ISE) which uses behind-the-scenes encryption keys to handle drive redeployment and retirement. Western Digital also provides secure firmware downloads with RSA authentication to ensure the SN630 runs authentic firmware only. Lastly, the drives are backed by a 5-year limited warranty.
In this review we examine the SN630’s performance within the context of VMware vSAN. The review configuration uses a Supermicro SuperServer BigTwin 2029BT-HNR 4 node chassis, 24 Ultrastar DC SN630 NVMe SSDs and VMware vSAN 6.7 Update 1 to delve into the performance of the SN630 with a more broad system wide perspective.
Western Digital Ultrastar DC SN630 Specifications
| Model | VRI/RI | |||
| Capacity | 960GB/800GB | 1,920GB/1,600GB | 3,840GB/3,200GB | 7,680GB/6,400GB |
| Form factor | U.2 2.5-inch drive | |||
| Interface | PCIe Gen 3.1 x4 (Compliant to NVMe 1.3) | |||
| Flash Memory Technology | Western Digital BiCS3 3D TLC NAND | |||
| Performance | ||||
| Sequential Read, (max MiB/s) | 2,690/2,690 | 2,660/2,670 | 2,510/2,500 | 2,520/2,540 |
| Sequential Write, (max MiB/s) | 930/960 | 1,230/1,240 | 1,180/1,200 | 1,240/1,240 |
| Random Read (max IOPS) | 278,760/281,790 | 358,220/356,870 | 332,420/332,510 | 360,280/306,520 |
| Random Write (max IOPS) | 43,580/86,740 | 53,850/86,870 | 55,000/88,140 | 54,220/88,210 |
| Random Mix R70/W30 (max IOPS) | 107,350/188,480 | 170,390/253,390 | 163,350/238,500 | 170,250/273,960 |
| Random Read Latency (μs) | 179/179 | 190/188 | 243/239 | 243/239 |
| Reliability | ||||
| DWPD | 0.8/2 | |||
| UBER | 1 in 10^17 | |||
| EOL Data Retention | 5° C to 40° C for a maximum period of 90 days | |||
| MTBF | 2 million hours | |||
| AFR | 0.44% | |||
| Power | ||||
| Requirement (DC +/- 10%) | 12V | |||
| Operating Power States (W, typical) | 10.75 & 8.75 | |||
| Idle (W, average) | 5.80 | 5.80 | 5.90 | 6.10 |
| Environmental | ||||
| Operating Temperature | 0° C to 78° C | |||
| Average Temperature | -40° C to 70° C for 1 year | |||
| Physical | ||||
| Width (mm) | 69.85 +/-0.25 | |||
| Length (mm, max) | 100.45 | |||
| Weight (g, max) | 95 | |||
| z-height (mm) | 7.00 +0.2/-0.5 (including labels) | |||
| Warranty | 5-year limited | |||
Western Digital Ultrastar DC SN630 VMware vSAN Design and Build
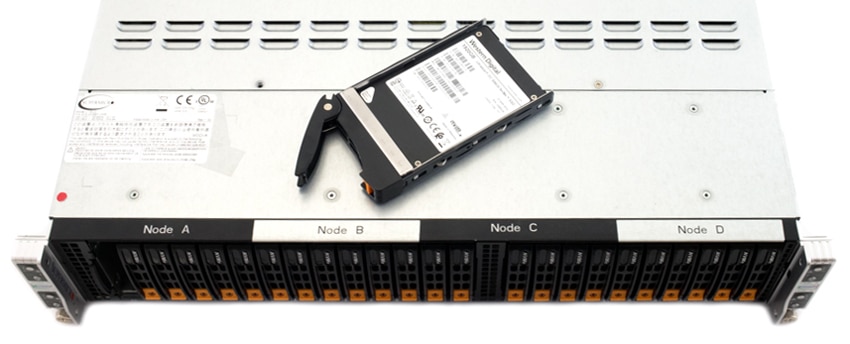
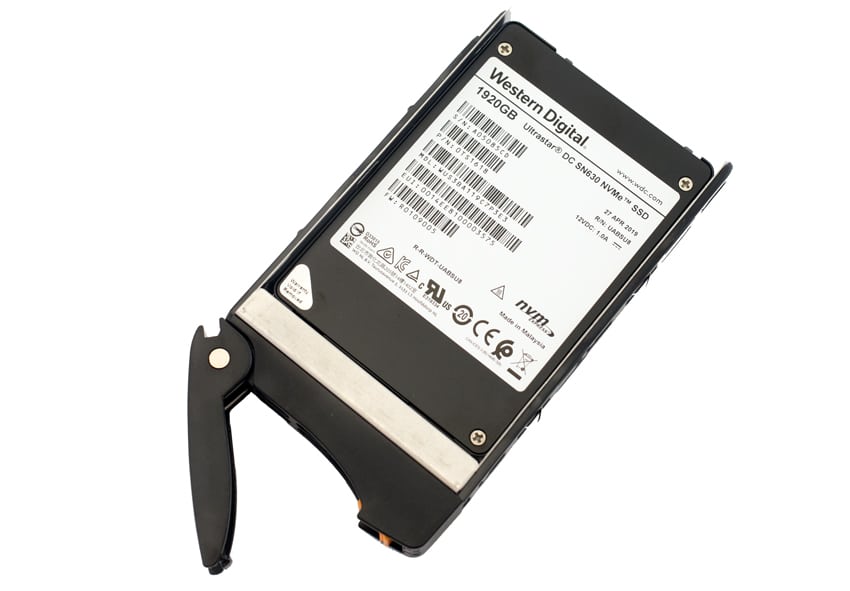
The Western Digital Ultrastar DC SN630 is a 2.5” NVMe drive aimed at the data center. The drive ranges in capacity from 800GB to 7.68TB. The SN630 is encased in black metal with a sticker on top that holds information such as the name, branding, capacity, model number, and certifications.
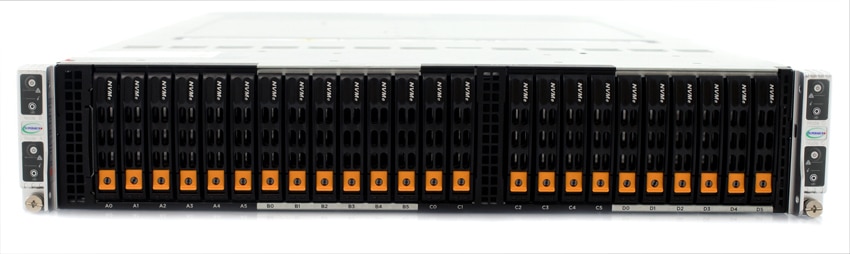
The front of the Supermicro SuperServer BigTwin chassis sports 24 2.5″ NVMe drive bays, with 6 allocated per node. Each node offers its own locate LED button as well as discrete power button.
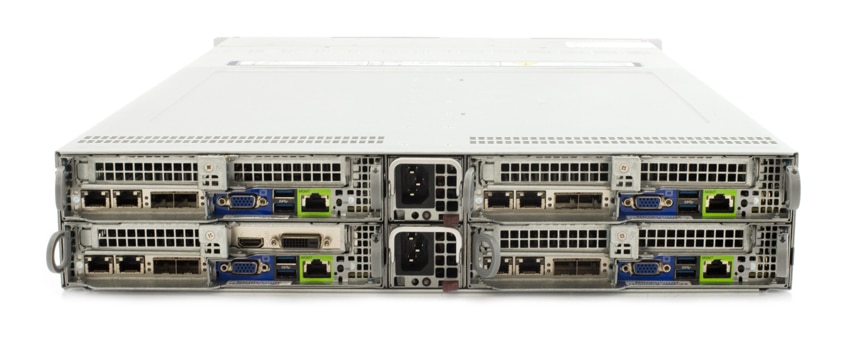
The rear of the BigTwin shows the four compute node trays. Each comes standard with an IPMI port for out-of-band management, VGA, two USB 3 ports as well as a user-configurable NIC. With our configuration we are using a four port NIC, with two 10GBase-T ports as well as two SPF28 25G ports. Our testing configuration leveraged the 25G connections for the vSAN cluster. All nodes share a common dual-PSU power platform as part of the chassis design.
Western Digital Ultrastar DC SN630 VMware vSAN Review Configuration
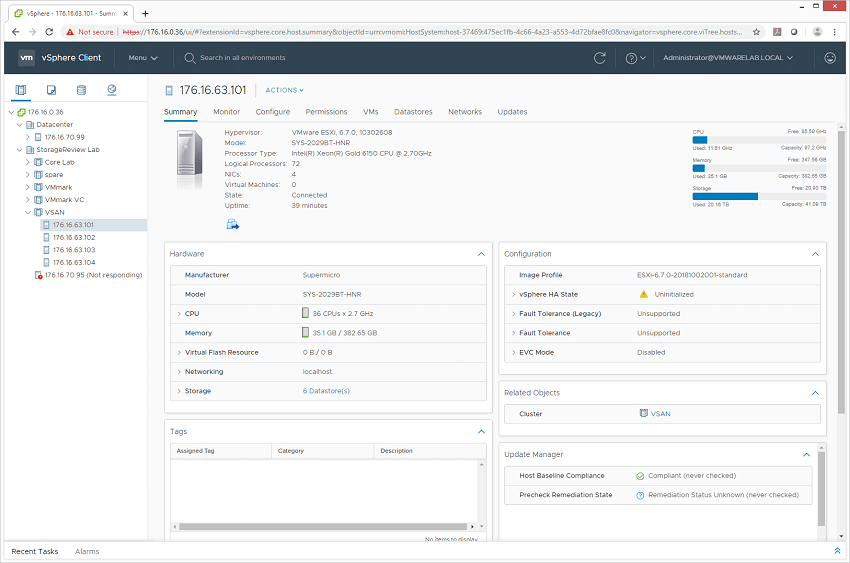
To test the 24 SN630 SSDs in a vSAN environment, we used a Supermicro SuperServer BigTwin 2029BT-HNR four-node system. The configuration per node is as follows:
- 2 x Intel Gold 6150 CPUs (2.7GHz, 18-core)
- 12 x 32GB 2666MHz DDR4 ECC RAM
- 2 x 800GB Western Digital Ultrastar DC SN630 NVMe SSDs for vSAN Cache
- 4 x 1.92TB Western Digital Ultrastar DC SN630 NVMe SSDs for vSAN Capacity
- 1 x 500GB Western Digital Blue SATA SSD for Boot Drive
- Dual Port 25Gb Mellanox ConnectX-4 NIC
- VMware ESXi 6.7u1 (10302608)
We leveraged a fairly modest server build for our VMware vSAN testing around the Western Digital Ultrastar DC SN630. The servers used upper-midrange Intel Gold 6150 CPUs, with a clockspeed of 2.7GHz and a core count of 18. Per server that gives us 97.2GHz of compute power, or 388.8GHz at the cluster level. We also used 384GB of RAM per node, giving us plenty of memory for our synthetic and application workloads.
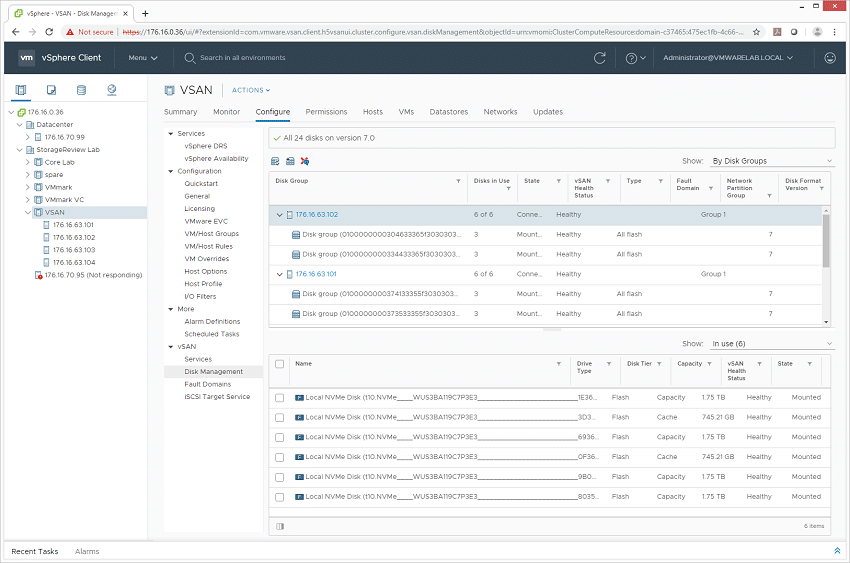
In our testing configuration we used a layout of two disk groups per node, each with one 800GB SN630 NVMe SSD for cache and two 1.92TB SN630 NVMe SSDs for capacity. Usable capacity comes down to how VMs are provisioned across the cluster as well as the level of mirroring you use. Raw storage measures 27.95TB in our cluster, but with the default two-way mirroring VM policy with vSAN overhead, we are left with 13.79TB of usable capacity. Data-reduction though that extend that dramatically though for certain workload types.
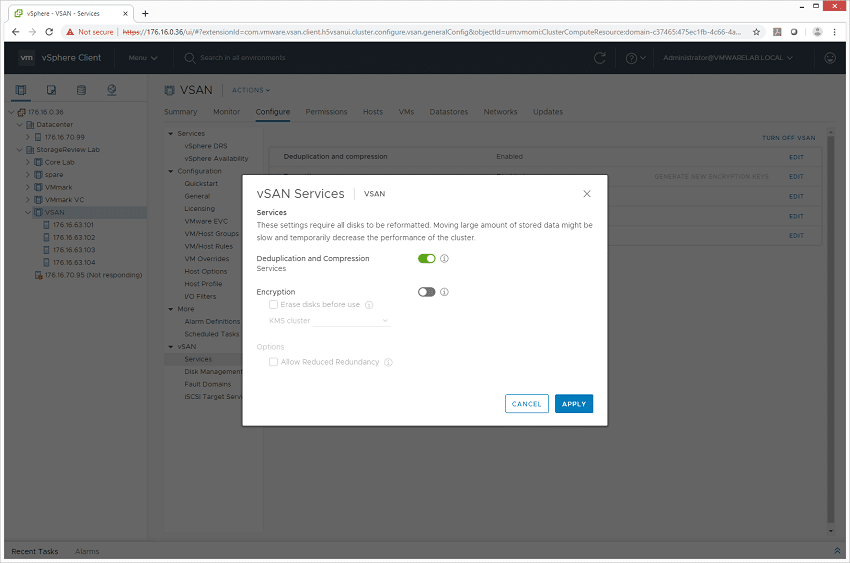
While our application workloads will focus on performance of the cluster with data-reduction turned off, we will include synthetic benchmarks showcasing performance of the cluster with and without data-reduction enabled. While data-reduction will have a component of performance overhead associated with it, it will dramatically increase the usable capacity of the vSAN cluster in certain deployments.
Western Digital Ultrastar DC SN630 VMware vSAN Performance Review
SQL Server Performance
StorageReview’s Microsoft SQL Server OLTP testing protocol employs the current draft of the Transaction Processing Performance Council’s Benchmark C (TPC-C), an online transaction processing benchmark that simulates the activities found in complex application environments. The TPC-C benchmark comes closer than synthetic performance benchmarks to gauging the performance strengths and bottlenecks of storage infrastructure in database environments.
Each SQL Server VM is configured with two vDisks: 100GB volume for boot and a 500GB volume for the database and log files. From a system resource perspective, we configured each VM with 16 vCPUs, 64GB of DRAM and leveraged the LSI Logic SAS SCSI controller. While our Sysbench workloads tested previously saturated the platform in both storage I/O and capacity, the SQL test looks for latency performance.
This test uses SQL Server 2014 running on Windows Server 2012 R2 guest VMs, and is stressed by Dell’s Benchmark Factory for Databases. While our traditional usage of this benchmark has been to test large 3,000-scale databases on local or shared storage, in this iteration we focus on spreading out four 1,500-scale databases evenly across our servers.
SQL Server Testing Configuration (per VM)
- Windows Server 2012 R2
- Storage Footprint: 600GB allocated, 500GB used
- SQL Server 2014
- Database Size: 1,500 scale
- Virtual Client Load: 15,000
- RAM Buffer: 48GB
- Test Length: 3 hours
- 2.5 hours preconditioning
- 30 minutes sample period
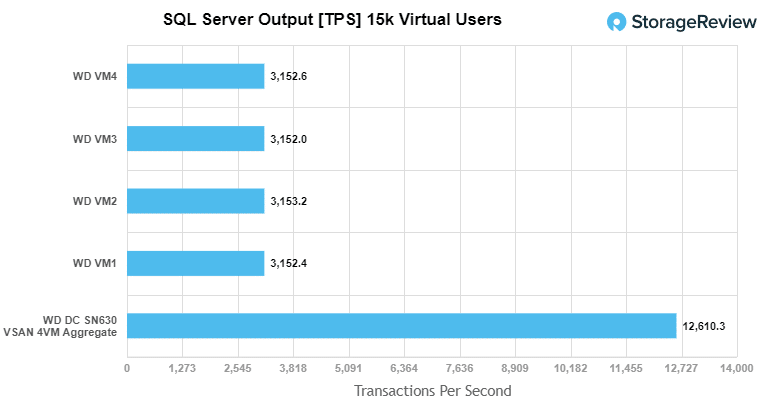
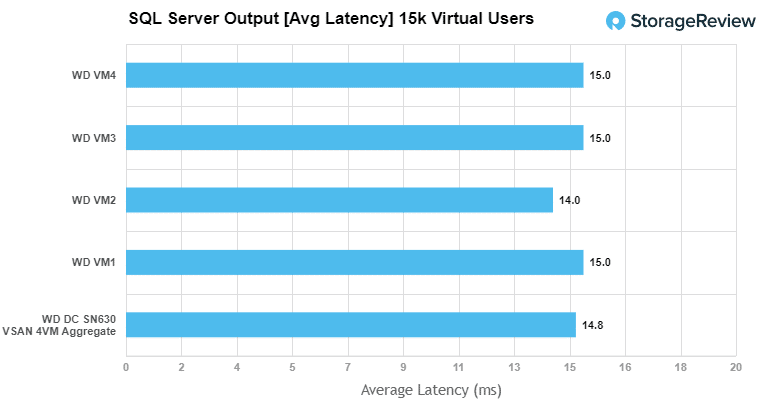
For our transactional SQL Server benchmark, the Western Digital Ultrastar DC SN630 VMware vSAN in the Supermicro BigTwin was able to hit an aggregate score of 12,610.3 TPS with individual VMs running from 3,152.01 TPS to 3,153.2 TPS.
With SQL Server we saw an aggregate score of 14.75ms with individual VMs ranging from 14ms to 15ms.
Sysbench MySQL Performance
Our first local-storage application benchmark consists of a Percona MySQL OLTP database measured via SysBench. This test measures average TPS (Transactions Per Second), average latency, and average 99th percentile latency as well.
Each Sysbench VM is configured with three vDisks: one for boot (~92GB), one with the pre-built database (~447GB), and the third for the database under test (270GB). From a system resource perspective, we configured each VM with 16 vCPUs, 60GB of DRAM and leveraged the LSI Logic SAS SCSI controller.
Sysbench Testing Configuration (per VM)
- CentOS 6.3 64-bit
- Percona XtraDB 5.5.30-rel30.1
- Database Tables: 100
- Database Size: 10,000,000
- Database Threads: 32
- RAM Buffer: 24GB
- Test Length: 3 hours
- 2 hours preconditioning 32 threads
- 1 hour 32 threads
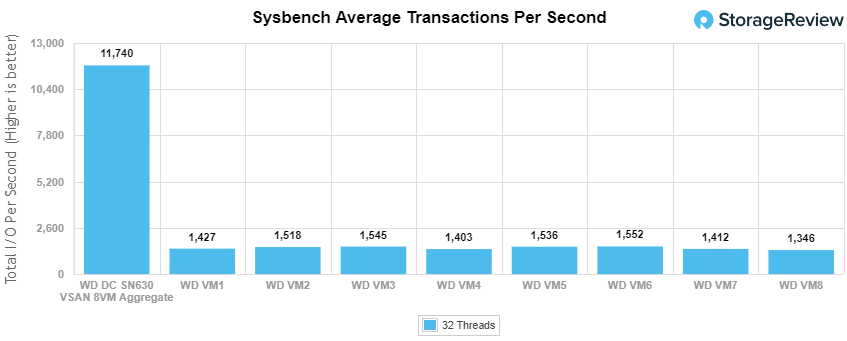
With the Sysbench OLTP we tested 8VM and got an aggregate score of 11,739.7 TPS with individual VMs ranging from 1,326 TPS to 1,552.3 TPS.
With Sysbench latency the server had an average of 21.86ms.

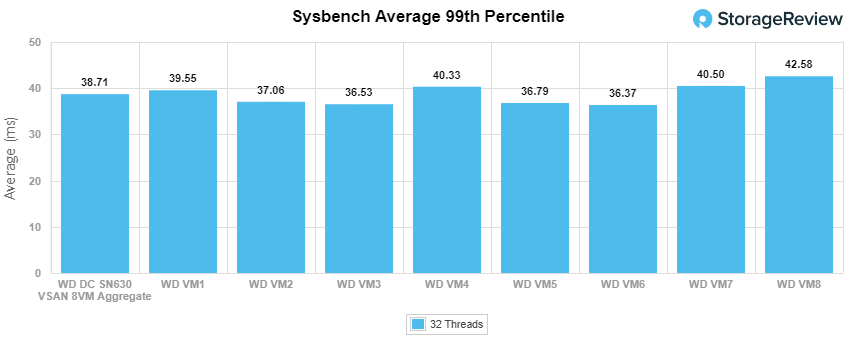
In our worst-case scenario (99th percentile) latency the Western Digital drives gave us 38.71ms.
VDBench Workload Analysis
When it comes to benchmarking storage arrays, application testing is best, and synthetic testing comes in second place. While not a perfect representation of actual workloads, synthetic tests do help to baseline storage devices with a repeatability factor that makes it easy to do apples-to-apples comparison between competing solutions. These workloads offer a range of different testing profiles ranging from “four corners” tests, common database transfer size tests, as well as trace captures from different VDI environments. All of these tests leverage the common vdBench workload generator, with a scripting engine to automate and capture results over a large compute testing cluster. This allows us to repeat the same workloads across a wide range of storage devices, including flash arrays and individual storage devices.
Profiles:
- 4K Random Read: 100% Read, 128 threads, 0-120% iorate
- 4K Random Write: 100% Write, 64 threads, 0-120% iorate
- 64K Sequential Read: 100% Read, 16 threads, 0-120% iorate
- 64K Sequential Write: 100% Write, 8 threads, 0-120% iorate
- Synthetic Database: SQL and Oracle
- VDI Full Clone and Linked Clone Traces
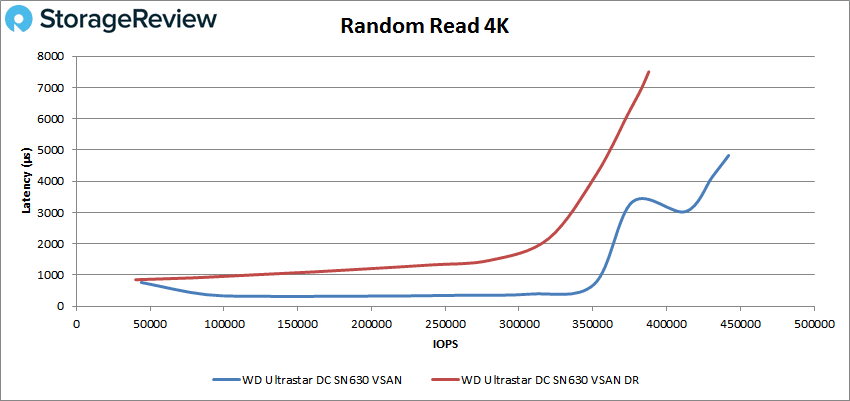
In all of our VDBench tests we tested the Western Digital drives with DR turned on and off. With random 4K read both configurations started off under 1ms with the DR version popping over and peaking at 387,937 IOPS with a latency of 7.5ms. With DR off the drives stayed under 1ms until just north of 350K IOPS and peaked at 442,089 IOPS with a latency of 4.8ms.
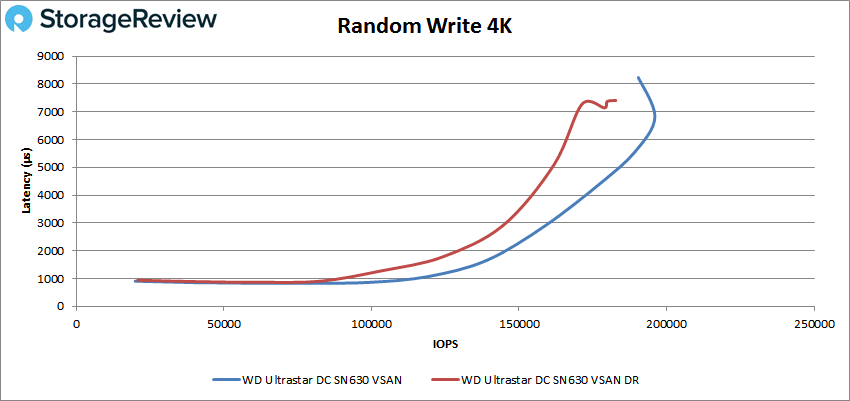
For 4K write again both configurations started just under 1ms. The DR version had sub-millisecond latency until about 90K IOPS and went on to peak at 182,791 IOPS with a latency of 7.4ms. With DR off we saw the drives stay under 1ms until about 110K IOPS and peak at 196,027 IOPS with about 7ms latency before dropping off some.
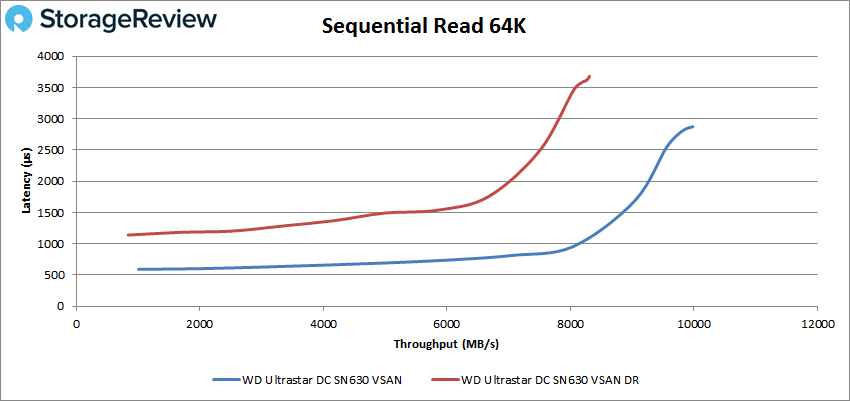
Next up is our sequential workloads. In 64K read the DR version started above 1ms and peaked at 132,918 IOPS or 8.3GB/s with 3.7ms latency. With DR off the drives stayed under 1ms until about 130K IOPS or about 8GB/s and peaked at 159,681 IOPS or 9.98GBs at 2.87ms latency.
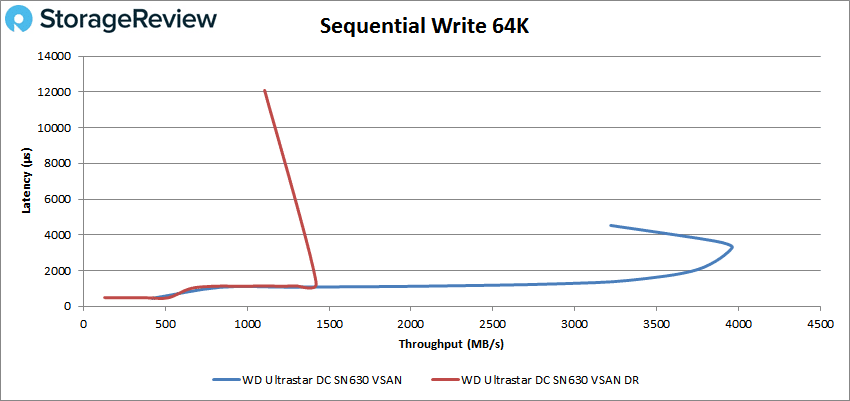
In 64K write both configurations started with sub-millisecond latency but quickly went over 1ms. With DR on we saw a peak at only 22.7K IOPS or about 1.4GB/s and a latency of 1.32ms before a drop off in performance and a large latency spike. With DR off the drives peaked at 63,347 IOPS or about 4GB/s at 3.3ms before dropping off some.
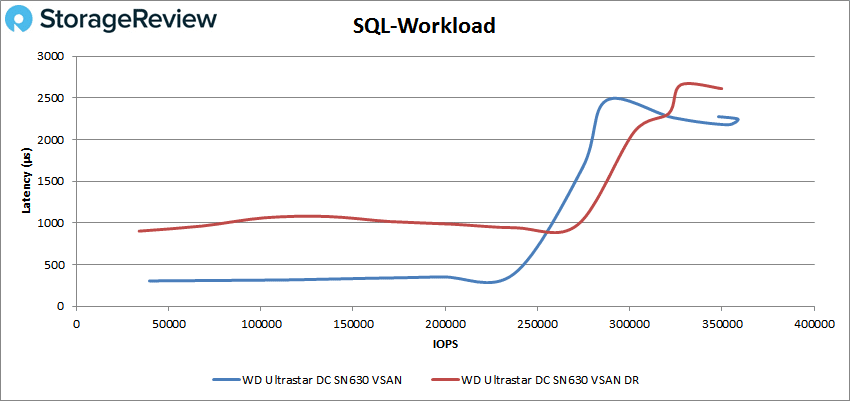
Our next set of tests are our SQL workloads: SQL, SQL 90-10, and SQL 80-20. For SQL both configurations started below 1ms with the DR version going above and then below 1ms throughout going on to peak at 349,851 IOPS at 2.6ms latency. With DR off the drives had sub-millisecond latency until about 255K IOPS and went on to peak at 358,787 IOPS with a latency of 2.24ms before a slight drop.
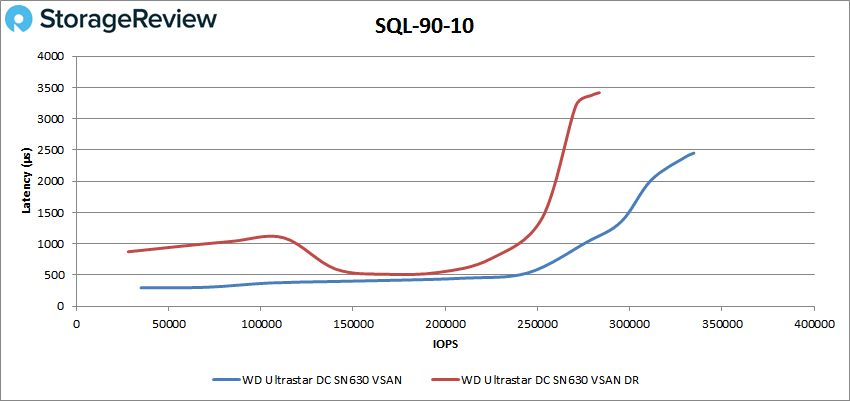
With SQL 90-10 we again saw the DR enabled version pop above and drop below the 1ms line a few times before peaking at 283,524 IOPS at 3.42ms latency. The non-DR version stayed below 1ms until about 275K IOPS and peaked at 334,737 IOPS with a latency of 2.45ms.
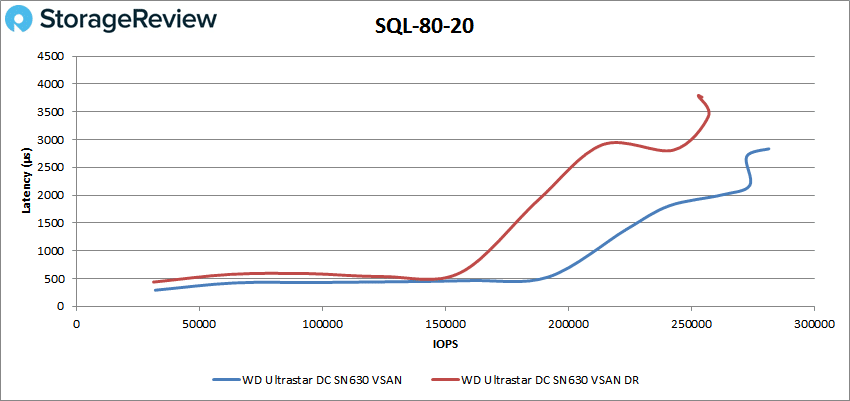
SQL 80-20 saw both configurations start off with sub-millisecond latency with the DR version going over 1ms at about 155K IOPS and peaking at 256,926 IOPS at a latency of 3.5ms. The non-DR version made it to about 210K IOPS under 1ms and went on to peak at 281,562 IOPS with a latency of 2.83ms.
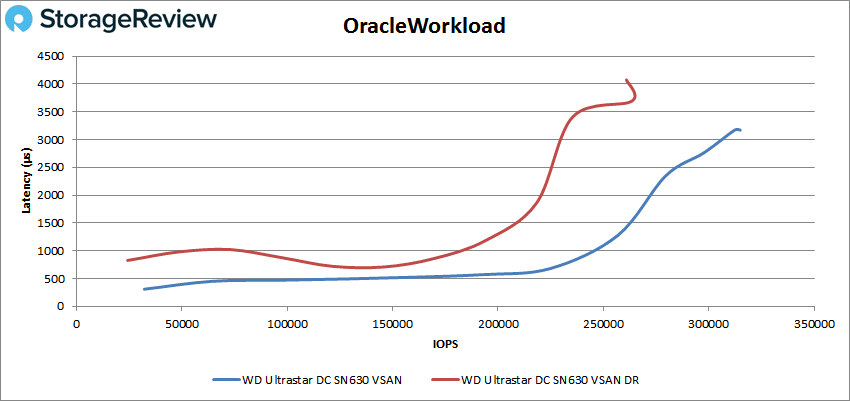
Next up are our Oracle workloads: Oracle, Oracle 90-10, and Oracle 80-20. With Oracle the DR-enable version swung below and above 1ms and peaked at about 264K IOPS at 3.7ms before dropping off slightly. The non-DR version had sub-millisecond latency until about 250K IOPS and peaked at 314,954 IOPS 3.17ms.
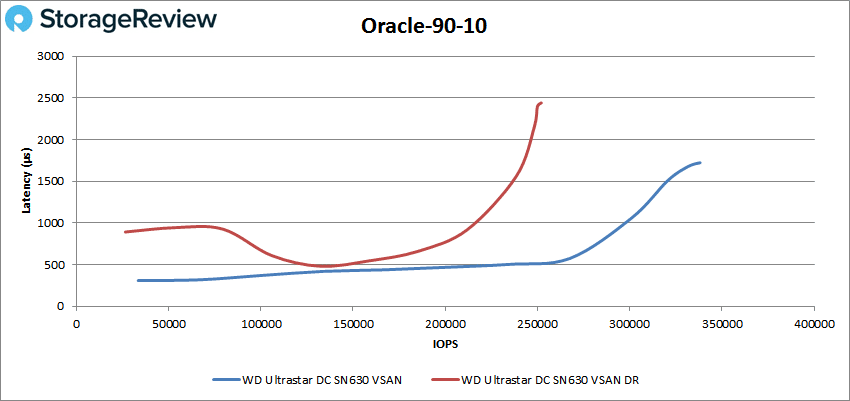
SQL 90-10 saw the DR-enable version stay under 1ms until about 225K IOPS and peak at 252,034 IOPS at a latency of 2.44ms. The non-DR had sub-millisecond latency performance until about 300K IOPS and peaked at 338,146 IOPS with a latency of 1.72ms.
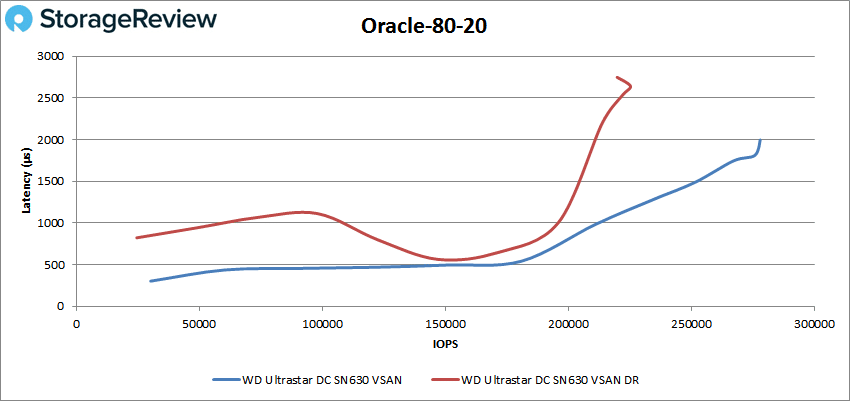
With SQL 80-20 The DR version makes a few swings around 1ms and peaked at 225,327 IOPS with a latency of 2.64ms. The non-DR version had sub-millisecond latency until about 211K IOPS and went on to peak at 278,051 IOPS and a latency of 2ms.
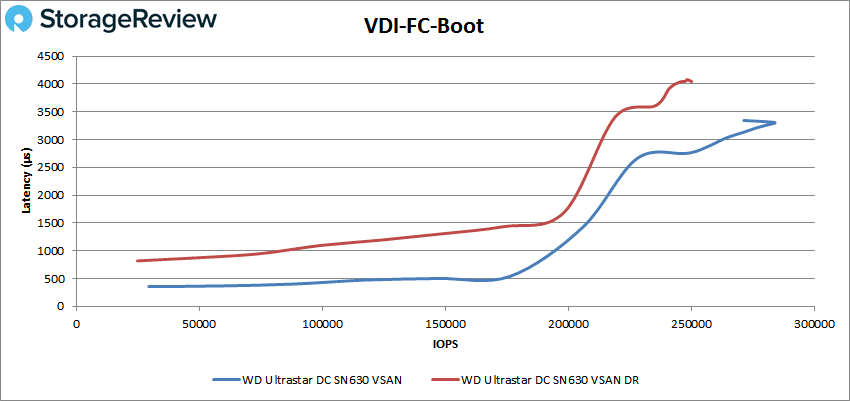
Next, we switched over to our VDI clone test, Full and Linked. For VDI Full Clone (FC) Boot, both configurations started below 1ms with the DR version going above sub-millisecond latency at about 85K IOPS and going on to peak at 250,209 IOPS and a latency of 4.04ms. The non-DR version stayed under 1ms until about 200K IOPS and peaked at 283,786 IOPS and a latency of 3.31ms before dropping off slightly.
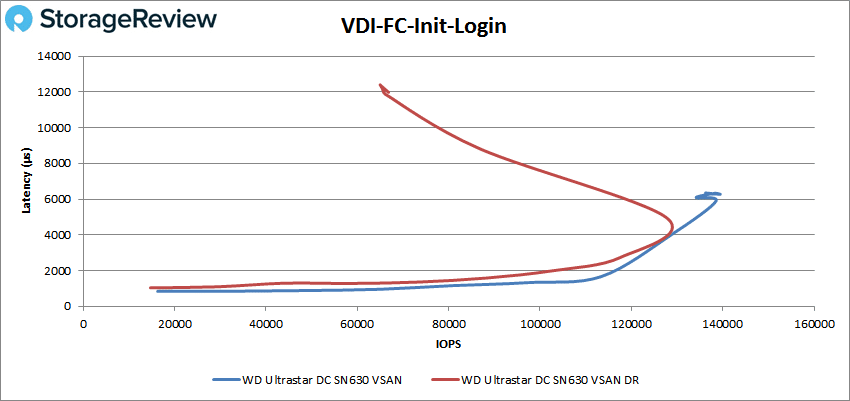
With VDI FC Initial Login the DR version peaked at about 129K IOPS at 4.2ms before dropping performance and spiking latency significantly. The non-DR version started below 1ms and stayed there until about 75K IOPS and peaked at 139,401 IOPS with a latency of 6.3ms with a slight drop off.
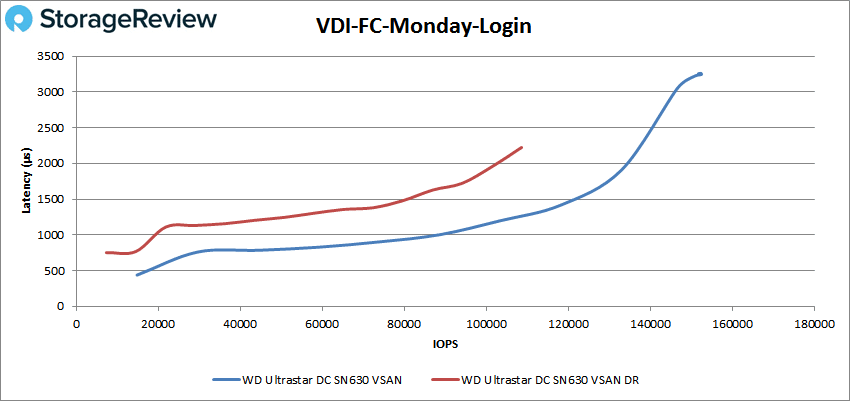
VDI FC Monday Login had the DR version start off under 1ms but quickly popped over it and peaked at 108,611 IOPS with a latency of 2.22ms. The non-DR version stayed under 1ms until just shy of 90K IOPS and peaked at 152,516 IOPS with a latency of 3.25ms.
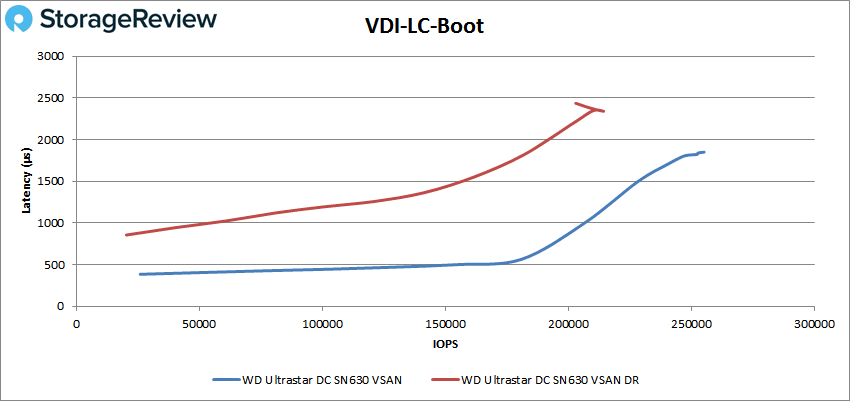
For VDI LC Boot the both configurations started below 1ms with the DR popping up right away and going on to peak at 214,327 IOPS at 2.34ms latency. The non-DR version stayed under 1ms until about 205K IOPS and peaked at 255,235 IOPS and a latency of 1.85ms.
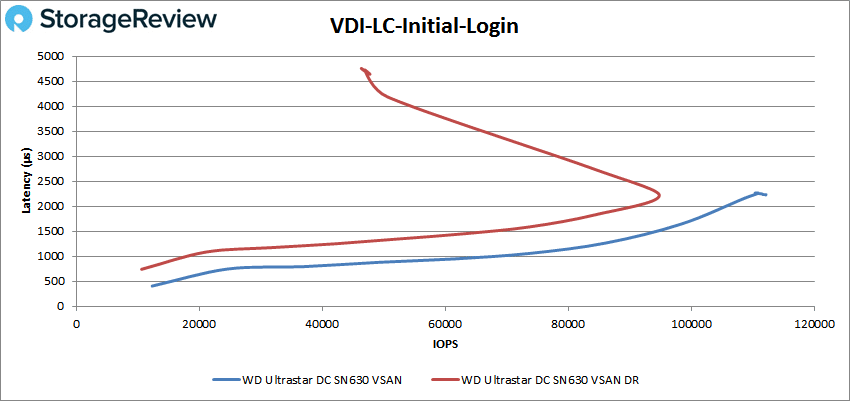
VDI LC Initial Login saw the DR version peak at about 95K IOPS with a 2.2ms latency before dropping off significantly. The non-DR version stayed below 1ms until roughly 65K IOPS and peaked at 112,182 IOPS at a latency of 2.23ms.
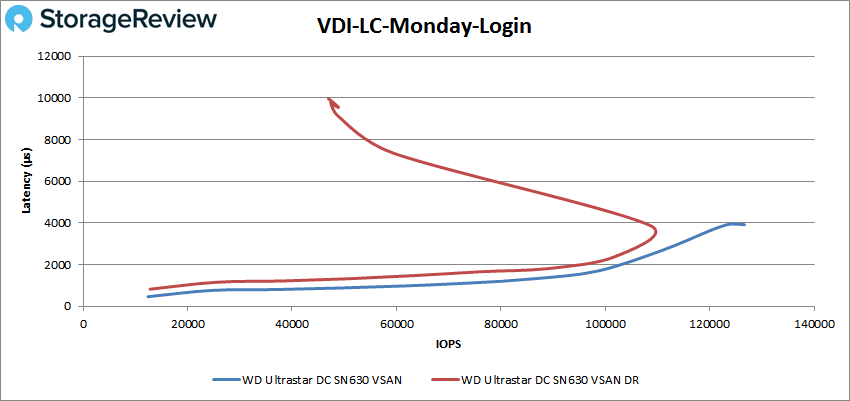
Finally VDI LC Monday Login painted a similar picture to the above with the DR version peaking at about 108K IOPS with a latency of about 3.7ms before dropping quite a bit. The non-DR version had sub-millisecond latency until about 65K IOPS and peaked at 126,656 IOPS at a latency of 3.91ms.
Conclusion
The Western Digital Ultrastar DC SN630 is the new data center NVMe SSD that comes in two flavors: read-centric and mixed-use. The drives come in capacity ranges from 800GB-6.4TB for the mixed-use and 960GB-7.68TB for the read-centric. The drive leverages Western Digital’s controller, firmware, and 64-Layer BiCS 3D NAND. All drives offer ISE, which is great for redeployment or retirement. Another security feature is the use of secure firmware downloads with RSA authentication to ensure the SN630 runs authentic firmware only. Since the SN630 is vSAN certified, we tested it within the context of VMware vSAN to see how it performed.
For performance, we ran the Western Digital DC SN630 NVMe SSD through our Application Workload Analysis and our VDBench Workload Analysis. For Application Workload Analysis the drives put up some good numbers. In SQL Server the SN630 had an aggregate transactional score of 12,610.3 TPS and an aggregate average latency of 14.8ms. With Sysbench, the SN630 hit 11,739.7 TPS, an average latency of 21.86ms, and in our worst-case scenario the drives gave us an aggregate score of 38.71ms.
In our VDBench Workloads we tested the drives with their DR turned on as well as off. Obviously the DR being off will result in better performance, however, several customers need to run DR on and it is good to get an idea of how the drives will perform with DR on. Highlights for DR being off include 442K IOPS in 4K read, 196K IOPS 4K write, 9.98GB/s in 64K read and 4GB/s 64K write. In our SQL workloads we saw 359K IOPS, 335K IOPS in SQL 90-10, and 282K IOPS in SQL 80-20. For Oracle we saw peak performance as high as 315K IOPS, 338K IOPS in Oracle 90-10, and 278K IOPS in Oracle 80-20. In our VDI clone test the SN630 gave us 284K IOPS in boot, 139K IOPS in Initial Login, and 153K IOPS in Monday Login for full clone. In linked clone the SN630 hit 255K IOPS boot, 112K IOPS in Initial Login, and 127K IOPS in Monday Login.
For our VDBench workloads with DR enable the SN630 had highlights of 388K IOPS in 4K read, 183K IOPS 4K write, 8.3GB/s in 64K read and 1.4GB/s 64K write. In our SQL workloads we saw 350K IOPS, 283K IOPS in SQL 90-10, and 257K IOPS in SQL 80-20. For Oracle we saw peak performance as high as 264K IOPS, 252K IOPS in Oracle 90-10, and 225K IOPS in Oracle 80-20. In our VDI clone test the SN630 gave us 220K IOPS in boot, 129K IOPS in Initial Login, and 109K IOPS in Monday Login for full clone. In linked clone the SN630 hit 214K IOPS boot, 95K IOPS in Initial Login, and 108K IOPS in Monday Login.
When used within VMware vSAN, the Western Digital DC SN630 SSD provides impressive performance even with the DR turned on. In this case we leveraged a modest server build and still saw impressive results. The SN630 would be a good choice for those that utilize vSAN.
WD Ultrastar DC SN630 Product Page
Sign up for the StorageReview newsletter
*The performance testing on which this review was based was commissioned by Western Digital