

Last month AMD launched its second generation of its EPYC Processors, AMD EPYC 7002, also known as EPYC Rome. The new CPUs are being heavily embraced by the industry as they bring the promise of much more performance compared to Intel, even single socket Rome versus dual socket Intel. We did a review for release day that proved out the claimed performance form AMD. Now we will be taking the same GIGABYTE platform to test various AMD EPYC 7002 CPUs (7702P, 7402P, and 7302P) to better help users understand which one they need for their workload.
At launch, VMware did not yet fully support the new CPUs (vSphere 6.7 U3 now does) so we couldn’t do the normal barrage of tests we typically run. Also, AMD released 19 different model numbers each with various benefits including cores and threads. Instead of testing every possible variation, we decided on three different CPUs in a VMware environment to test for this review. In this case we are using the AMD EPYC 7702P, the AMD EPYC 7402P, and the AMD EPYC 7302P. This isn’t a “which one is better” type of review as the one with the higher core count is going to perform better in most cases. It’s meant to show the scale of what AMD can deliver with the latest EPYC CPUs.
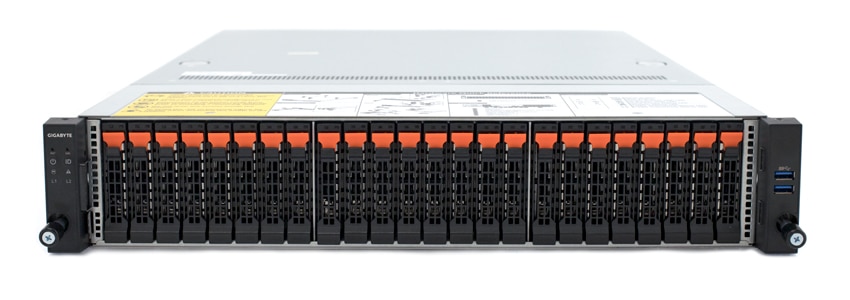
The test platform consists of the Gigabyte R272-Z32 which for more information on it, one can just click the link to our previous review. The only difference is that we are now using 512GB of RAM for the Sysbench, needed for the footprint of 8VMs. The platform still has the 12 Micron NVMe SSDs installed, of which we are using 4 NVMe drives in the SQL test and 8 NVMe drives in the Sysbench test. For the hypervisor, we are using the newly released VMware ESXi 6.7 Update 3.
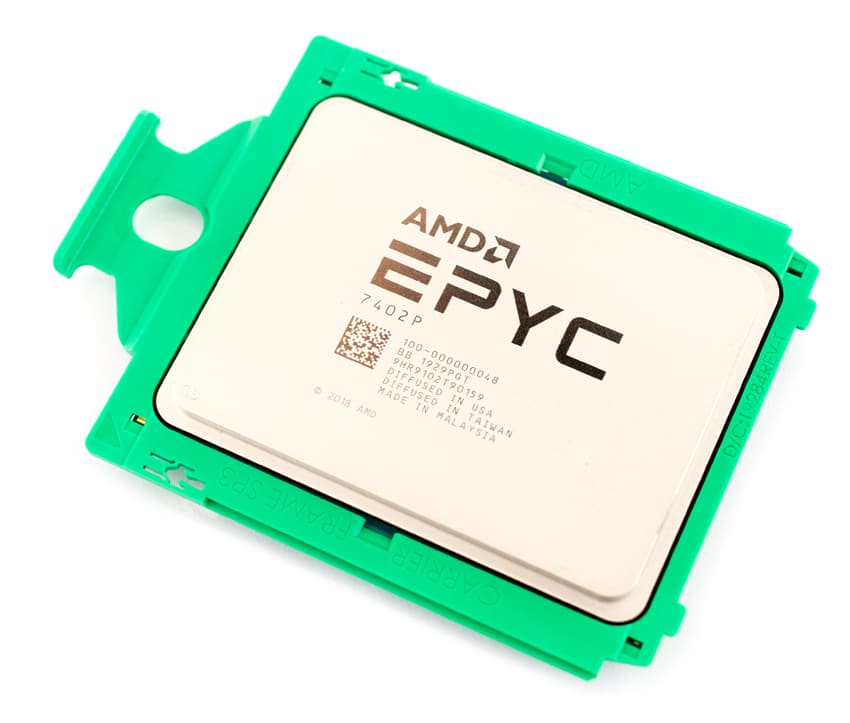
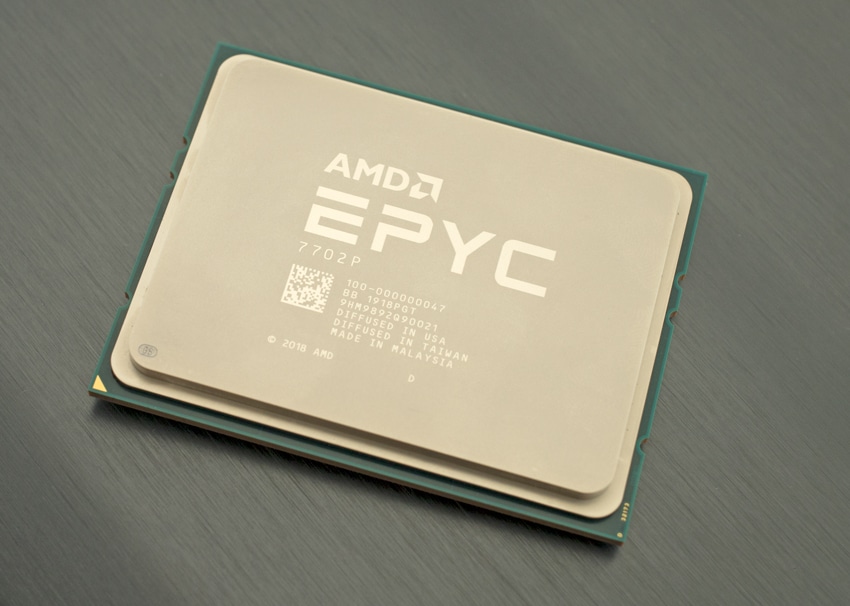
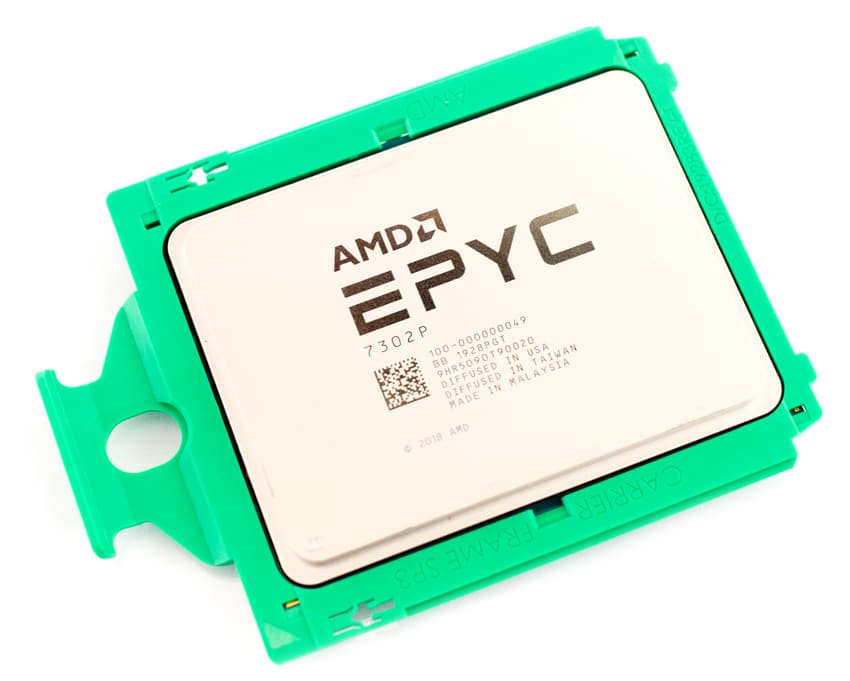
To look a little deeper into the CPUs, The AMD EPYC 7702P has 64 cores and 128 threads as well as base GHz of 2.0. The 7402P has 24 cores, 48 threads, and a base frequency of 2.8GHz. The 7302P has 16 cores, 32 threads, and a base frequency of 3GHz. Core count and clock speed are the main differentiators here. Sysbench is more of a measure of aggregate CPU performance (think clockspeed x core count) while SQL Server is more about meeting minimum needs and if it can, it performs well. In all of our charts we include the aggregate compute speed of each CPU.
Performance
SQL Server Performance
StorageReview’s Microsoft SQL Server OLTP testing protocol employs the current draft of the Transaction Processing Performance Council’s Benchmark C (TPC-C), an online transaction processing benchmark that simulates the activities found in complex application environments. The TPC-C benchmark comes closer than synthetic performance benchmarks to gauging the performance strengths and bottlenecks of storage infrastructure in database environments.
Each SQL Server VM is configured with two vDisks: 100GB volume for boot and a 500GB volume for the database and log files. From a system resource perspective, we configured each VM with 16 vCPUs, 64GB of DRAM and leveraged the LSI Logic SAS SCSI controller. While our Sysbench workload saturates the platform in both storage I/O and capacity, the SQL test looks for latency performance.
This test uses SQL Server 2014 running on Windows Server 2012 R2 guest VMs, and is stressed by Quest Software’s Benchmark Factory for Databases. While our traditional usage of this benchmark has been to test large 3,000-scale databases on local or shared storage, in this iteration we focus on spreading out four 1,500-scale databases evenly across our servers.
SQL Server Testing Configuration (per VM)
- Windows Server 2012 R2
- Storage Footprint: 600GB allocated, 500GB used
- SQL Server 2014
- Database Size: 1,500 scale
- Virtual Client Load: 15,000
- RAM Buffer: 48GB
- Test Length: 3 hours
- 2.5 hours preconditioning
- 30 minutes sample period
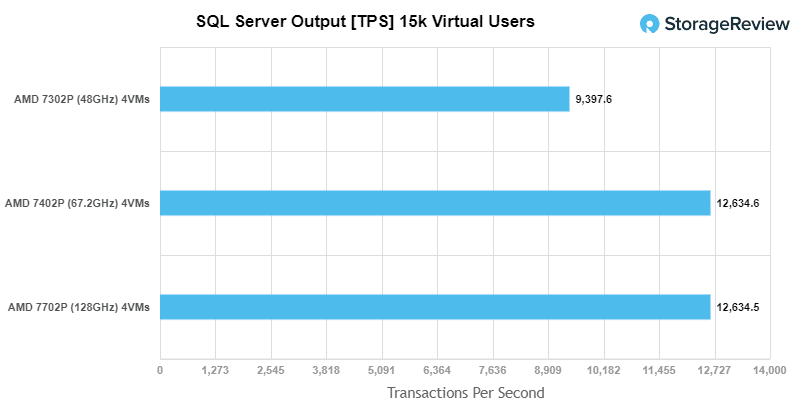
For our transactional SQL Server using 4VMs the 7702P saw an aggregate score of 12,634.5 TPS with individual VMs range from 3,157.9 TPS to 3,159.7 TPS. The 7402P had near identical aggregate TPS of 12,634.6 with individual VMs ranging from 3,157.9 TPS to 3,159.8 TPS. The 7302P had an aggregate score of 9,397.6 TPS with individual VMs ranging from 2,006 TPS to 2,671 TPS.
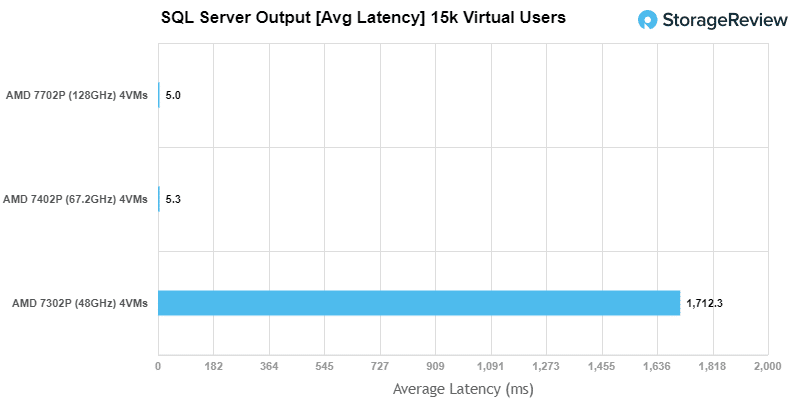
For SQL Server average latency the 7702P had an aggregate score of 5ms with individual VMs ranging from 4ms to 6ms. The 7402P had an aggregate score of 5.25ms with VMs ranging from 3ms to 6ms. The 7302P had an aggregate score of 1,712ms with individual VMs ranging from 872ms to 2,736ms.
Sysbench MySQL Performance
Our Percona MySQL OLTP database measured via SysBench. This test measures average TPS (Transactions Per Second), average latency, and average 99th percentile latency as well.
Each Sysbench VM is configured with three vDisks: one for boot (~92GB), one with the pre-built database (~447GB), and the third for the database under test (270GB). From a system resource perspective, we configured each VM with 16 vCPUs, 60GB of DRAM and leveraged the LSI Logic SAS SCSI controller.
Sysbench Testing Configuration (per VM)
- CentOS 6.3 64-bit
- Percona XtraDB 5.5.30-rel30.1
- Database Tables: 100
- Database Size: 10,000,000
- Database Threads: 32
- RAM Buffer: 24GB
- Test Length: 3 hours
- 2 hours preconditioning 32 threads
- 1 hour 32 threads
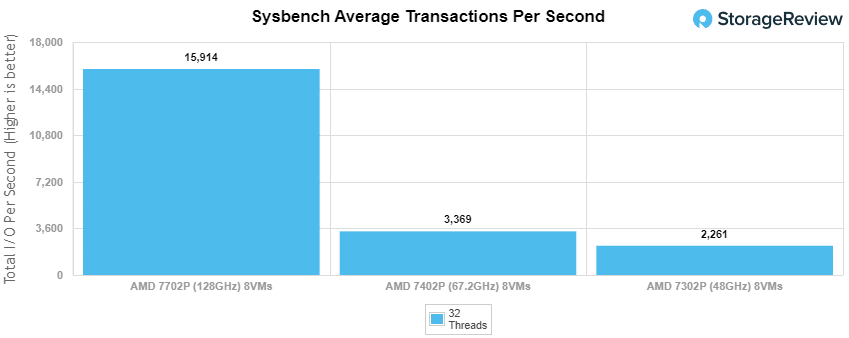
For Sysbench we tested 8VMs and saw aggregate scores of 15,914 TPS for the 7702P, 3,369.3 TPS for the 7402P, and 2,261.3 TPS for the 7302P.
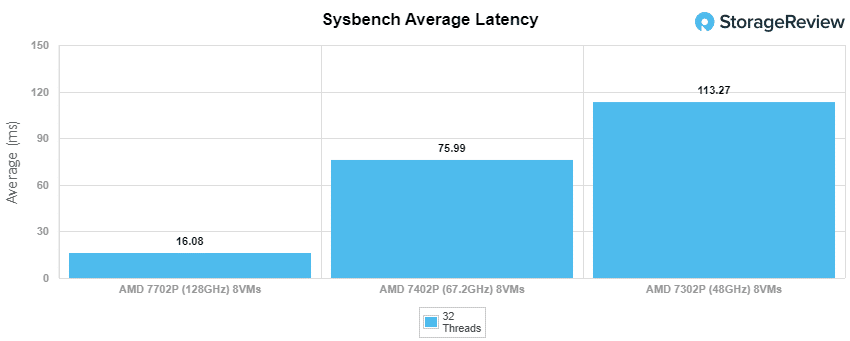
For Sysbench average latency we saw aggregate scores of 16ms for the 7702P, 76ms for the 7402P, and 113.3ms for the 7302P.
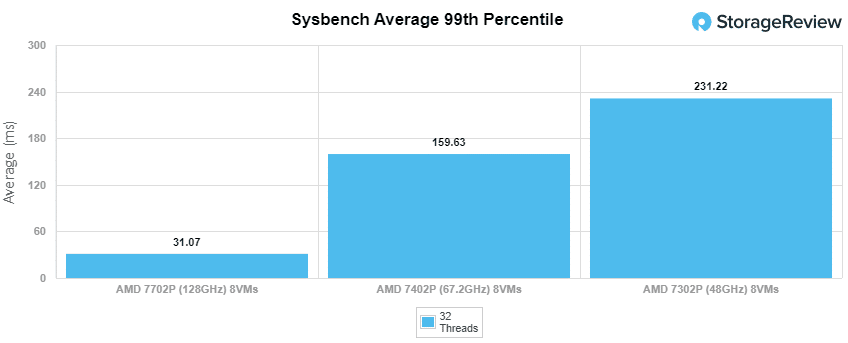
In our worst-case scenario (99th percentile) latency we saw scores of 31.1ms for the 7702P, 159.6ms for the 7402P, and 231.2ms for the 7302P.
Conclusion
The AMD EPYC 7002 came out with the promise of more performance with fewer sockets. Now that VMware fully supports the new CPUs, we continue with our testing to show the promise of the new processors. For this review we were able to test three distinct AMD EPYC CPUs in a traditional VMware environment. This testing wasn’t to show which is better, that is typically the one with the highest core count. Instead we tested the different CPUs for readers to get an idea what to expect, so they can better choose the processor that is right for their use case.
For performance we tested the AMD EPYC 7702P, the AMD EPYC 7402P, and the AMD 7302P in both SQL Server and Sysbench. We used 4VMs and 4 NVMe drives for SQL Server and 8VMs and 8 NVMe drives for Sysbench. The 64 core 7702P was, unsurprisingly the top performer with SQL aggregate scores of 12,634 TPS and an average latency of 5ms and Sysbench saw the CPU with an aggregate of 15,914 TPS, an average latency of 16ms, and a 99th percentile latency of 31.1ms. The 7402P had SQL scores of 12,634 TPS and an average latency of 5.25ms and Sysbench gave the processor scores of 3,369.3 TPS, 76ms average latency, and a 99th percentile latency of 159.6ms. The 16 core 7302P had SQL scores of 9,397.6 TPS, with an average latency of 1,712ms; for Sysbench the CPU saw 2,261.3 TPS, an average latency of 113.3ms, and a 99th percentile latency of 231.2ms.
As one can see form the results above, the AMD EPYC CPU family continues to impress. As we continue our testing across the new EPYC platforms that come out and expand the scope of applications, it will be interesting to see how well these stack up against traditional Intel dual socket configurations. Perhaps more impactful though will be the ability to use single processor systems effectively in software defined use cases, like VMware vSAN, where licensing is tied to CPU sockets. In these cases AMD has the opportunity to provide even more value to solutions providers, besides being a lower cost part.


 Amazon