

The Samsung 970 Pro 1TB is the largest capacity model of the company’s newest high-performing consumer M.2 NVMe SSD line. We previously reviewed the 512GB version, and though it had a strong showing, we were expecting it to be a bit faster. To show best-case performance we’ve wrapped up testing of the larger 1TB model, which as you will soon find out impressed us even more.
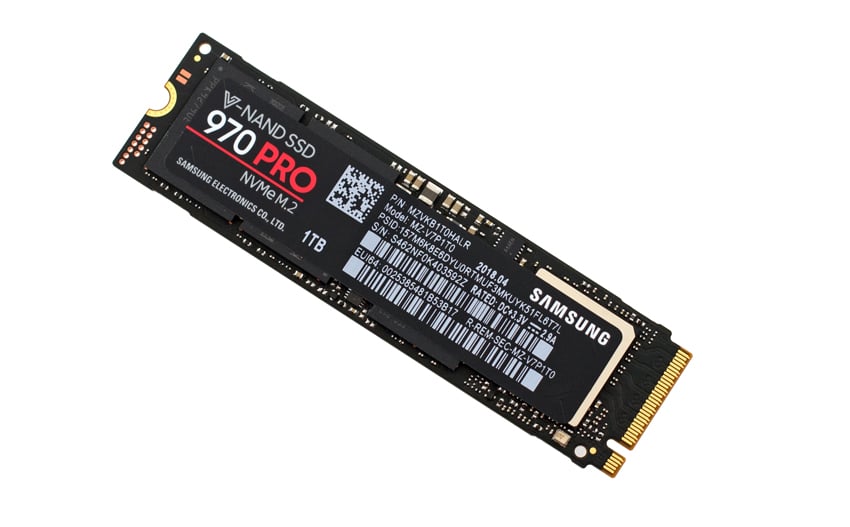
Over the past several years, Samsung’s EVO and PRO lines have been a fierce leader in the consumer SSD market (with a few minor hiccups along the way) due to their attractive price-per-performance ratio. For the most part, Samsung keeps upping their game with each new iteration, and the 1TB 970 PRO certainly continues this trend. Quoted with potential speeds of 3.5GB/s read, 2.7GB/s write, and upwards of 500,000 IOPS in both random reads and writes, these are some of the highest numbers we’ve seen so far on the consumer market. As such, the 970 PRO is an ideal drive prosumers, hardcore gamers, data analytics, and media professionals who 3D and 4K projects under high workloads.
To reach this performance, 970 PRO uses Samsung’s 2-bit MLC V-NAND and is outfitted with the newest generation Phoenix controller. This new controller is coated in nickel to dissipate heat faster and enable higher sustained performance. Moreover, this generation of V-NAND offers up to 1,200 TBW in endurance, which is almost a 50% increase over previous generations. Its tiny M.2 form factor gives it lots of flexibility as well, allowing for easy installation in any desktop, notebook or ultrabook.
The Samsung SSD 970 PRO comes with a 5-year limited warranty and has a MSRP of $329.99 for the 512GB and $629.99 for the 1TB.
Samsung 970 Pro 1TB Specifications
| Form factor | M.2 2280 | |
| Capacity | 512GB | 1TB |
| Controller | Samsung Phoenix Controller | |
| NAND | Flash Memory Samsung V-NAND 2bit MLC | |
| Interface | PCIe Gen 3.0×4, NVMe 1.3 | |
| Performance | ||
| Sequential Read | 3,500MB/s | |
| Sequential Write | 2,300MB/s | 2,700MB/s |
| Random read QD 32 Thread 4 | 370K IPOS | 500K IOPS |
| Random write QD 32 Thread 4 | 500K IOPS | |
| Power Consumption | ||
| Max | 30mW | |
| Active Read | 5.2W | |
| Active Write | 5.2W | 5.7W |
| DEVSLP La.3 mode | 5mW | |
| Reliability | ||
| Operating Temperature | 0°C to 70°C | |
| Non-operating Temperature | -45°C to 85°C | |
| Humidity | 5% to 95% | |
| Shock | 1,500G(Gravity), duration: 0.5ms, 3 axis | |
| Vibration | 20~2,000Hz, 20G | |
| MTBF | 1.5 million hours | |
| Warranty | 5-year, limited | |
| Dimensions | Max 80.15 x Max 22.15 x Max 2.38(mm) | |
Performance
Testbed
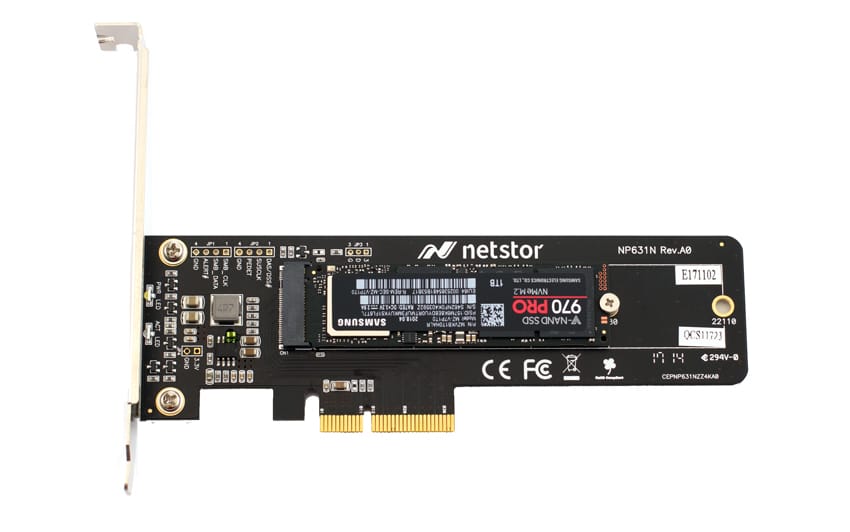
The test platform leveraged in these tests is a Dell PowerEdge R740xd server. We measure SATA performance through a Dell H730P RAID card inside this server, although we set the card in HBA mode only to disable the impact of RAID card cache. NVMe is tested natively through an M.2 to PCIe adapter card. The methodology used better reflects end-user workflow with the consistency, scalability and flexibility testing within virtualized server offers. A large focus is put on drive latency across the entire load range of the drive, not just at the smallest QD1 (Queue-Depth 1) levels. We do this because many of the common consumer benchmarks don’t adequately capture end-user workload profiles.
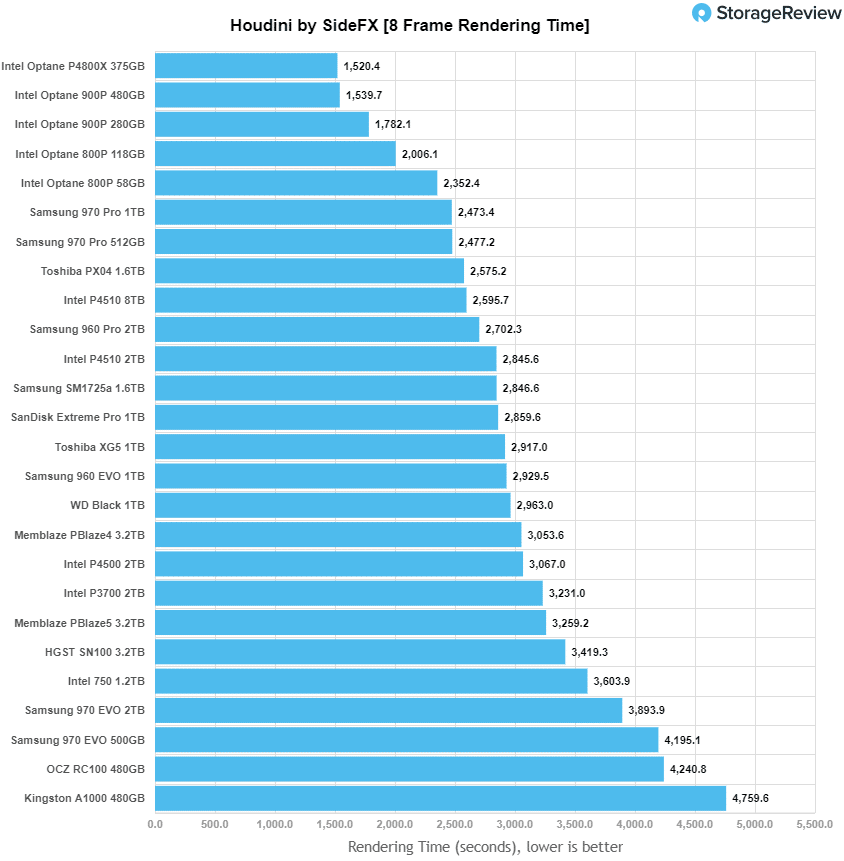
Houdini by SideFX
The Houdini test is specifically designed to evaluate storage performance as it relates to CGI rendering. The test bed for this application is a variant of the core Dell PowerEdge R740xd server type we use in the lab with dual Intel 6130 CPUs and 64GB DRAM. In this case we installed Ubuntu Desktop (ubuntu-16.04.3-desktop-amd64) running bare metal. Output of the benchmark is measured in seconds to complete, with fewer being better.
The Maelstrom demo represents a section of the rendering pipeline that highlights the performance capabilities of storage by demonstrating its ability to effectively use the swap file as a form of extended memory. The test does not write out the result data or process the points in order to isolate the wall-time effect of the latency impact to the underlying storage component. The test itself is composed of five phases, three of which we run as part of the benchmark, which are as follows:
- Loads packed points from disk. This is the time to read from disk. This is single threaded, which may limit overall throughput.
- Unpacks the points into a single flat array in order to allow them to be processed. If the points do not have dependency on other points, the working set could be adjusted to stay in-core. This step is multi-threaded.
- (Not Run) Process the points.
- Repacks them into bucketed blocks suitable for storing back to disk. This step is multi-threaded.
- (Not Run) Write the bucketed blocks back out to disk.
Less means better when looking at the performance of rendering time. Here, the 1TB Samsung 970 PRO had the best non-Optane time with 2,473.4 seconds, which was just slightly better than the 512GB model.
SQL Server Performance
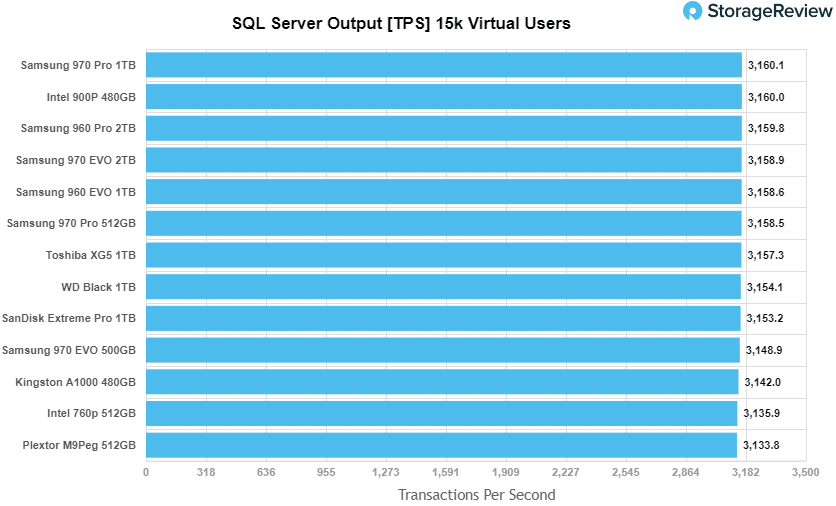
We use a lightweight virtualized SQL Server instance to appropriately represent what an application developer would use on a local workstation. The test is similar to what we run on storage arrays and enterprise drives, just scaled back to be a better approximation for behaviors employed by the end user. The workload employs the current draft of the Transaction Processing Performance Council Benchmark C (TPC-C), an online transaction processing benchmark that simulates the activities found in complex application environments.
The lightweight SQL Server VM is configured with three vDisks: 100GB volume for boot, a 350GB volume for the database and log files, and a 150GB volume used for the database backup we recover after each run. From a system resource perspective, we configure each VM with 16 vCPUs, 32GB of DRAM and leverage the LSI Logic SAS SCSI controller. This test uses SQL Server 2014 running on Windows Server 2012 R2 guest VMs and is stressed by Dell’s Benchmark Factory for Databases.
SQL Server Testing Configuration (per VM)
- Windows Server 2012 R2
- Storage Footprint: 600GB allocated, 500GB used
- SQL Server 2014
- Database Size: 1,500 scale
- Virtual Client Load: 15,000
- RAM Buffer: 24GB
- Test Length: 3 hours
- 2.5 hours preconditioning
- 30 minutes sample period
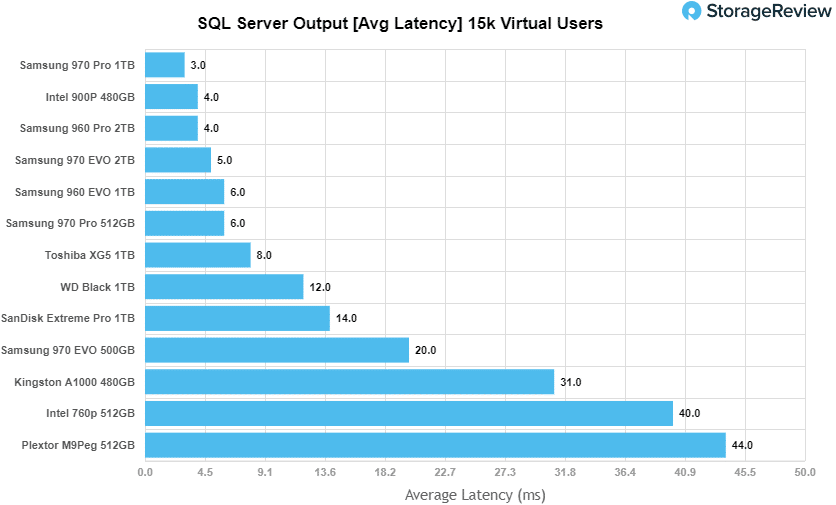
When looking at SQL Server Output, the Samsung 970 PRO 1TB was the top performing drive with 3,160.1 TPS.
Looking at average latency in the same test, the 970 PRO 1TB recorded just 3.0ms placing it at the top of the leader board once again.
VDBench Workload Analysis
For our VDBench tests, you will see a noticeable difference in performance between the mid and top capacity model of the 970 PRO. This isn’t very surprising, as higher capacity Samsung drives of the same line have historically fared much better than the smaller capacities.
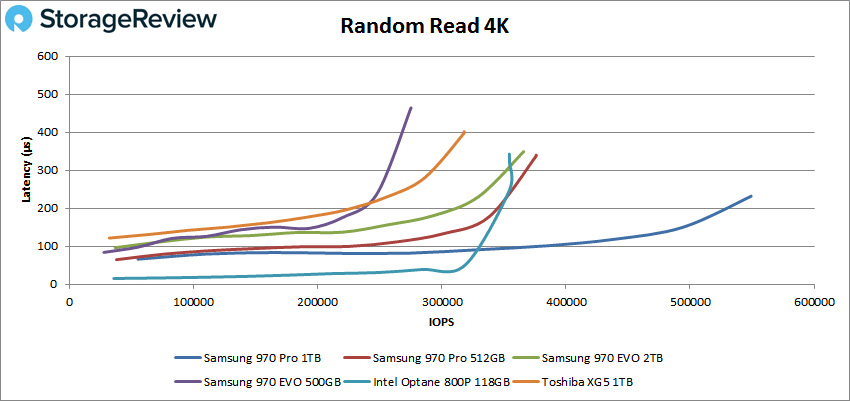
In random 4K peak read performance the 970 PRO 1TB had peak performance of 549,218 IOPS and a latency of 231.6μs placing it 1st by a large margin.
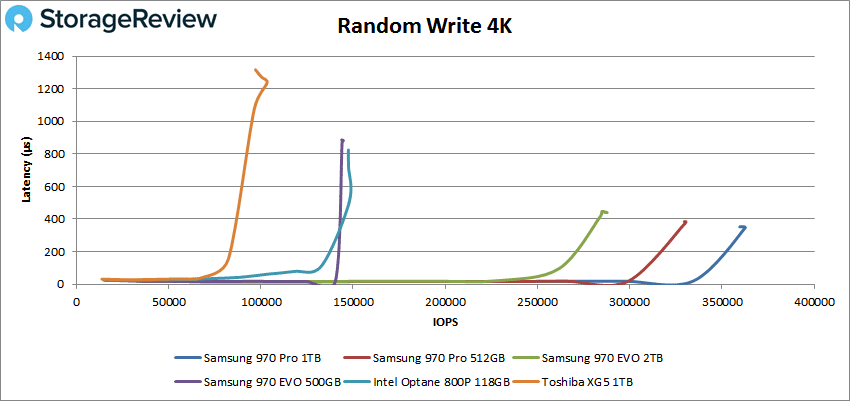
When looking at 4K random write, the 970 PRO 1TB easily had the best overall performance with 362,519 IOPS and a latency of 345μs.
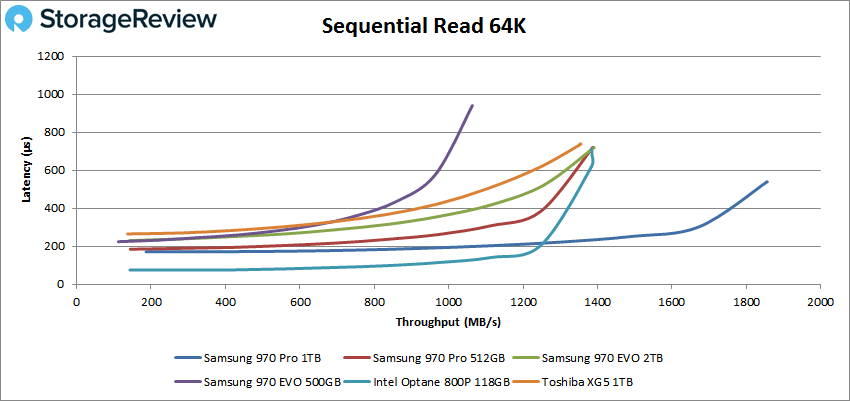
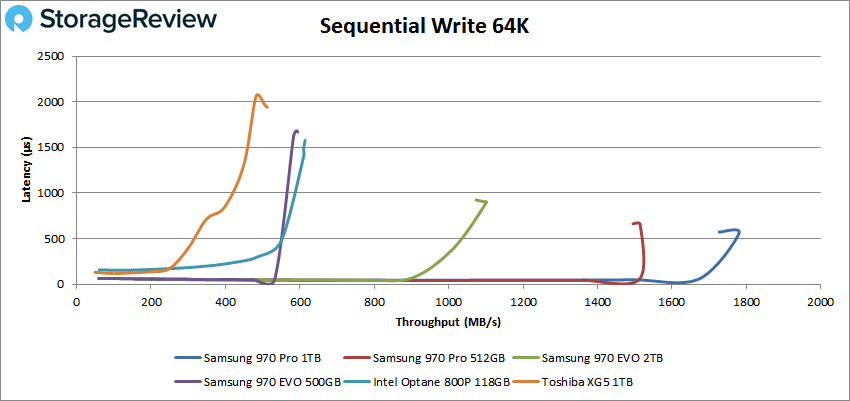
Moving to sequential performance, we first looked at the 64K read benchmark. Here, the 970 PRO 1TB boasted another impressive set of results with 29,697 IOPS (or 1.86GB/s) and a latency of 538.8μs.
With 64K write the 970 PRO 1TB was able to take the top spot again with a peak performance of 28473 IOPS or 1.78GB/s and a latency of 555.1μs.
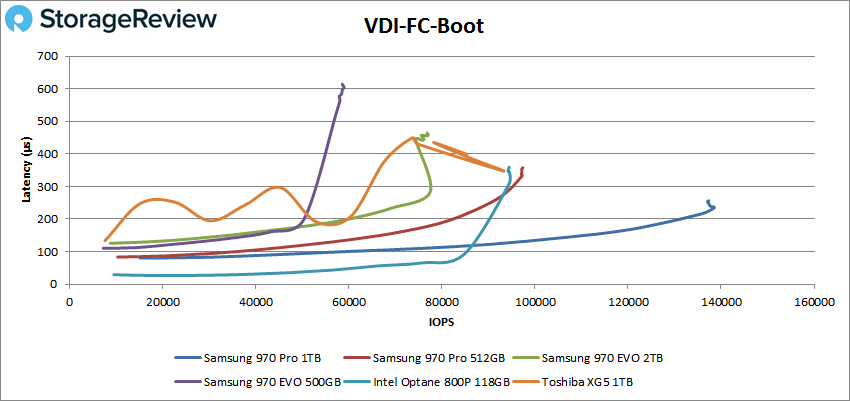
Next, we looked at our VDI benchmarks, which are designed to tax the drives even further. These tests include Boot, Initial Login, and Monday Login. Looking at the Boot test, the 970 PRO 1TB was unsurprisingly at the top of the leader board yet again, with a very impressive 138,475 IOPS and a latency of 234.3μs.
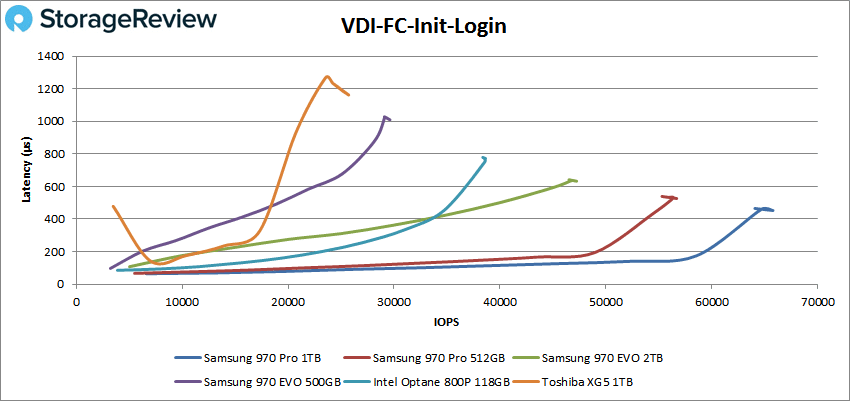
For the VDI Initial Login, the 970 PRO 1TB was able to significantly outperform the lower capacity model again for top spot with 65,794 IOPS and a latency of 452.8μs.
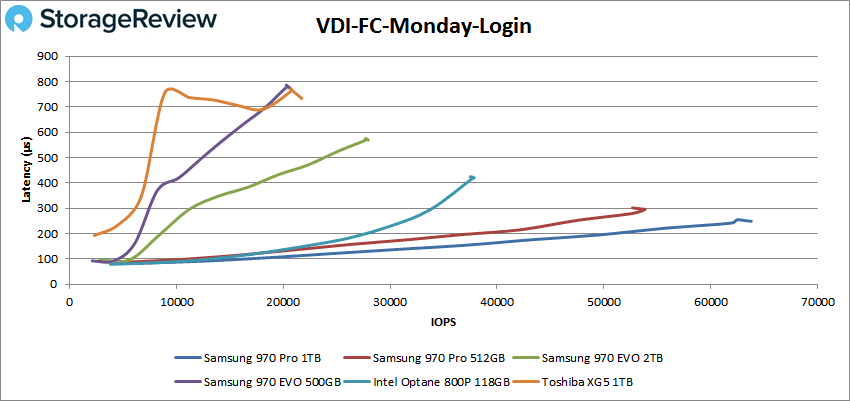
For the final VDI Monday Login, the 970 PRO 1TB ended our tests with an impressive peak performance of 63,804 IOPS and a latency of 238.8μs.
Conclusion
The Samsung 970 PRO line is faster and more reliable than ever. It features a new nickel-plated Phoenix controller, which promotes better performance, and uses Samsung’s latest generation 2-bit MLC V-NAND, which has raised the endurance by almost 50%. At the end of our 512GB 970 PRO review, we mentioned that, while it was a strong showing from Samsung, a higher-capacity model would likely perform even better due to different NAND packaging and utilization. As the above charts show, the 1TB model proved this to be true with huge gains over the smaller capacity drive in the majority of benchmarks.
Diving into its performance demonstrates what this drive can do, including our Houdini test, which boasted the highest non-Optane result of 2,473.4 seconds, 4K reads with 549,218 IOPS, 64K reads with 1.86GB/s, VDI Initial Login with 65,794 IOPS, and VDI Monday Login with 63,804 IOPS. In our SQL benchmarks, the 1TB 970 PRO measured top performing numbers of 3,160.1 TPS and just 3.0ms in average latency. The Samsung is at the top of its game with the 970 PRO, as the clear leader for traditional NAND-based SSDs. The 1TB Samsung 970 PRO posts even stronger results than the 512GB model, setting the bar very high in the consumer M.2 NVMe SSD market with best-of-class performance.


 Amazon