

We last discussed SK hynix back in August as we looked into the history of the company and overviewed their Enterprise SSD solutions. Today we are reviewing and looking at the performance of the SK hynix Enterprise SSD the PE6011. The PE6011 features a U.2 7mm form factor, 3D TLC NAND, PCIe NVMe interface, and capacities up to 7.68 TB. It is ideal for read-intensive workloads and light write usage. What’s unique about this product is that from conceptualization to manufacturing everything is done in-house by SK hynix. This product is aimed at those looking for an economical PCIe solution for the datacenter environment.
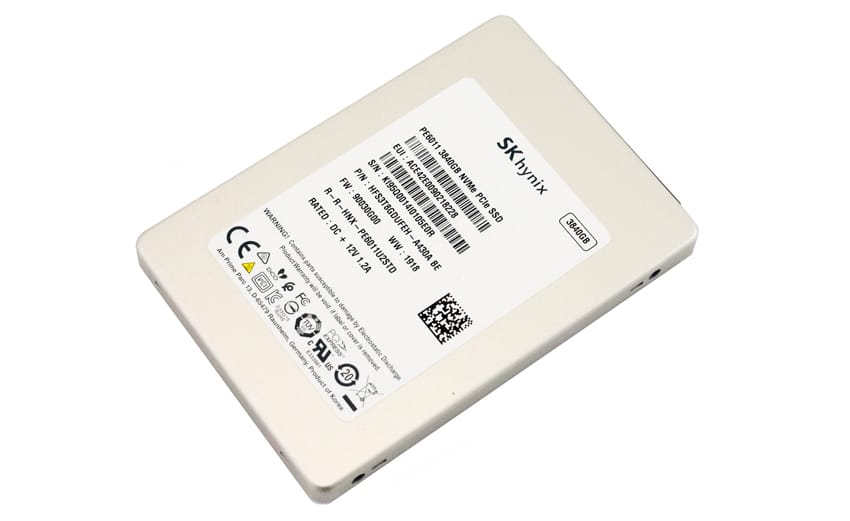
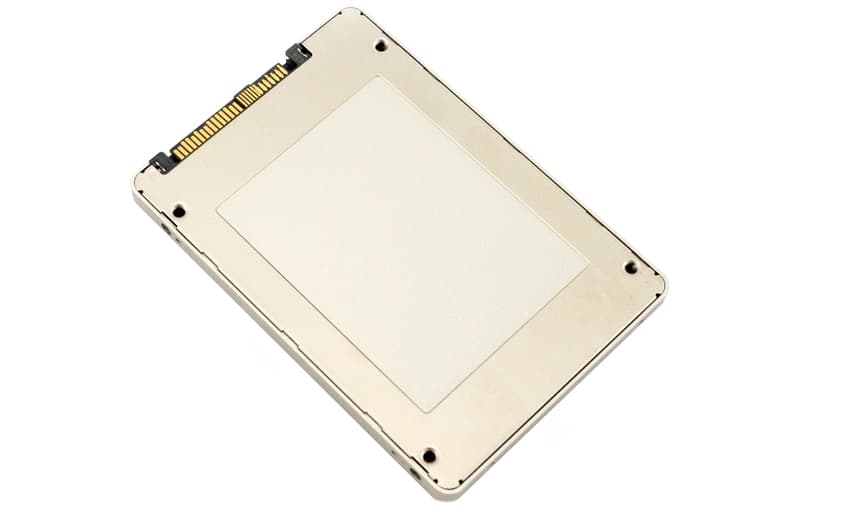
Looking at the design and build of this drive, the entirety of the casing is a polished silver. It is a 2.5″ drive with a U.2 connector and a form factor z-height of 7mm. Being 7mm lends a physically smaller footprint and gives this drive the ability to be equipped and fit in a large variety of things for universal appeal. Branding as well as unique identifying information can be found on the top of the drive.
SK hynix PE6011 Specifications
| Form Factor | U.2 7mm | |||
| Interface | PCIe Gen3x4 / NVMe 1.3 | |||
| NAND | 3D V4 TLC | |||
| Capacity | 960 GB | 1.92 TB | 3.84 TB | 7.68 TB |
| Performance | ||||
| Sequential Read (128KB) | Up to 3,200MB/s | Up to 3,200MB/s | Up to 3,200MB/s | Up to 3,200MB/s |
| Sequential Write (128KB) | Up to 650MB/S | Up to 1,250MB/s | Up to 2,300MB/s | Up to 2,450MB/s |
| Random Read (4KB, QD64) | Up to 220K IOPS | Up to 410K IOPS | Up to 620K IOPS | Up to 620K IOPS |
| Random Write (4KB, QD64) | Up to 27K IOPS | Up to 50K IOPS | Up to 67K IOPS | Up to 70K IOPS |
| QOS 4KB Random Read | 95μs | 95μs | 95μs | 95μs |
| QOS 4KB Random Write | 25μs | 25μs | 25μs | 25μs |
| Security | AES 256 bit encryption | |||
| Endurance | ||||
| MTBF | 2 million hours | |||
| UBER | 1 sector per 10^17 bits read | |||
| Power consumption | ||||
| Active Ready/Write Typical | Up to 14.0W | |||
| Idle | Up to 3.7W | |||
| Allowable voltage | 12.0V ± 5% | |||
| Operating Temperature | 0-70°C | |||
| Shock | 1500G, duration 0.5ms | |||
| Physical | ||||
| Dimensions (WxDxH) | 69.85 x 100 x 7.0 mm | |||
| Weight | 84.7g (± 5%) | |||
Performance
Testbed
Our Enterprise SSD reviews leverage a Lenovo ThinkSystem SR850 for application tests and a Dell PowerEdge R740xd for synthetic benchmarks. The ThinkSystem SR850 is a well-equipped quad-CPU platform, offering CPU power well in excess of what’s needed to stress high-performance local storage. Synthetic tests that don’t require a lot of CPU resources use the more traditional dual-processor server. In both cases, the intent is to showcase local storage in the best light possible that aligns with storage vendor maximum drive specs.
Lenovo ThinkSystem SR850
- 4 x Intel Platinum 8160 CPU (2.1GHz x 24 Cores)
- 16 x 32GB DDR4-2666Mhz ECC DRAM
- 2 x RAID 930-8i 12Gb/s RAID Cards
- 8 NVMe Bays
- VMware ESXI 6.5
Dell PowerEdge R740xd
- 2 x Intel Gold 6130 CPU (2.1GHz x 16 Cores)
- 4 x 16GB DDR4-2666MHz ECC DRAM
- 1x PERC 730 2GB 12Gb/s RAID Card
- Add-in NVMe Adapter
- Ubuntu-16.04.3-desktop-amd64
Testing Background
The StorageReview Enterprise Test Lab provides a flexible architecture for conducting benchmarks of enterprise storage devices in an environment comparable to what administrators encounter in real deployments. The Enterprise Test Lab incorporates a variety of servers, networking, power conditioning, and other network infrastructure that allows our staff to establish real-world conditions to accurately gauge performance during our reviews.
We incorporate these details about the lab environment and protocols into reviews so that IT professionals and those responsible for storage acquisition can understand the conditions under which we have achieved the following results. None of our reviews are paid for or overseen by the manufacturer of equipment we are testing.
Application Workload Analysis
In order to understand the performance characteristics of enterprise storage devices, it is essential to model the infrastructure and the application workloads found in live-production environments. Our benchmarks for the Kingston DC500M are therefore the MySQL OLTP performance via SysBench and Microsoft SQL Server OLTP performance with a simulated TCP-C workload. For our application workloads, each drive will be running 2-4 identically configured VMs.
SQL Server Performance
Each SQL Server VM is configured with two vDisks: 100GB volume for boot and a 500GB volume for the database and log files. From a system-resource perspective, we configured each VM with 16 vCPUs, 64GB of DRAM and leveraged the LSI Logic SAS SCSI controller. While our Sysbench workloads tested previously saturated the platform in both storage I/O and capacity, the SQL test is looking for latency performance.
This test uses SQL Server 2014 running on Windows Server 2012 R2 guest VMs, and is stressed by Quest’s Benchmark Factory for Databases. StorageReview’s Microsoft SQL Server OLTP testing protocol employs the current draft of the Transaction Processing Performance Council’s Benchmark C (TPC-C), an online transaction-processing benchmark that simulates the activities found in complex application environments. The TPC-C benchmark comes closer than synthetic performance benchmarks to gauging the performance strengths and bottlenecks of storage infrastructure in database environments. Each instance of our SQL Server VM for this review uses a 333GB (1,500 scale) SQL Server database and measures the transactional performance and latency under a load of 15,000 virtual users.
SQL Server Testing Configuration (per VM)
- Windows Server 2012 R2
- Storage Footprint: 600GB allocated, 500GB used
- SQL Server 2014
- Database Size: 1,500 scale
- Virtual Client Load: 15,000
- RAM Buffer: 48GB
- Test Length: 3 hours
- 2.5 hours preconditioning
- 30 minutes sample period
For our SQL Server transactional benchmark, the SK hynix PE6011 performed as an equal to the Intel P4510 8TB with a total of 12,625.4 TPS.
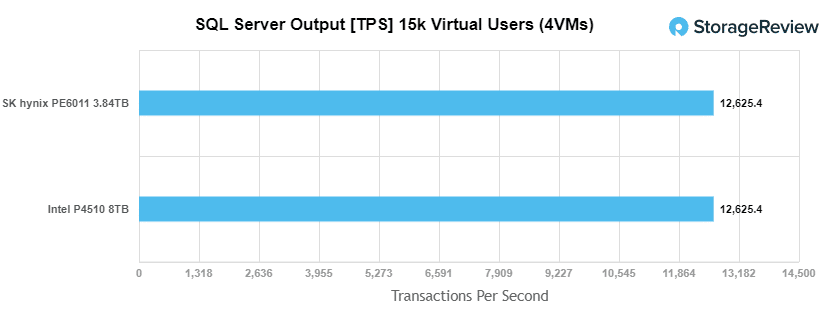
A better indication of SQL Server performance is latency compared to TPS. Here, we see the SK hynix PE6011 lagged behind with a noticeably longer average latency compared to the Intel P4510 with 46.3ms.

Sysbench Performance
The next application benchmark consists of a Percona MySQL OLTP database measured via SysBench. This test measures average TPS (Transactions Per Second), average latency, and average 99th percentile latency as well.
Each Sysbench VM is configured with three vDisks: one for boot (~92GB), one with the pre-built database (~447GB), and the third for the database under test (270GB). From a system-resource perspective, we configured each VM with 16 vCPUs, 60GB of DRAM and leveraged the LSI Logic SAS SCSI controller.
Sysbench Testing Configuration (per VM)
- CentOS 6.3 64-bit
- Percona XtraDB 5.5.30-rel30.1
- Database Tables: 100
- Database Size: 10,000,000
- Database Threads: 32
- RAM Buffer: 24GB
- Test Length: 3 hours
- 2 hours preconditioning 32 threads
- 1 hour 32 threads
With the Sysbench transactional benchmark, the PE6011 trailed behind and came in last with a 5,936.6 TPS.

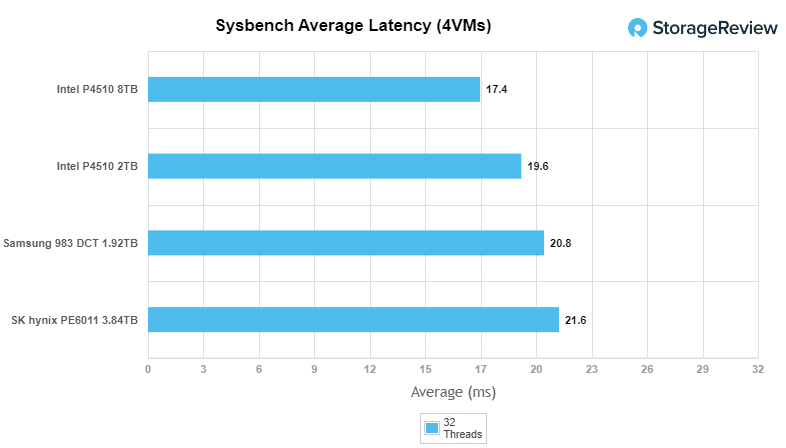
In the Sysbench average latency, the PE6011 again showed results that placed it at the bottom of the pack with 21.6ms.
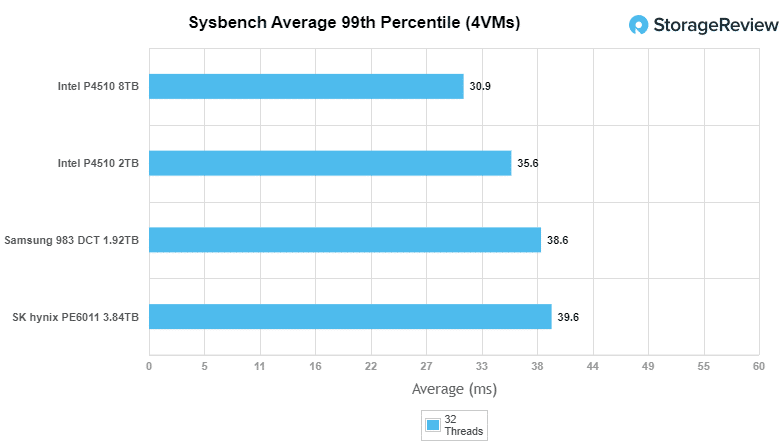
For our worst-case scenario latency (99th percentile), the PE6011 finished last is within 1ms of the Samsung 983 DCT with a result of 39.6ms in latency.
Houdini by SideFX
The Houdini test is specifically designed to evaluate storage performance as it relates to CGI rendering. The test bed for this application is a variant of the core Dell PowerEdge R740xd server type we use in the lab with dual Intel 6130 CPUs and 64GB DRAM. In this case, we installed Ubuntu Desktop (ubuntu-16.04.3-desktop-amd64) running bare metal. Output of the benchmark is measured in seconds to complete, with fewer being better.
The Maelstrom demo represents a section of the rendering pipeline that highlights the performance capabilities of storage by demonstrating its ability to effectively use the swap file as a form of extended memory. The test does not write out the result data or process the points in order to isolate the wall-time effect of the latency impact to the underlying storage component. The test itself is composed of five phases, three of which we run as part of the benchmark, which are as follows:
Loads packed points from disk. This is the time to read from disk. This is single threaded, which may limit overall throughput.
Unpacks the points into a single flat array in order to allow them to be processed. If the points do not have dependency on other points, the working set could be adjusted to stay in-core. This step is multi-threaded.
(Not Run) Processes the points.
Repacks them into bucketed blocks suitable for storing back to disk. This step is multi-threaded.
(Not Run) Writes the bucketed blocks back out to disk.
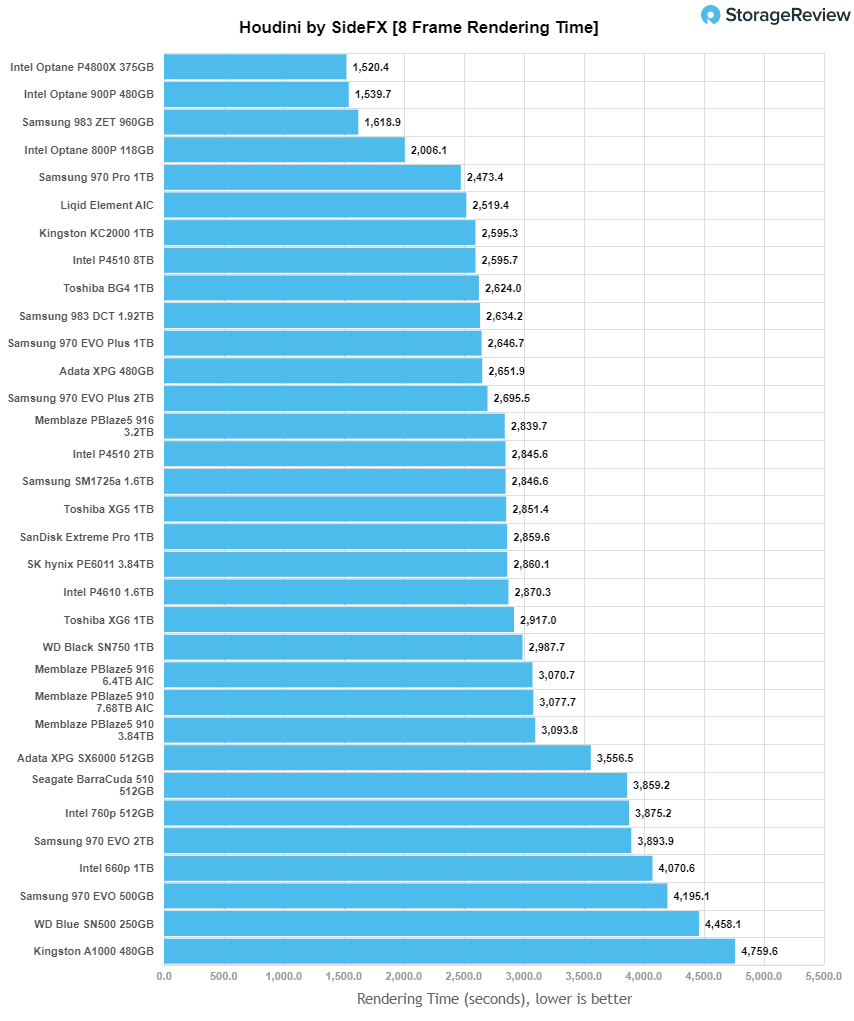
With the Houdini test, the PE6011 placed mid-range with 2,860.1 seconds.
VDBench Workload Analysis
When it comes to benchmarking storage devices, application testing is best, and synthetic testing comes in second place. While not a perfect representation of actual workloads, synthetic tests do help to baseline storage devices with a repeatability factor that makes it easy to do apples-to-apples comparison between competing solutions. These workloads offer a range of different testing profiles ranging from “four corners” tests, common database transfer size tests, to trace captures from different VDI environments. All of these tests leverage the common VDBench workload generator, with a scripting engine to automate and capture results over a large compute testing cluster. This allows us to repeat the same workloads across a wide range of storage devices, including flash arrays and individual storage devices. Our testing process for these benchmarks fills the entire drive surface with data, then partitions a drive section equal to 25% of the drive capacity to simulate how the drive might respond to application workloads. This is different than full entropy tests which use 100% of the drive and take them into steady state. As a result, these figures will reflect higher-sustained write speeds.
Profiles:
- 4K Random Read: 100% Read, 128 threads, 0-120% iorate
- 4K Random Write: 100% Write, 64 threads, 0-120% iorate
- 64K Sequential Read: 100% Read, 16 threads, 0-120% iorate
- 64K Sequential Write: 100% Write, 8 threads, 0-120% iorate
- Synthetic Database: SQL and Oracle
- VDI Full Clone and Linked Clone Traces
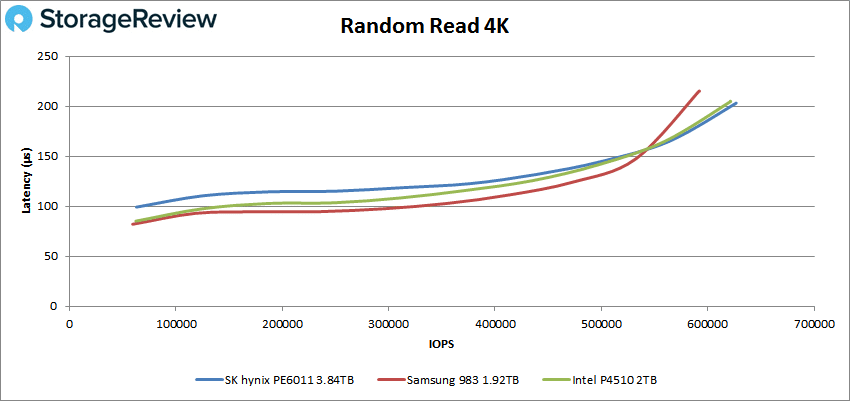
In our first VDBench Workload Analysis, Random 4K Read, the SK hynix PE6011 was able to stay under 1ms throughout the test with a peak of 626,681 IOPS and a latency of 203.2μs
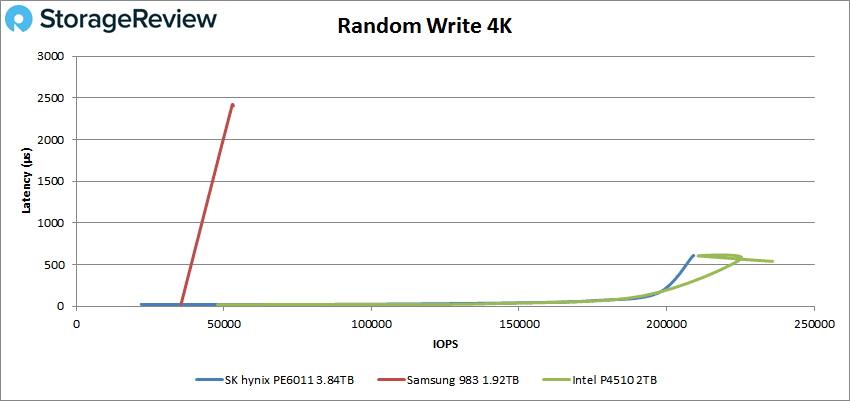
4K random write performance showed sub-millisecond latency throughout the test again. Here, the PE6011 showed peak performance of 209,000 IOPS and a latency of 609.6μs.
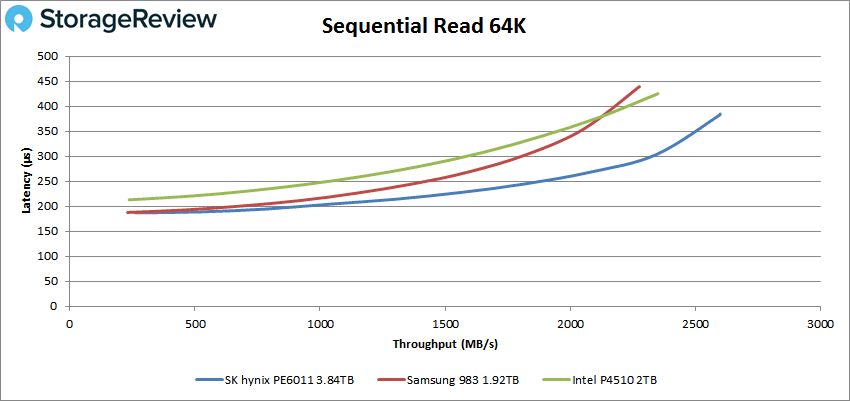
Switching over to sequential workloads, the SK hynix PE6011 placed at the top of the pack in 64K sequential reads with a peak score of 41,554 IOPS or 2.59GB/s with a latency of 384.5μs.
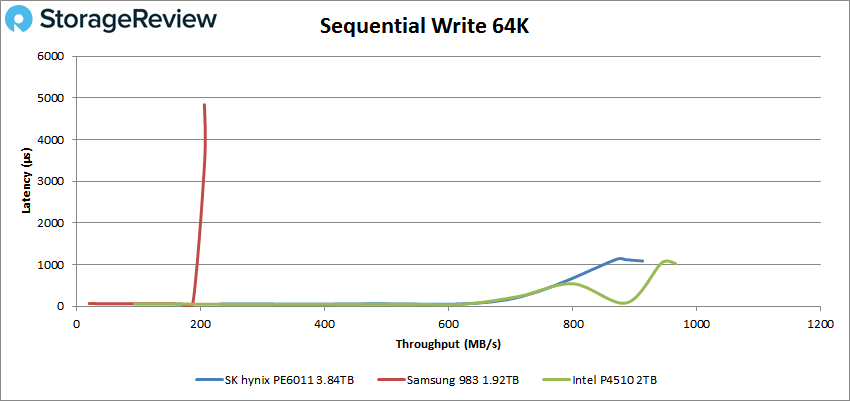
The PE6011 peaked at 13,956 IOPS or 0.87GB/s with a latency of 1137.7μs in the 64K sequential write.
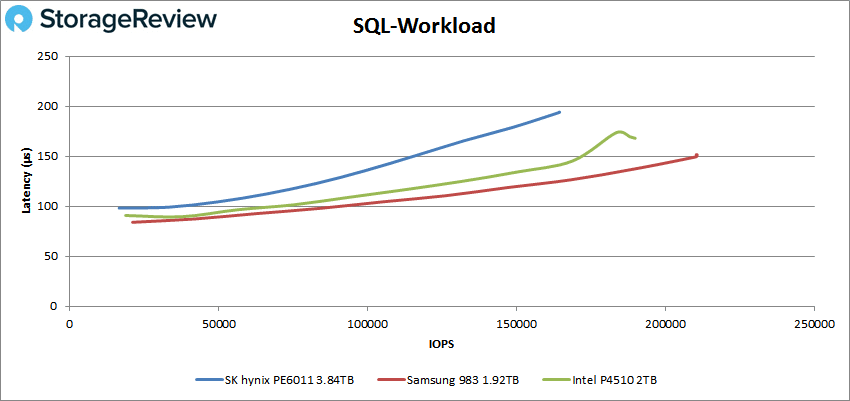
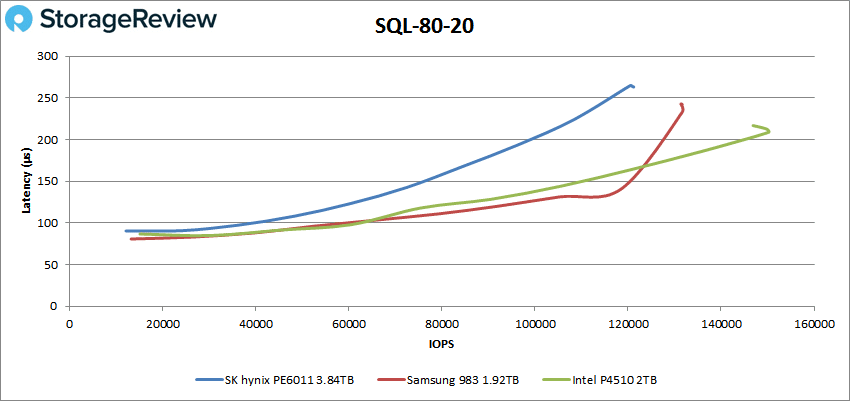
Moving on to SQL workloads, the PE6011 peaked at 164,402 IOPS with latency of 194.2μs
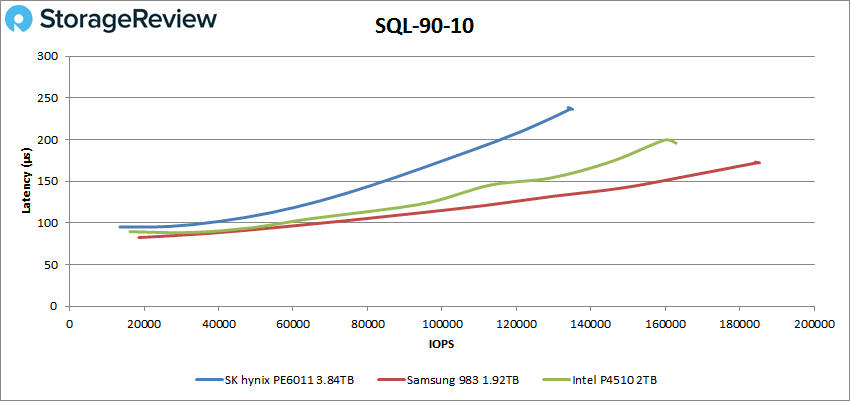
SQL 90-10 saw the PE6011 peak at 133,898 IOPS and a latency of 238.4μs.
The PE6011 peaked at 120,450 IOPS and a latency of 264.8.
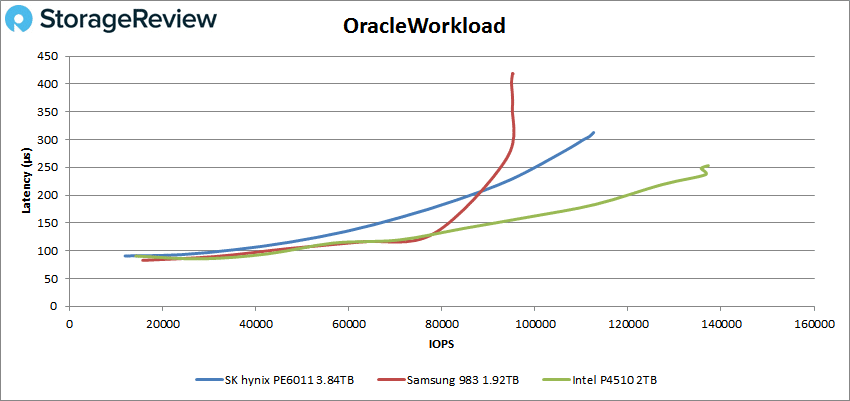
In our Oracle workload, the PE6011 placed in the middle of the pack with a peak of 112,610 IOPS and a latency of 312.8μs.
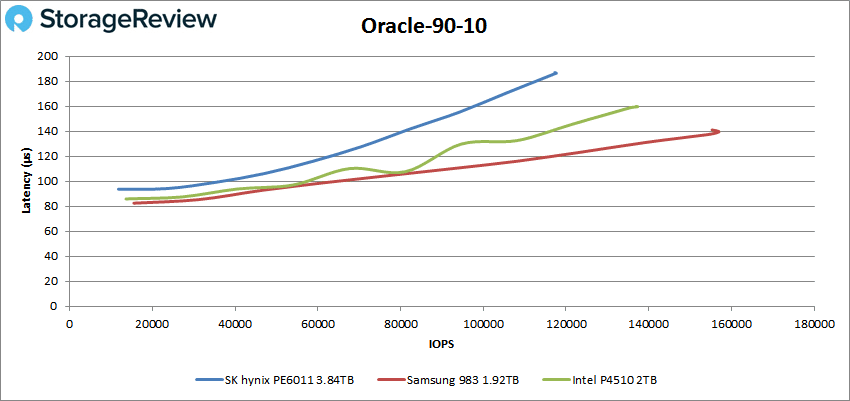
In Oracle 90-10, the PE6011 peaked at 117,287 IOPS and a latency of 187μs.
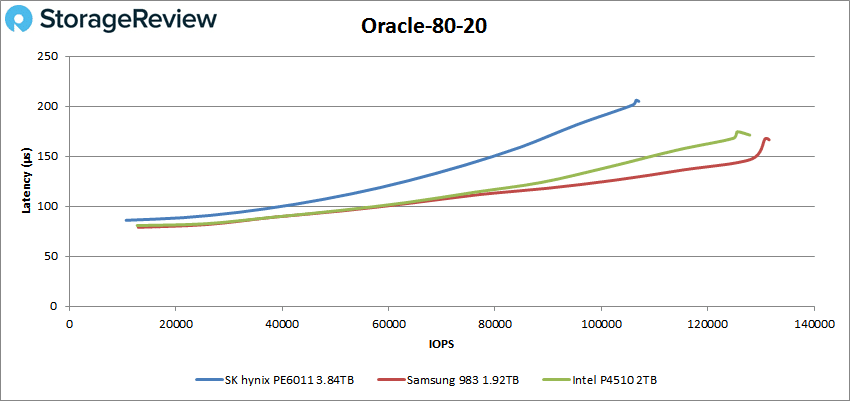
For Oracle 80-20 we saw the PE6011 peak at 106,489 IOPS and a latency of 205.9μs.
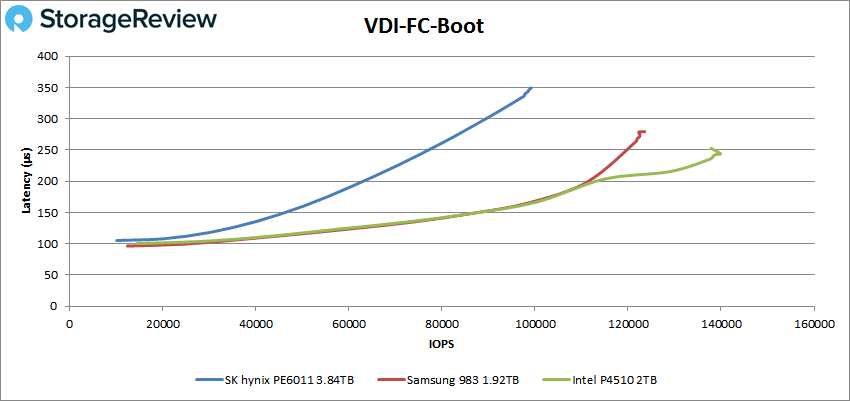
Next, we moved on to our VDI clone benchmark, Full and Linked, where the PE6011 placed in the middle of the pack for the majority of these tests with peak latencies consistently under 1ms. For VDI Full Clone Boot, the PE6011 had a peak performance of 99,196 IOPS and a latency of 349.4μs.
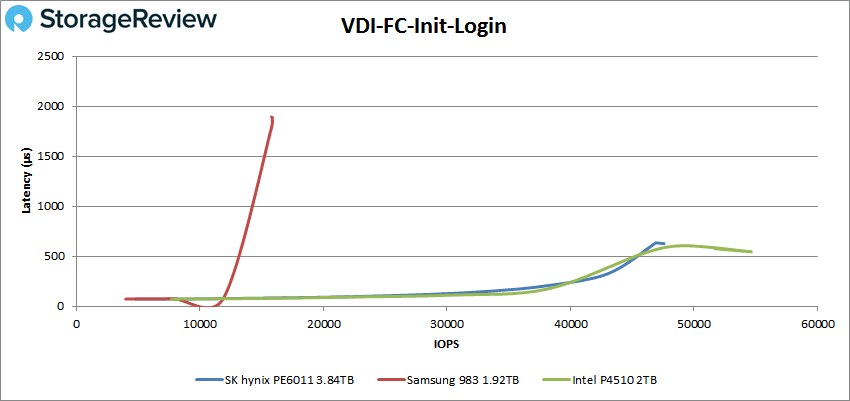
VDI FC Initial Login saw the PE6011 with a peak performance of 46,907 IOPS and a latency of 635.8μs which was just behind the Intel P4510.
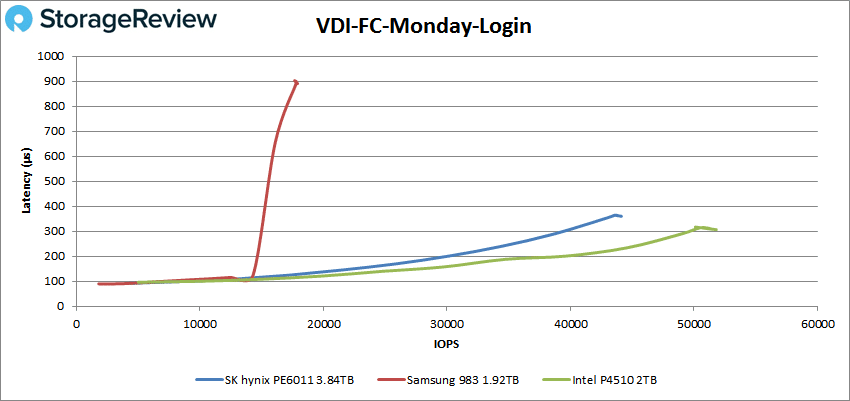
With VDI FC Monday Login, the PE6011 ended with a peak performance of 43,590 IOPS and a latency of 364.6μs.
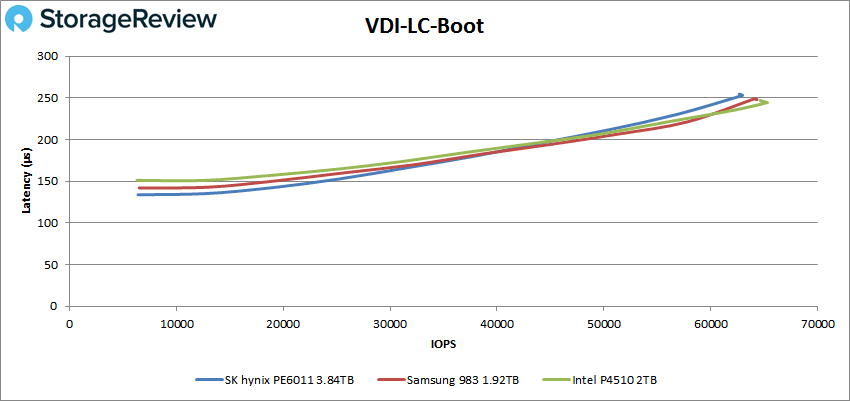
Switching over to Linked Clone (LC), we first looked at the boot test. Here, the PE6011 slightly trailed behind with 62,680 IOPS and a latency of 254.6μs.
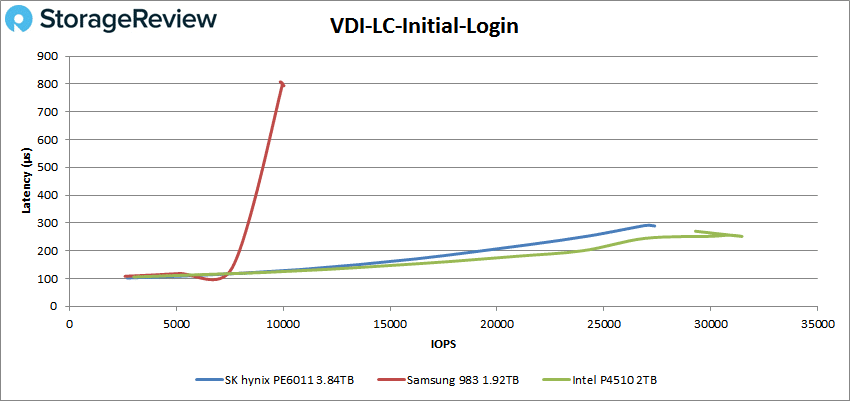
VDI LC Initial Login showed 27,110 IOPS and a latency of 292.2μs, placing it in the middle of the pack.
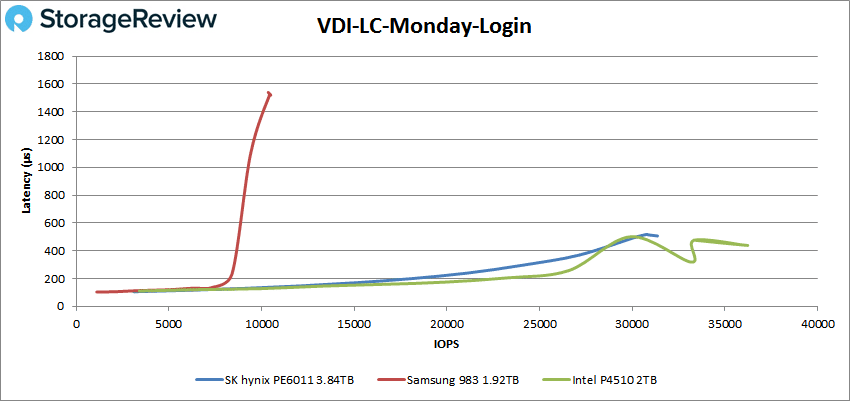
In the VDI LC Monday Login test, the PE6011 showed a peak performance of 30,740 and a latency of 516.9μs, for a photo finish top spot.
Conclusion:
Available in a U.2 7mm form factor the PE6011 is part of SK hynix new line of Enterprise NVMe SSDs., including a next generation product supporting PCIe 4.0 coming out in 1H’20. The PE6011 is ideal for low latency and read intensive workloads (70/30 r/w). In the enterprise market this drive could be lucrative based on economical volume pricing as well as the fact that this is a drive with a fully integrated horizontal orientation. The PE6011 comes in capacities up to 7.68TB which addresses most mainstream enterprise workloads as well as workloads with large capacity requirements. It features 72 layer 3D NAND technology and supports AES 256 Bit data encryption, Power Loss Protection (by On-board Circuit), Thermal Throttling, and SMBus Basic Management (Out of Band).
When looking at performance of the SK hynix PE6011, it doesn’t dominate the field, but instead offers a well-rounded performance profile that works for most applications. Although we compared it to a couple of drives from Samsung and Intel, the PE6011 didn’t perform too far off of those drives most of the time. With Sysbench the SK hynix drive hit 5,936.6 TPS, an average latency of 21.6ms, and a worst-case scenario latency of 39.6ms. In Houdini the SK hynix PE6011 was positioned pretty neutrally in the middle of the pack. In our VDBench benchmarks, the PE6011 maintained a sub-millisecond latency throughout all our tests. It did well in our 4K and 64K, held its own in our VDI Full Clone and Linked Clone Traces, but fell off a little bit in the synthetic databases. Some of the highlights are peak performances of 626,681 IOPS Random Read 4K, 41,554 IOPS Sequential Read 64K, 46,907 IOPS VDI-FC-Init-Login, and 30,740 IOPS VDI-LC-Monday Login.
The SK hynix PE6011 offers good performance, low latency, and lots of capacity in a small 2.5” 7mm form factor. While not the top performer of our comparable drives, the PE6011 gives good numbers all around. Those searching for good price to performance for given workloads need not look much farther than the PE6011.


 Amazon