

There are several options available for storage on the market today. Most of the differentiators out there involve differing speeds, more 9s in availability, or varying GUI support. All in all the arrays are very similar; they just offer different pricing and support or features that are aimed at a set group of customers. DataGravity has entered the picture offering something that truly is different. DataGravity’s focus isn’t on how fast data can be stored or retrieved, nor is it focused on how many drives you can fit in a 2U form factor; at least not yet anyway. DataGravity is about being able to understand your data and to help customers easily find it, report on it and ensure compliance with industry or internal policies.
Understanding the nuance of where DataGravity fits is important. Within the enterprise there are often big data analytic and security teams out there that are charged with finding and securing data, but that isn’t the market DataGravity is going after. DataGravity is aimed toward the midrange market that in most cases has limited IT staff, but the same data challenges as large enterprises. Why would DataGravity focus such a complicated process at someone who seems ill equipped to use it? Because as DataGravity founder Paula Long states, if you can surf the web, you can use this product. Automation is the key to solving these issues.
The DataGravity Discovery Series family works by understanding the data within files. By being able to probe into a Word doc, for instance, to check for social security numbers, the DataGravity array offers immediate visibility into the files a company is storing. DataGravity then can understand this data, report on it and ensure sensitive information isn't shared with inappropriate parties. In addition to understanding the data stored on the array, all file access and user activity is audited, helping companies meet their compliance and security requirements. This is an important distinction in understanding what DataGravity is and what it is not. DataGravity is very much focused on this unstructured data use case, which is a common playground for NASs and the like. While they support iSCSI, NFS and SMB, the primary use case for DataGravity is not mainstream business application use cases like email, transactional database and such. The platform may go there eventually, and probably will, but today their target is extremely well defined.
Data like social security numbers, patient IDs, phone numbers, credit card numbers and such are easy to define and understand. In fact, DataGravity supports many common compliance tags out of the box. It's not limited to those however. For organizations that have unique needs, as many businesses do, DataGravity offers an editor that allows organizations to establish their own tags. This ensures users of the platform will be able to quickly respond to security, compliance and eDiscovery requirements that are specific to their industry. The visibility into stored data also provides better business value by making everything searchable, based on access rules of course.
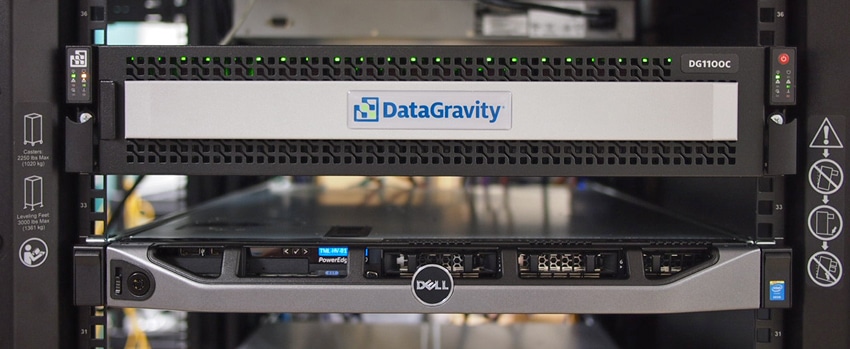
DataGravity offers arrays in several configurations that leverage nearline HDDs for capacity and flash as a read cache. The units are dual controller, with each controller "active" and doing a specific job which we'll dive more in to below. The DG1100 comes in 18TB raw disk capacity and the DG1200 comes with 36TB raw. The DG2200 offers 48TB and the DG2400 brings 96TB to the table. Currently these are not expandable, however DataGravity clearly sees the need to address this; likely with expansion shelves and/or a management interface that federates multiple systems into a single management view. Our testing for this review is entirely centered on usability; we spent two days with DataGravity in their Nashua, NH office and concluded follow-up work remotely. This gave us some hands-on time with a DG1100 unit.
Architecture
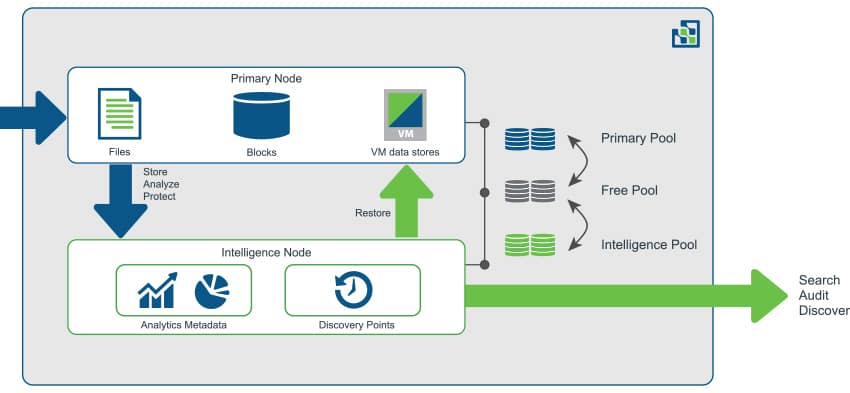
DataGravity has dual active-active controllers with a twist. Normally an active-active dual controller means that both controllers are active with I/O processing. However with DataGravity the architecture mimics active-passive, with the primary node serving data and the intelligence node handling data analytics. DataGravity calls this "active-proactive." The basic setup looks like this: multiple GBs of DRAM, battery-backed NVRAM, SSDs for the metadata and cache, and then nearline HDDs.
With a not-so-insignificant amount of data flowing through DRAM and battery-backed NVRAM, DataGravity mirrors writes between the primary node and intelligence node as a first order of business. This is done through an internal PCIe bridge, offering high bandwidth and low-latency communication. This fast link is leveraged in the DataGravity architecture for its continuous data protection and data analytics. In-flight data is mirrored until the primary node is able to commit it to disk. Putting both controllers to work, the Discovery Series leverages a primary storage node for production I/O, and puts the typically idle secondary node to work as an intelligence node. The intelligence node leverages the metadata and fine grain writes mirrored to this controller for continuous protection and data-aware analytics processing.
While active-active (or active-proactive in this case) has the advantage of using what has been paid for (versus active-passive where the second node sits dormant until the primary fails), one question that always tends to come up: What happens to performance if a node fails? If DataGravity needs two nodes in order to work its magic and one is lost, where does that leave customers? In the case of a node failure, the remaining node takes over the basics for production. Users will still be able to access and use files as they would in their normal day-to-day operations. However the bulk of analytics are suspended until the failed node is restored. In other words, availability remains but the metadata-centric features are reduced until node restoration.
Usability
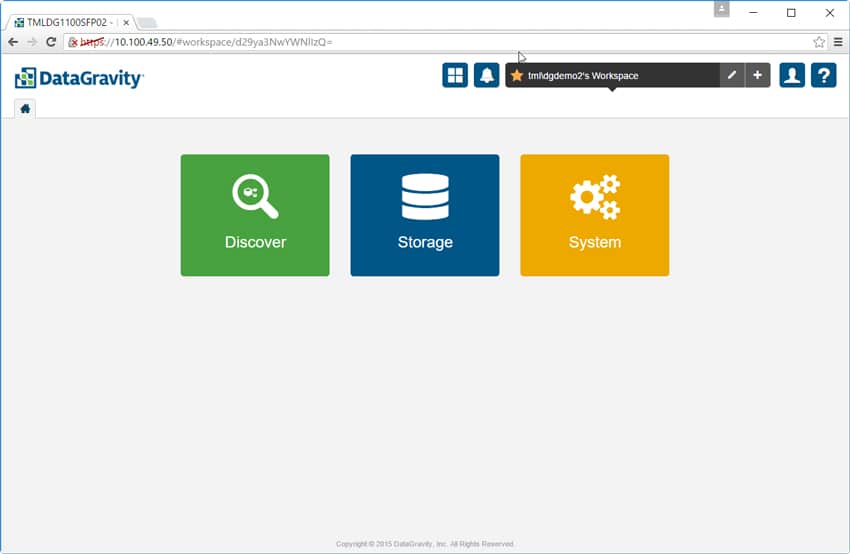
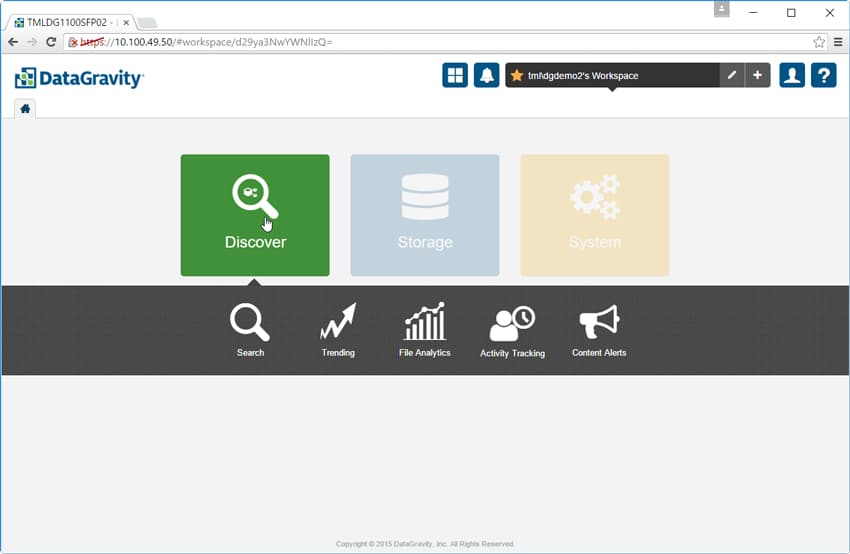
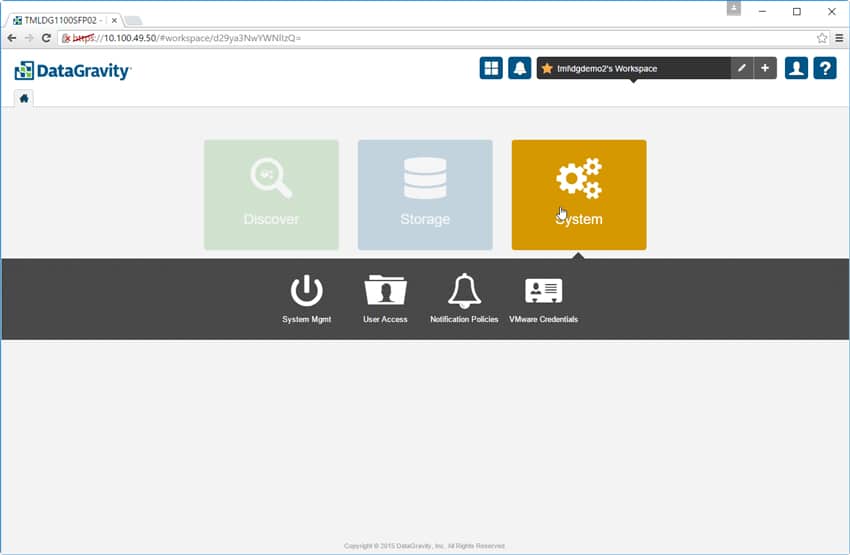
The DataGravity GUI is HTML 5-based and features a very simple and usable layout. The home tab has just three options to choose from: Discover, Storage, or System. Running along the top right we see the Global Access Panel, which contains icons for the system dashboard and alerts, workspace, profile and online help.
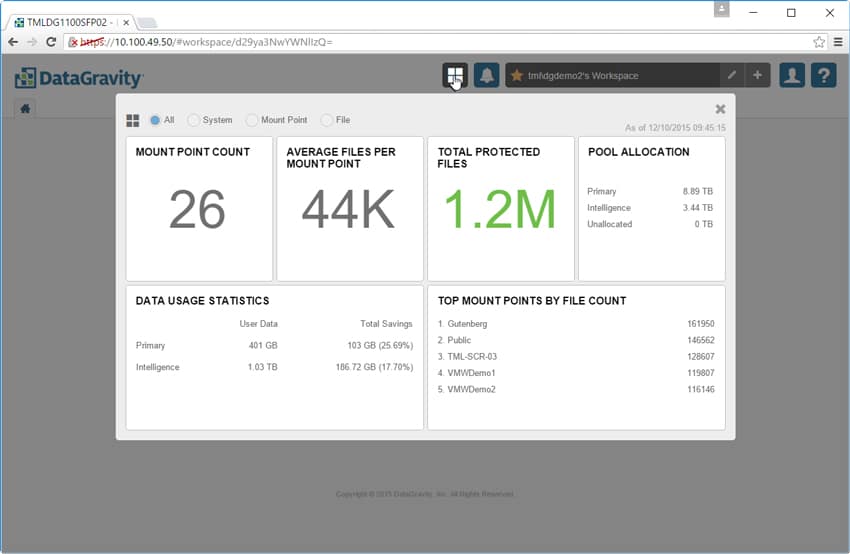
The system dashboard gives users a quick glance at statistics such as the number of mount points, total files protected, pool allocation, and data usage statistics.
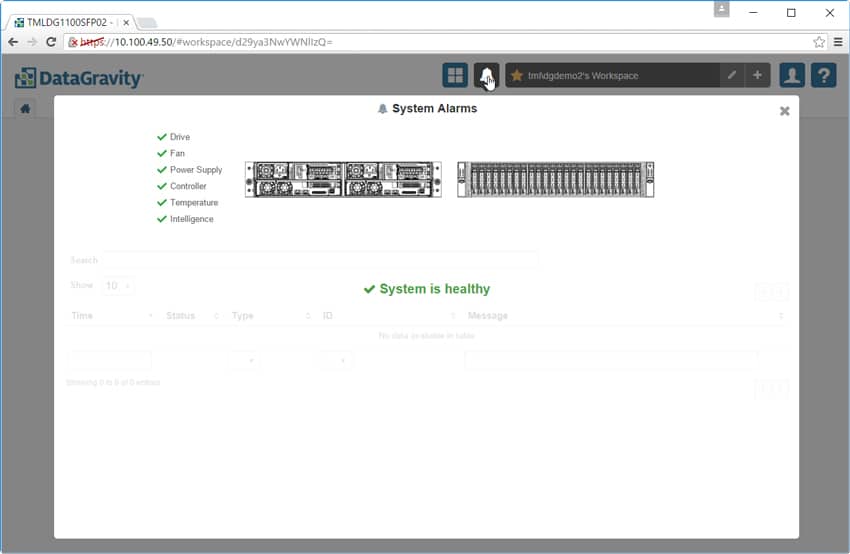
The system alarms tab is as it sounds, giving users a list of alarms and where they occurred within the system.
To the right of the alarm tab is the Workspace tab. Here users can rename or add workspaces. Workspaces allow users to configure and manage their private view of the system. Users can configure multiple workspaces depending on their needs.

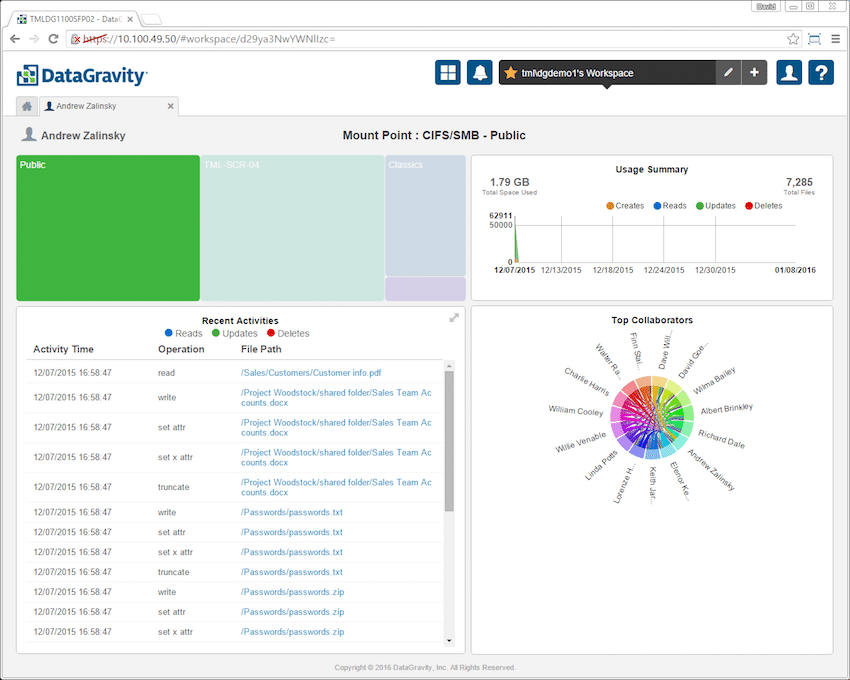
The next icon is the Profiles icon. By clicking on the Profiles icon, an authorized user has the ability to manage their profile; email subscriptions for saved searches and can logout of the system. Upon login, the GUI provides several tiles which display information such as usage summary over time and recent activity (each broken down by reads, updates, deletes, and in the case of usage creates. There is also a chord diagram that shows who each user is collaborating with and in what capacity.
Going back to the home tab, the leftmost icon is the bread and butter of DataGravity, the Discover tab. Clicking on the tab gives users options such as search, trending, file analytics, activity tracking, and content alerts.
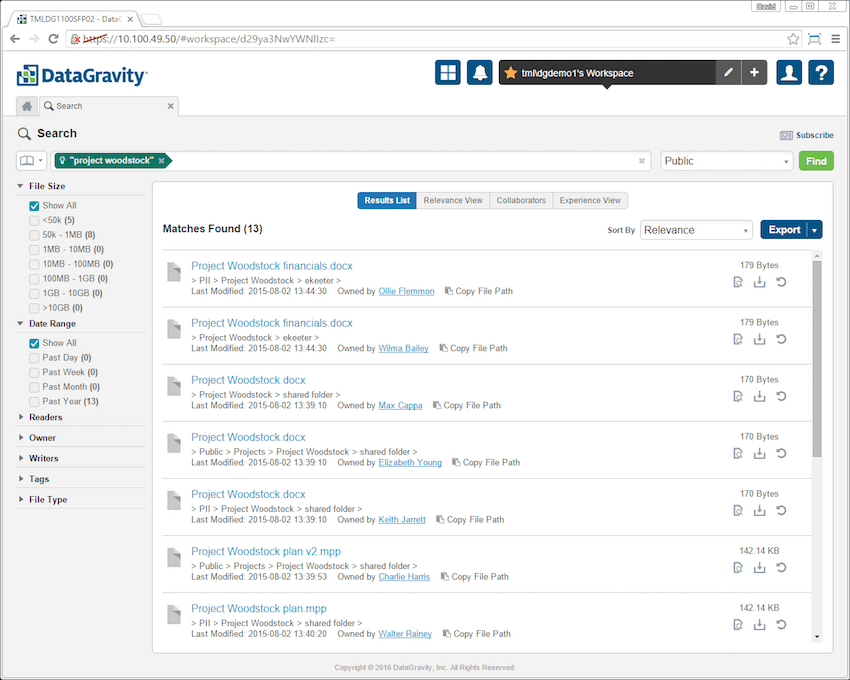
Search is as it sounds. A search bar comes up and users just need to enter the keyword or file name they are searching for. Before searching users need to select the mount point they want to search in. In the image below the search is for "project woodstock." This returned all the files in the Public mount point that contained those terms. Filters on the left allow for tightening down the results further.
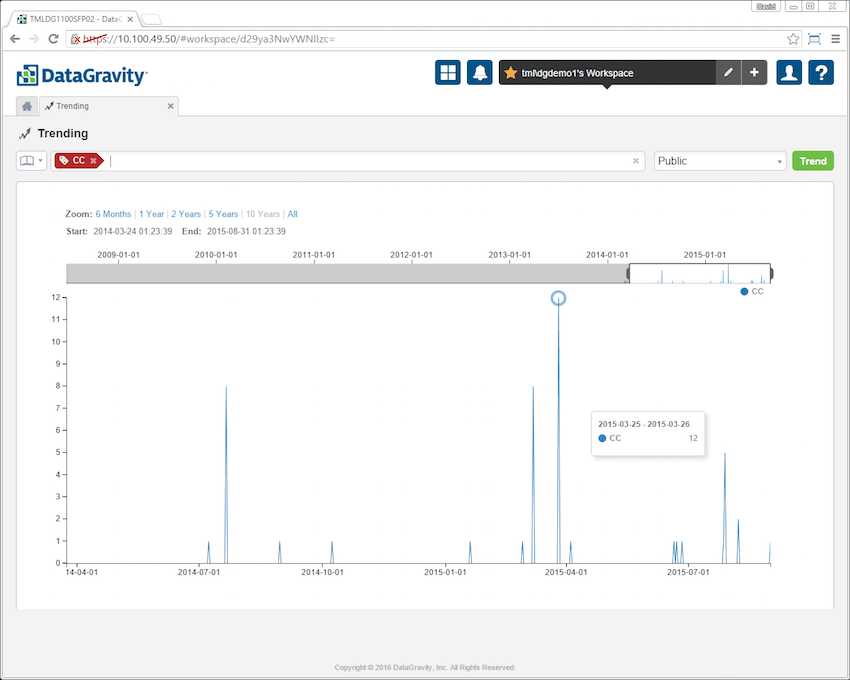
Trending is similar to search, only here users put in the keyword or tag they are looking for and the solution will give them a graphical representation of the data. This allows companies to see how the data is being accessed in both live and deleted files over time. In the screen cap below the credit card tag (CC) was entered into trending. The results show how credit card numbers have been trending over time in the Public mount point.
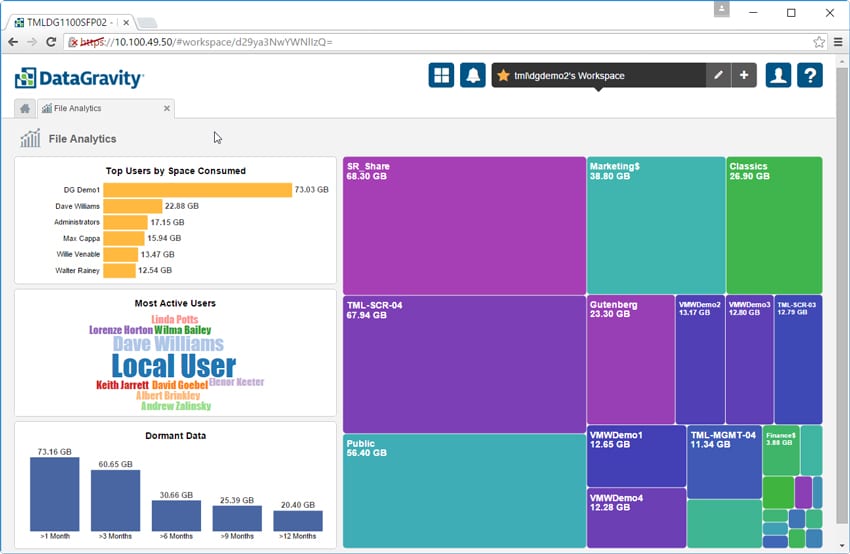
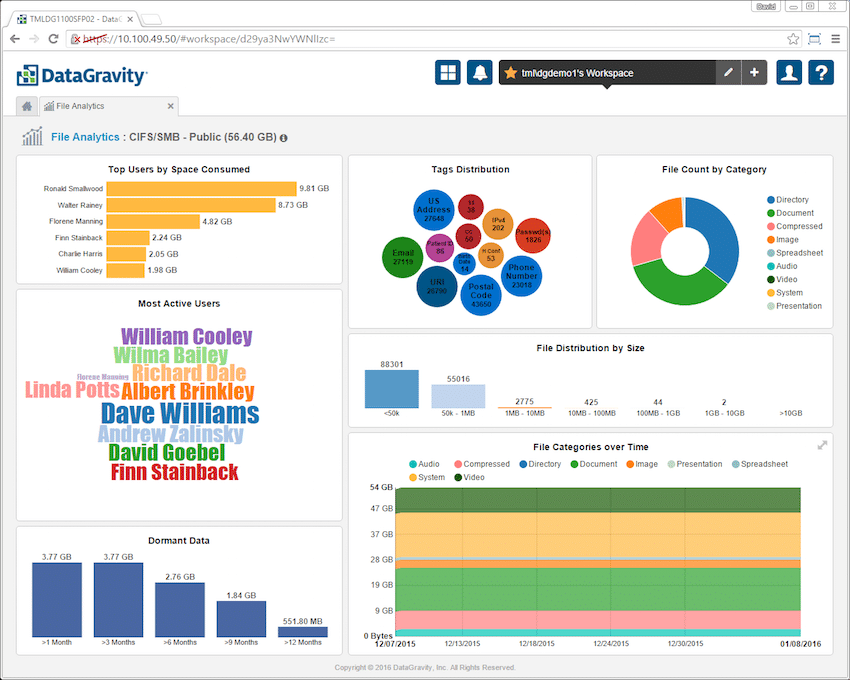
File Analytics is another place where DataGravity separates itself from the rest of the storage vendors. Through this dashboard users can easily see file shares and virtual machines represented by colored blocks on the right hand side. The larger the share, as far as the capacity being consumed, the larger the colored block. Users can also see the top 10 users by space consumed in a bar chart, most active users (the more active the user the larger their name appears), and the dormant data and how long data has been inactive grouped by 1, 3, 6, 9 and 12 month categories.
Clicking on an individual file share or VM further breaks down this information. To the left is information on the most active users (as measured by read/write/delete operations) and the top users by space within the share or VM. There is also a listing for dormant data. To the right are four additional tiles: tags distribution, file count by category, file distribution by size and file categories over time. Clicking into each tile provides more detail.
The next tab in the discover section is Activity Tracking. As the name implies admins and security users can quickly see what user performed what activity during a specific time period. Admins just need to choose which mount point to search and the user and date range.
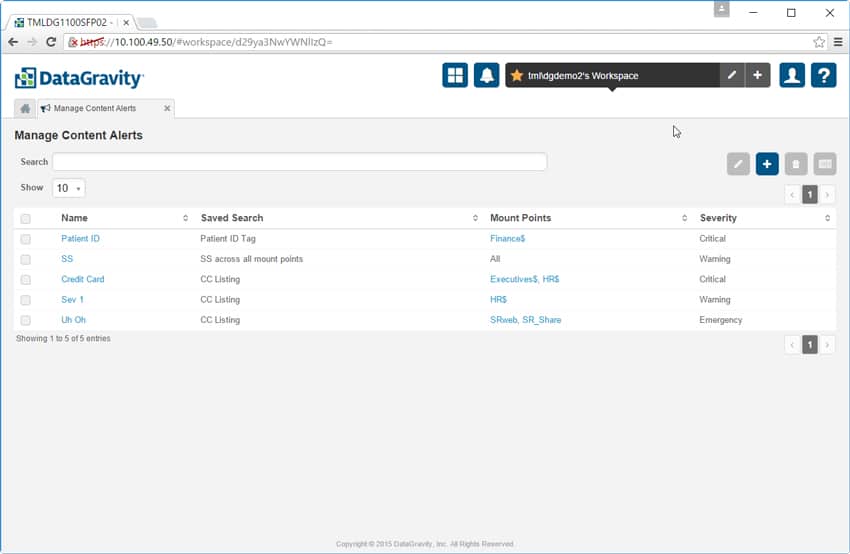
The final tab in the Discover section allows admins to manage content alerts. In the example below the admin set up alerts to be notified when social security or credit cards numbers are found in open text, unencrypted formats and in places where they don't belong. This gives companies the ability to quickly find and move critical data that has been placed in unsecured locations.
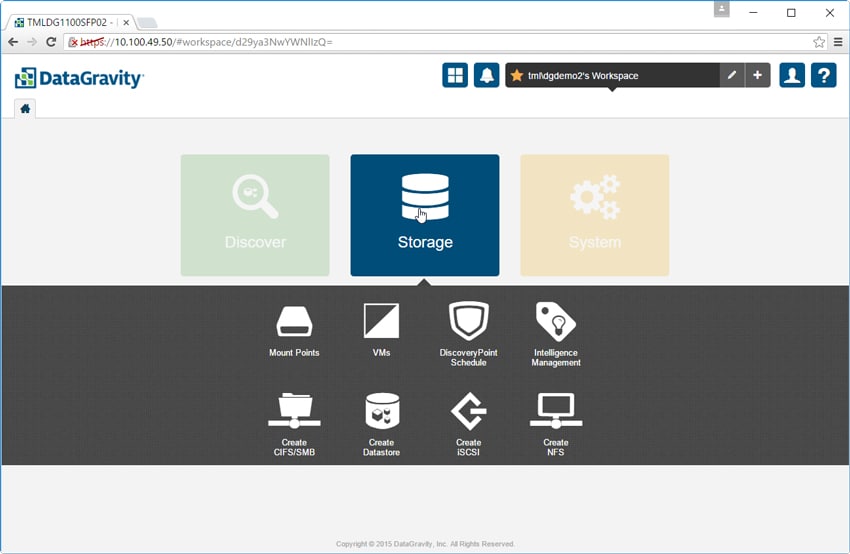
The next main tab is the Storage tab. There are 8 sub-tabs here: Mount Points, VMs, DiscoveryPoint Schedule, Intelligence Management, Create CIFS/SMB, Create Datastore, Create iSCSI, and Create NFS.
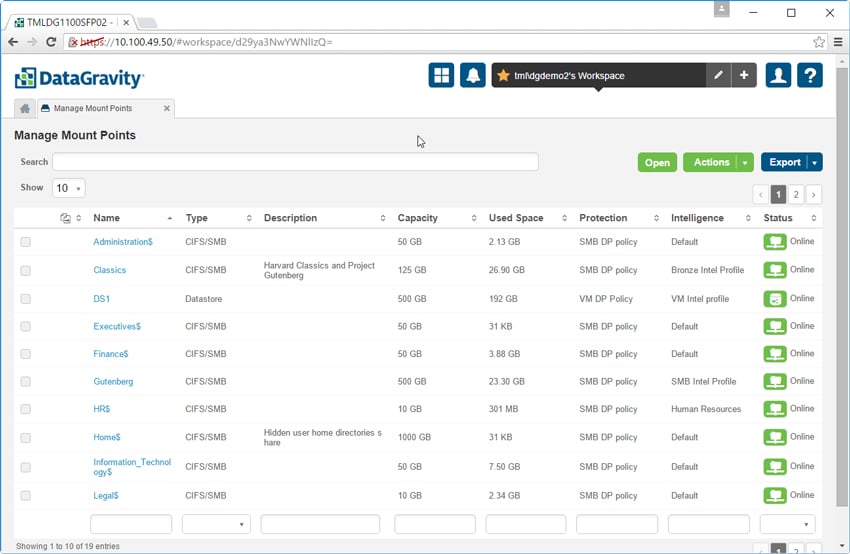
The Manage Mount Points tab allows users to see the settings of each mount point as well as create new ones. Here users can see the capacity of each mount point (as well as the amount used), a short description of each, its protection policy, and its status. Each new mount point created here can have these settings adjusted as needed.
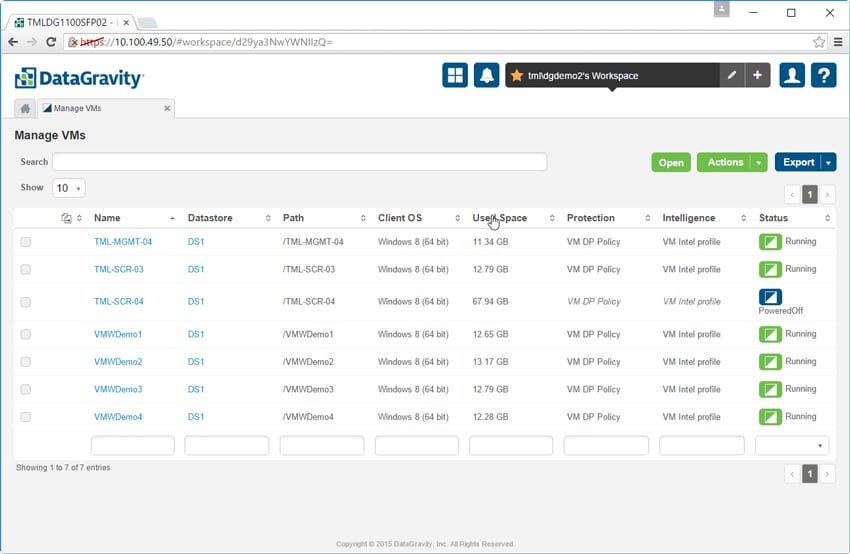
The Manage VMs tab is similar to the above. Here it is possible to view and configure information about the VMs. The VM name is listed as well as its location, OS, capacity used, protection policy, intelligence profile and whether the VM is running or powered off. Clicking on a VM provides additional details.
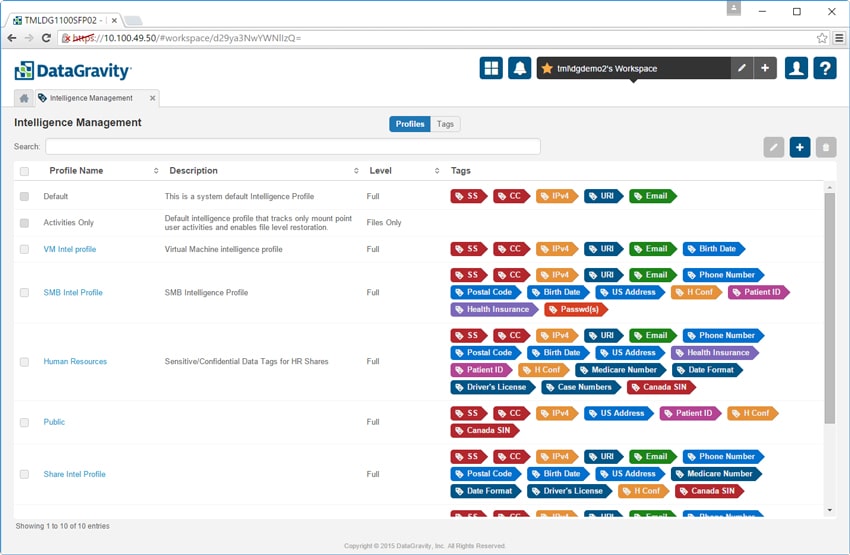
The Intelligence Management tab lets admins configure intelligence profiles for specific use cases and apply them to mount points and VMs. The Tags button lets admins define patterns or phrases of content that contain sensitive data using a built-in regular expression editor.
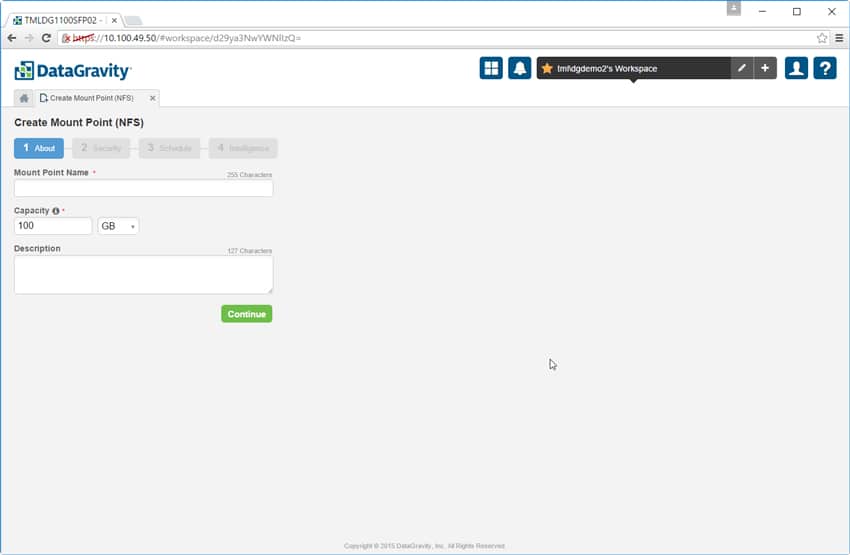
The next four tabs all deal with creating a mount point and its access protocol, be it CIFS/SMB, VM-aware NFS DataStore, iSCSI, or NFS (pictured below). Admins add a name for the mount point, add a description if they choose, select the capacity, set the security policy, define the DiscoveryPoint schedule, and choose the intelligence profile.
The last main section is the System tab. Clicking on it gives us four sub-tabs: System Management, User Access, Notification Policies, and VMware Credentials.
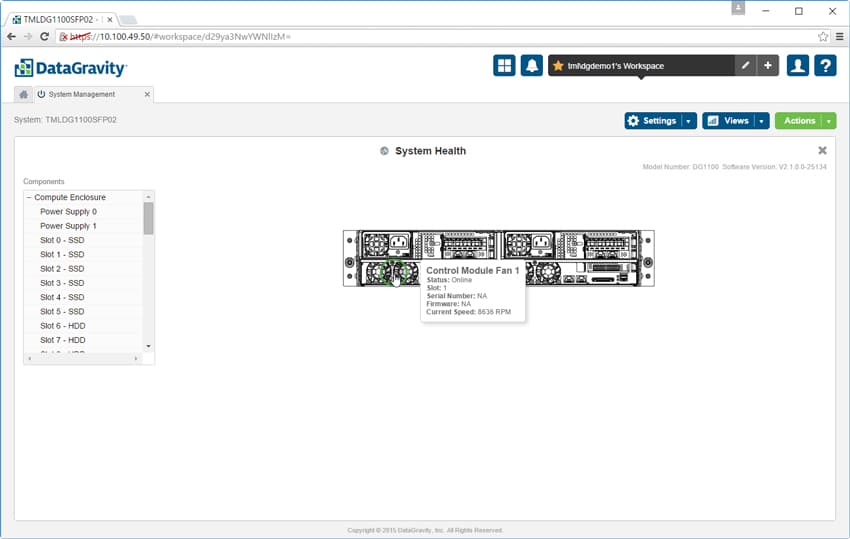
The System Mgmt tab has multiple options, including System Health that gives a view of the health of the physical system. To the left is a list of all the components in the solution. To the right is a graphical representation that will give the user more info by hovering over it.
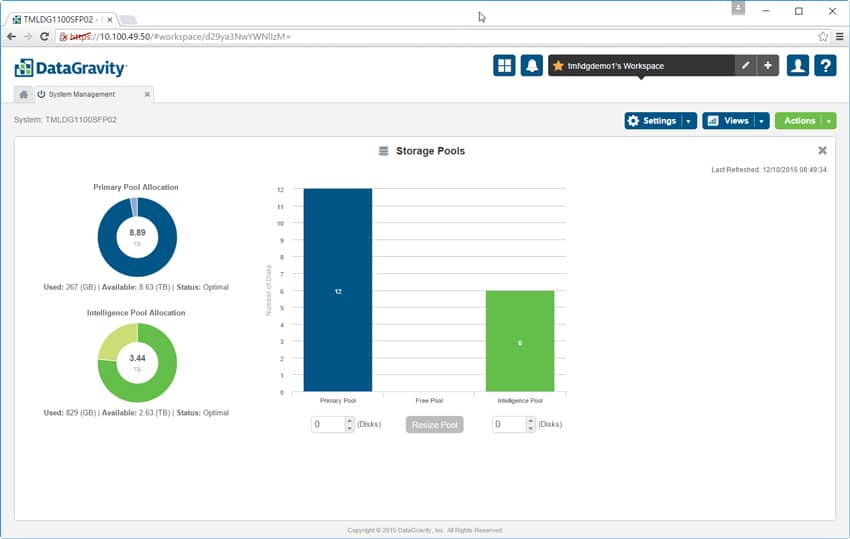
Also within System Mgmt is the Storage Pools section, which gives a view of three different pools in the DataGravity system: the primary pool or the pool that is allocated for day to day use, the intelligence pool, and the free pool for storage that has yet to be allocated. From this screen users can resize the pools as needed.
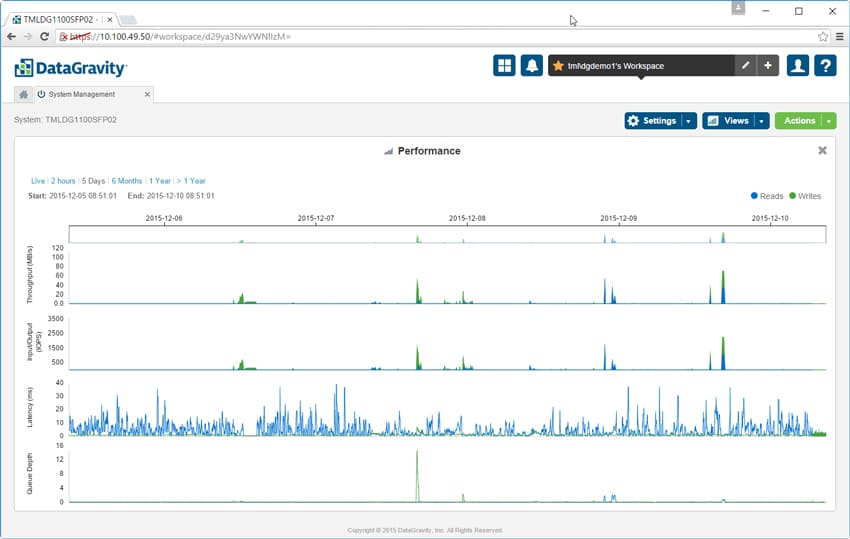
There is also an option to see system performance. The performance view shows both read and write I/O and provides details such as throughput in MB/s, IOPS, latency, and queue depth. Users can look at performance over a period of time or look at a real-time read out of performance.
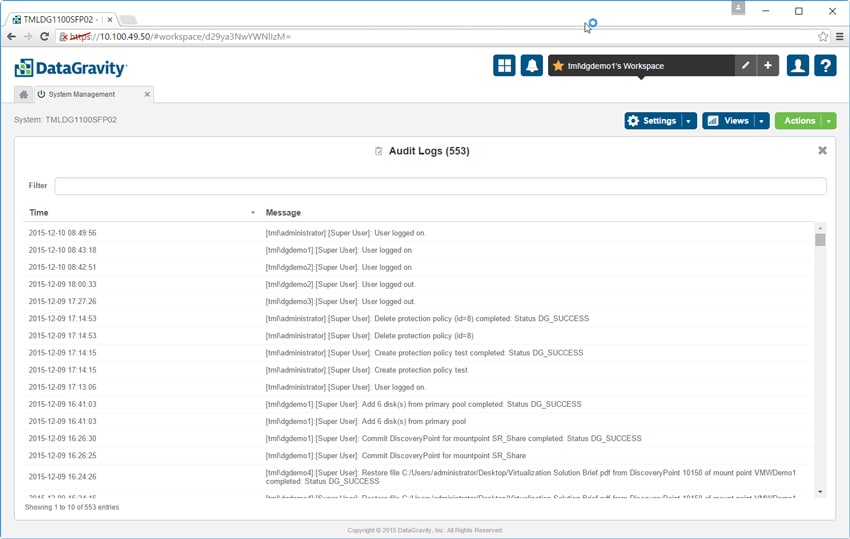
And finally under System Mgmt, admins can view the Audit logs. Not only can they see who logged on and what they were up to, the logs can be filtered for easier viewing access and forwarded to another system for further processing.
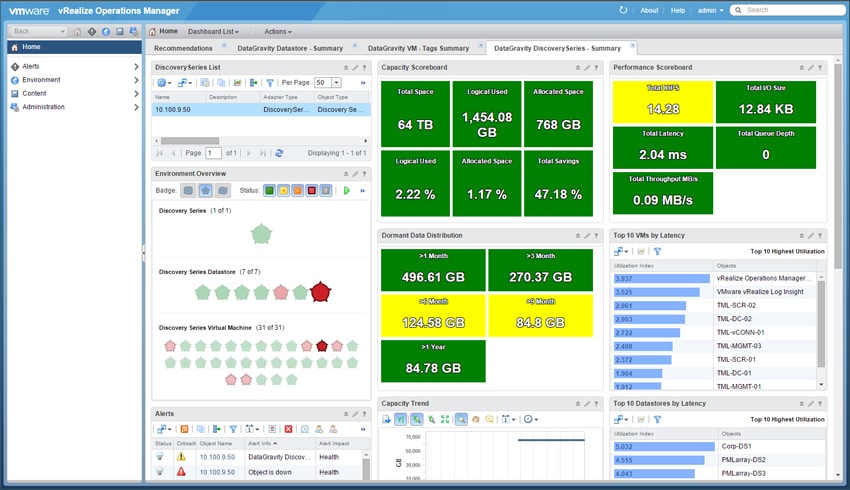
DataGravity also integrates with VMware vRealize Operations manager (vROPS) to surface the analytics of the DataGravity system into the centralized console vROPS provides. DataGravity doesn’t have a virtual presence per se, so this integration enables the virtualization admin a view into the system without being logged into the DataGravity user interface. While all of the information is present, data visualizations are limited compared to the DataGravity GUI.
The vROPS integration displays summary views of the Discovery Series, DataStore or VM. Below is a view of the Discovery Series summary dashboard which shows the overall capacity and performance of the system as well as latency for the datastores and VMs stored on the system with the risk score for each.
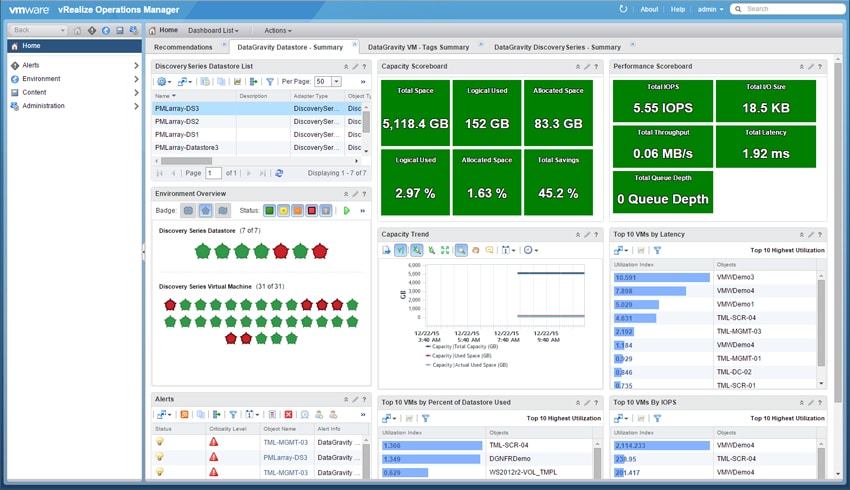
When viewing the DataGravity Datastore Summary dashboard similar metrics are displayed for DataGravity data-aware, NFS datastores.
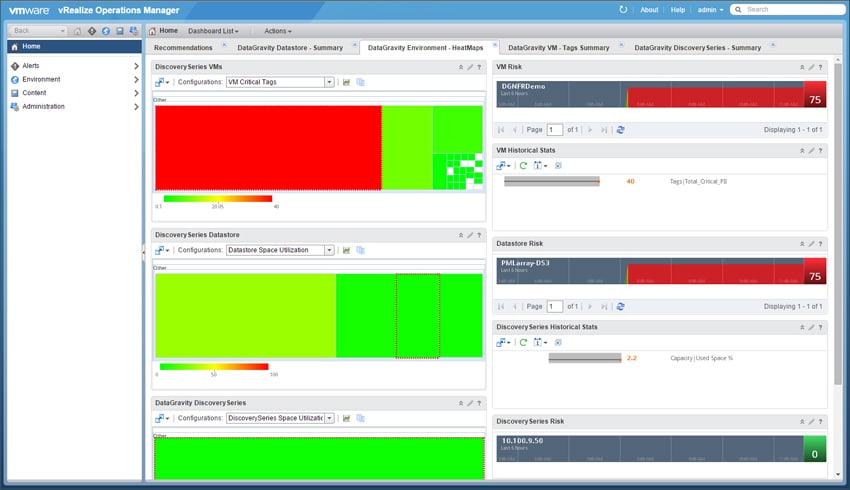
The vROPS integration also displays “heat” maps showing potential trouble areas based on pre-defined values for space utilization and critical intelligence tags found inside VMs, datastores and the Discovery Series system.
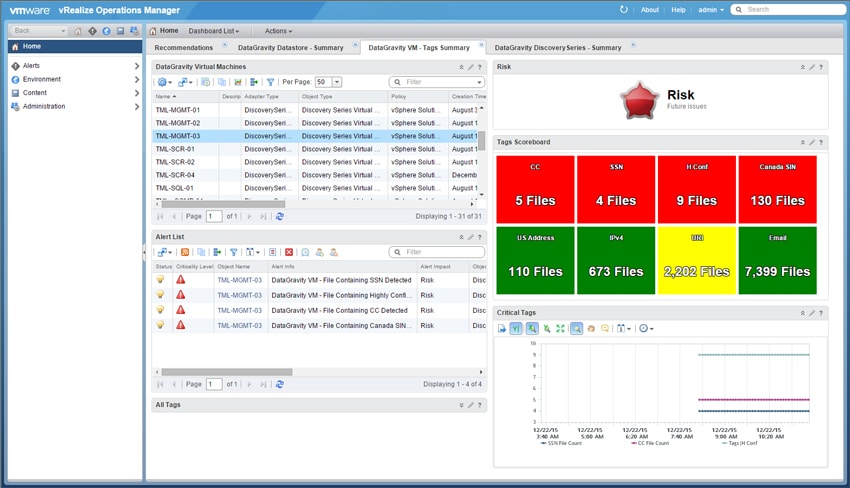
And virtualization admins can see what data in which VM is at risk. Through the tagging system, they can even see more specifically the type of data that is at risk.
Conclusion
DataGravity’s Discovery Series is a storage array that shifts focus away from sheer performance and backup and recovery windows to being data aware. In other words, DataGravity has built a system that gives users visibility into all of their data through an easy-to-use GUI. It doesn’t just allow users to see where their data resides in the system, it gives them an in-depth method for tracking the data, who is accessing it, and whether sensitive data may be exposed. DataGravity allows users to tag most file types which aides in quickly locating and monitoring specific data files. Not only can this make a business’s data more secure by finding issues (whether unintentional or malicious), it also empowers a business to fully use all of its stored data by understanding data locality, access, retention needs and compliance.
Normally at StorageReview we look at the underlying hardware and test its performance through a series of benchmarks. In the case of DataGravity the software is the strongest selling point. While the company offers multiple capacities from 18TB to 96TB, and they have a combination of RAM, NVRAM, SSDs, and nearline HDDs in their solution, the underlying hardware exists to support the DataGravity analytics platform. Of course all hardware exists to support software, however most vendors use the two in tandem to delivery classic storage capabilities. DataGravity makes no claims about being the highest performing or lowest latency. Instead the DataGravity focus is on data awareness and ease of use. On this point, the company clearly excels.
The StorageReview team went on site to test out the solution. Since our focus this time was on usability we didn’t need a physical device in our lab to run our performance tests against. Before we arrived, DataGravity ingested a large portion of our website content into their array giving us data to search that we were intimately familiar with. With just a basic overview of the system we were able to begin intuitively using the solution to search for keywords in various types of files, create shares, reassign data pools, as well as see how our usage of the solution was being tracked.
Ultimately what DataGravity is doing is exceptionally different from the rest of the storage industry. The veteran team decided to go after solving legitimate business pain first, using visibility into storage compliance as the hook. This emphasis on intelligence is fundamental to what DataGravity is all about which varies wildly from traditional storage buys that are based on a capacity or throughput need. While the DataGravity approach makes a ton of sense in regulated industries, even our small business use case saw immediate benefits once we were able to have an in-depth view of even a portion of our outward facing content. Couple that insight with the same for user home directories, shared folders for workgroups and the rest of the business assets and the benefits quickly compound. It's also very intuitive to use, making DataGravity a good fit for small or overburdened IT shops.
The Bottom Line
DataGravity’s Discovery Series enables companies to make full use of all of their data while keeping it secure and actionable via easy to use interface. The emphasis on analytics and visibility into data is truly unique in the storage industry, giving DataGravity a major point of differentiation in an industry that often lacks creativity.


 Amazon