

The Eaton Intelligent Power Manager (IPM) software enables users to monitor and manage all of their power devices in either a physical or virtualized environment. Eaton states that the goal behind IPM is to maintain business continuity by giving users better remote monitoring and management, and in turn, control of the power devices within their network. Recently Eaton updated IPM with new integration with VMware vSphere ESXi 6.0. These new and enhanced features enable additional support for administrators managing their VMware environment and their power devices through a single dashboard.
One of the challenges to running a data center is dealing with power outages or interruptions. Assuming that one isn’t running a perfectly self-sustaining data center, there will be an outage of some scale at some point. Outages can cause anywhere from a minor outage that causes minimal downtime while everything is started back up, to a major outage that can cost businesses millions of dollars a year. The size of the business and number of employees can factor in how high this number is, but even small companies can lose up to $6,900/hour (according to Eaton’s estimates), which can be devastating to a company with a much smaller budget and revenue.
Eaton offers a wide range of power management products as well as datacenter hardware such as racks. No matter the size of the data center, Eaton has several power management and backup solutions for different points of scale. Tying all these products together is Eaton’s IPM software; so when an outage occurs, users can mitigate the problem, manage which systems can be shut down and keep high-priority tasks running longer. With integration points in vSphere, admins can immediately begin to monitor and make changes during an outage. Admins are also able to schedule unattended shutdowns or migrations in the case of a long-term outage.
IPM is offered in three different licenses: basic, silver, and gold with prices ranging from free to $5,000 for silver and $10,000 for gold. Each license has a $3,250 installation fee.
Eaton IPM Features
- Nodes supported:
- Basic: 10
- Silver: 100
- Gold: over 100
- Basic Features
- Shut down server and host without crashing
- Shut down storage module to keep data safe
- Discover third-party devices from one dashboard
- Customize the data monitored from your device using generic drivers
- Group multiple devices to be acted on as a single device with configuration policies
- Take basic actions (server, host and storage shutdown)
- Plugin for VMware vCenter
- Plugin for Citrix XenCenter
- Enter and exit maintenance mode
- Silver/Gold Features
- All basic features
- Limit server power consumption to save on battery and fuel costs during a catastrophe by power capping on demand
- Shut down specific virtual machines during a power event no matter what physical machine they are on
- Migrate virtual machines to targeted hosts and shut down the non-critical server to conserve energy
- Shut down or suspend a virtual appliance
- Automatically back up data during a power event to avoid data loss using VMware Site Recovery Manager (SRM)
- Trigger an advanced action (power cap, load shed, failover) on configured policies (groups of devices) during specific power events with a single command
- Control rack PDUs (on, off and reboot sections or outlets)
- Monitor and manage the health, risk and efficiency of your power infrastructure by integrating into VMware’s vRealize Operations Manager
- Safely shut down and securely restore high availability environments without crashing virtual machines or host server
- OpenStack monitoring and control
- Integrations
- VMware, Citrix, Simplivity, Nutanix, Cisco, NetApp, EMC, HPE
Management
With the integration into VMware, vSphere ESXi 6.0 and vROps users have some options when it comes to IPM information views and management. Via vROps, IPM provides data to the vROps analytics engine. Eaton provides a management pack that stipulates the rules explaining what the data means; from there vROps manages the presentation of the data and meaning to the user. In vCenter IPM can run the following commands:
- VM direct – power off, power on, suspend, guest shutdown, explicit live migration
- vApp direct – start, shutdown, and suspend
- Host direct – enter/exit maintenance mode, enter/exit sleep mode, shutdown
The actual execution of theses commands remains owned by vCenter. In addition to deep VMware integration, IPM offers several other integrations with enterprise IT providers with varying levels of complexity. Eaton works with Nutanix, Simplivity, NetApp, EMC, Cisco and many others. One of their deeper integration points is with HPE OneView. HPE OneView provides IPM room, row, rack, and U information for all the servers controlled by the OneView instance. It also allows IPM to perform server-specific Power Capping to remediate hot spots without increasing the cooling costs. Eaton expects to provide an API connector later this year that will make even more meaningful and broad-based integrations with storage and server providers over time.
To access the full scope of IPM, Eaton provides a GUI for access. Signing into the GUI brings up a screen with several main tabs on the left-hand side with sub tabs for each section. The main tabs are Views, Event Logs, Management, and Settings. It should be noted that on this screen and all screens moving forward, users are able to customize their view of IPM. In the upper right-hand corner there is a small gear icon that, once clicked, users can customize their view. Most of the views displayed below are either the default or chosen to show the most amount of information.
The Views tab basically gives users two options for viewing the various nodes that they have set up with IPM (a node is defined as one UPS, rack PDU or IPM instance). Users can view their nodes as a list which shows all of their nodes and displays: Type, Status, Name, IP Address, Description, Location, Contact, with the ability to change the list at the end. This view gives users a deep overview of information at a glance. Along the bottom of the page is a quick listing of the status of the devices as well. To drill down further in any give node, one needs to simply click on it and more info will be generated on the right-hand side of the screen. Here users can get basic information, current status of the device, measurements on consumption, and a list of events.
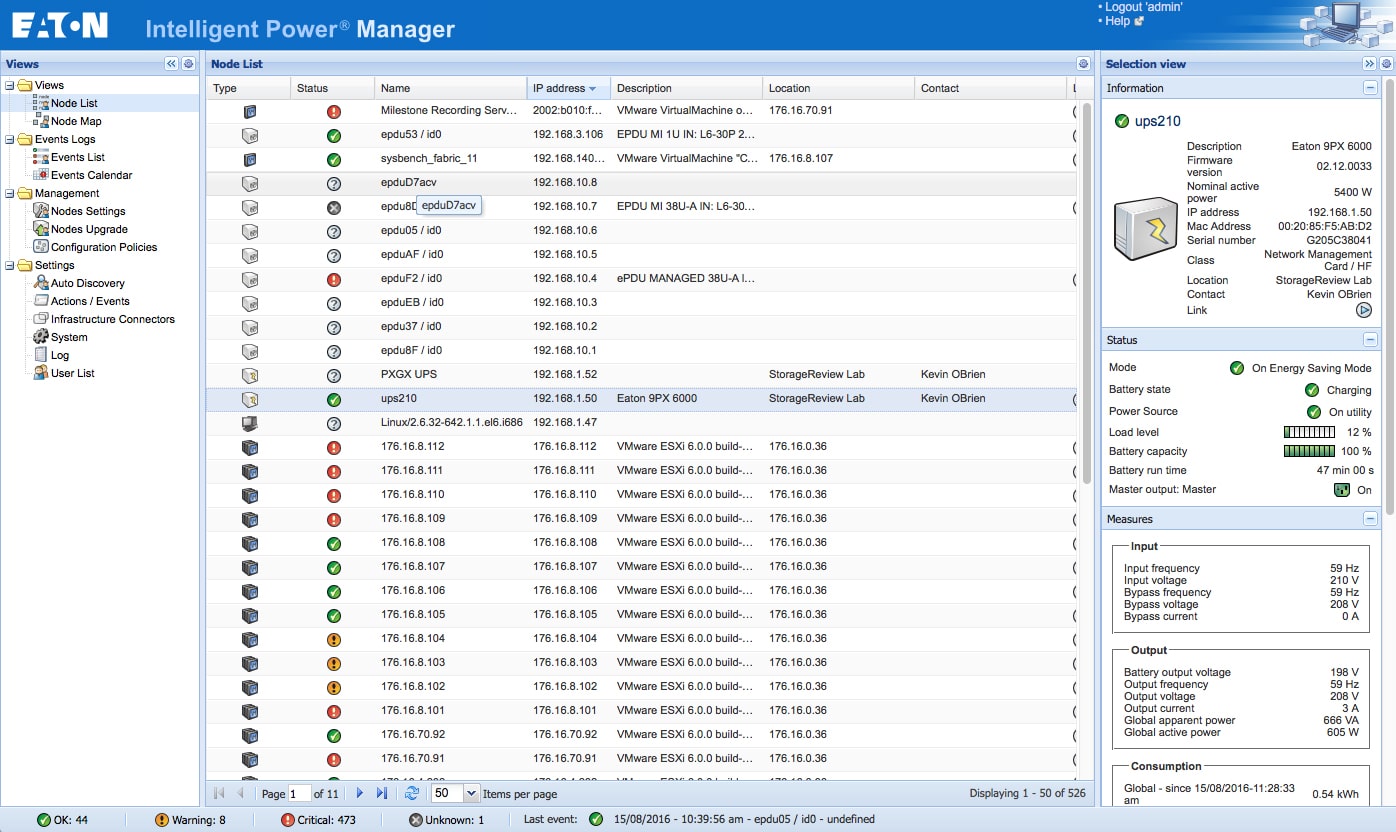
Right-click and open in new tab for larger image
The other view available is the Node Map. This view gives users a map off all connected devices with the only information available being the status indicators at the bottom of the page. Once again, users can click on any device for a detailed listing along the right-hand side of the screen.
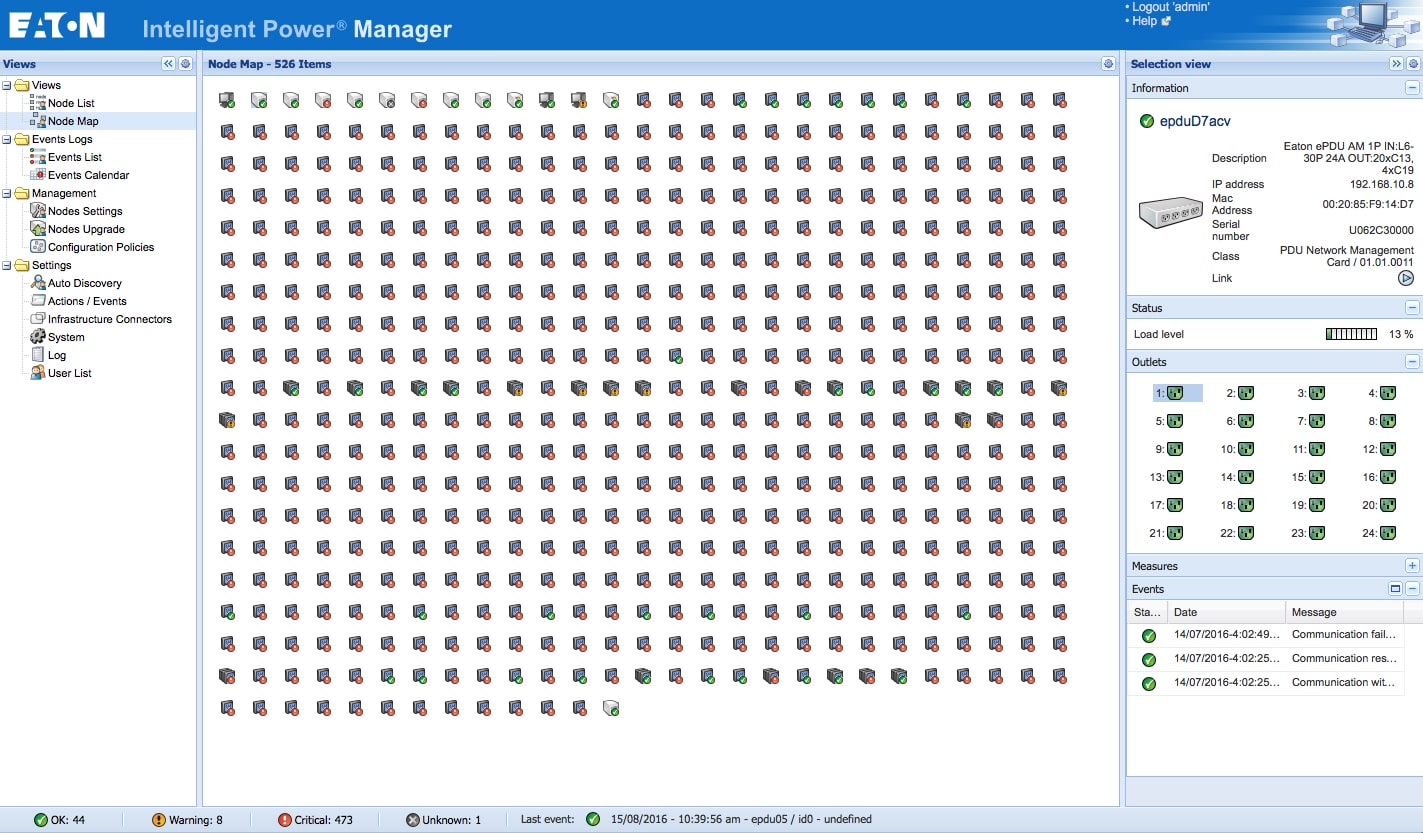
Right-click and open in new tab for larger image
The next tab group is the Events Logs. Again users are given the option of two views in the sub tab group. The first sub-tab is Events List. As the name implies, this tab lists off events that have happened in the order chosen by the user. This tab displays the status of the event, when the event took place, the name of the device that triggered the event, and a message indicating what the event was. Users can rearrange how the events are displayed and how many show up on the first screen. Once an event is selected, users can go to the right-hand side of the screen and acknowledge the selected event. The right side of the screen also allows users to acknowledge all events, toggle between showing or hiding acknowledged events, and the ability to export and/or purge logs, and select or deselect all events.
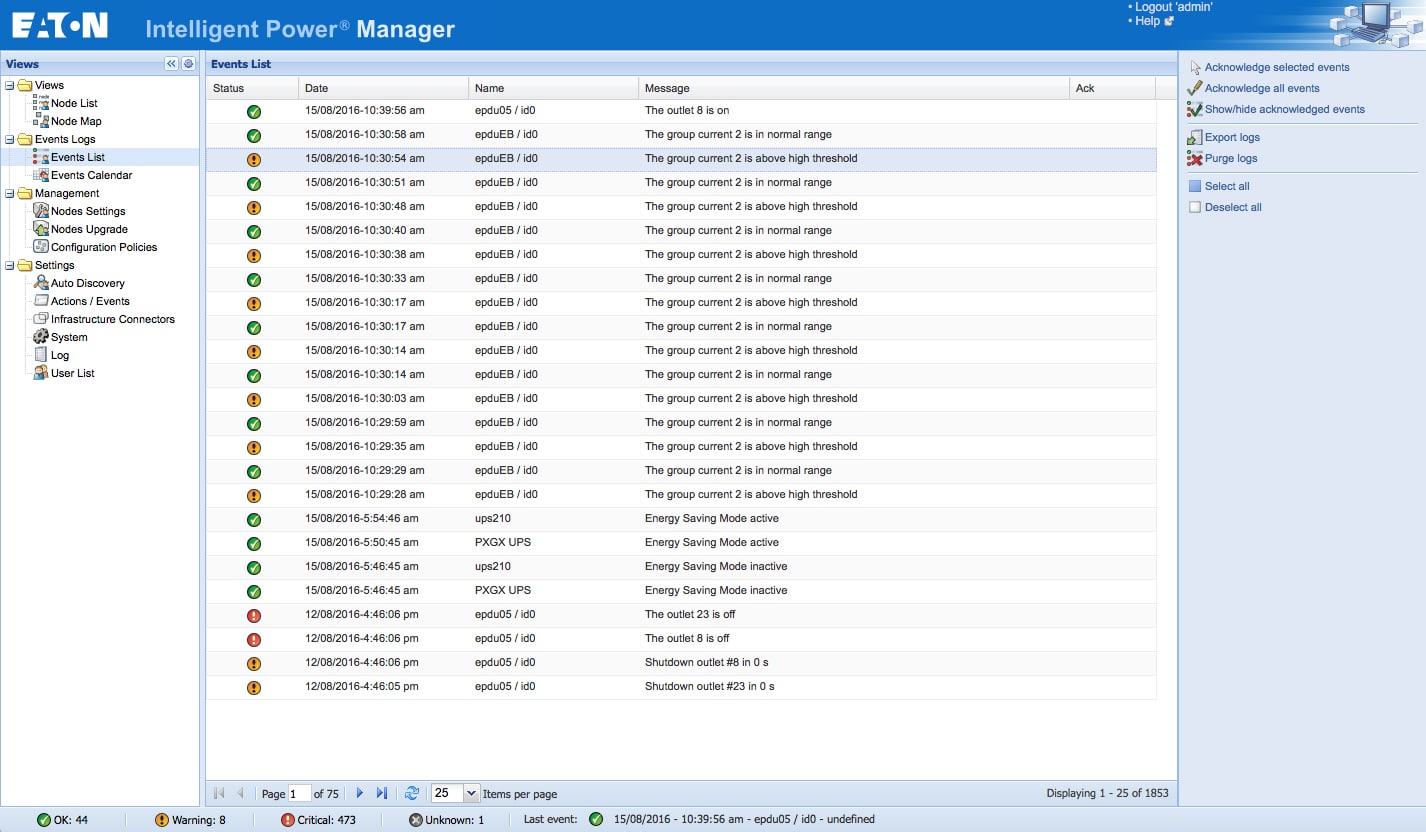
Right-click and open in new tab for larger image
The Event Calendar sub tab has a calendar with weeks running vertically down the screen and the days of the week running horizontally from each week. Each day listed contains various symbols that indicate an issue that needs to be addressed or resolved. Clicking on a day shows an event list on the right-hand side similar to the above sub tab. Users can scroll through the list to see what the issue is, acknowledge it, and switch the view in which it is displayed. Beneath this list is a display of statistics for the day highlighted.
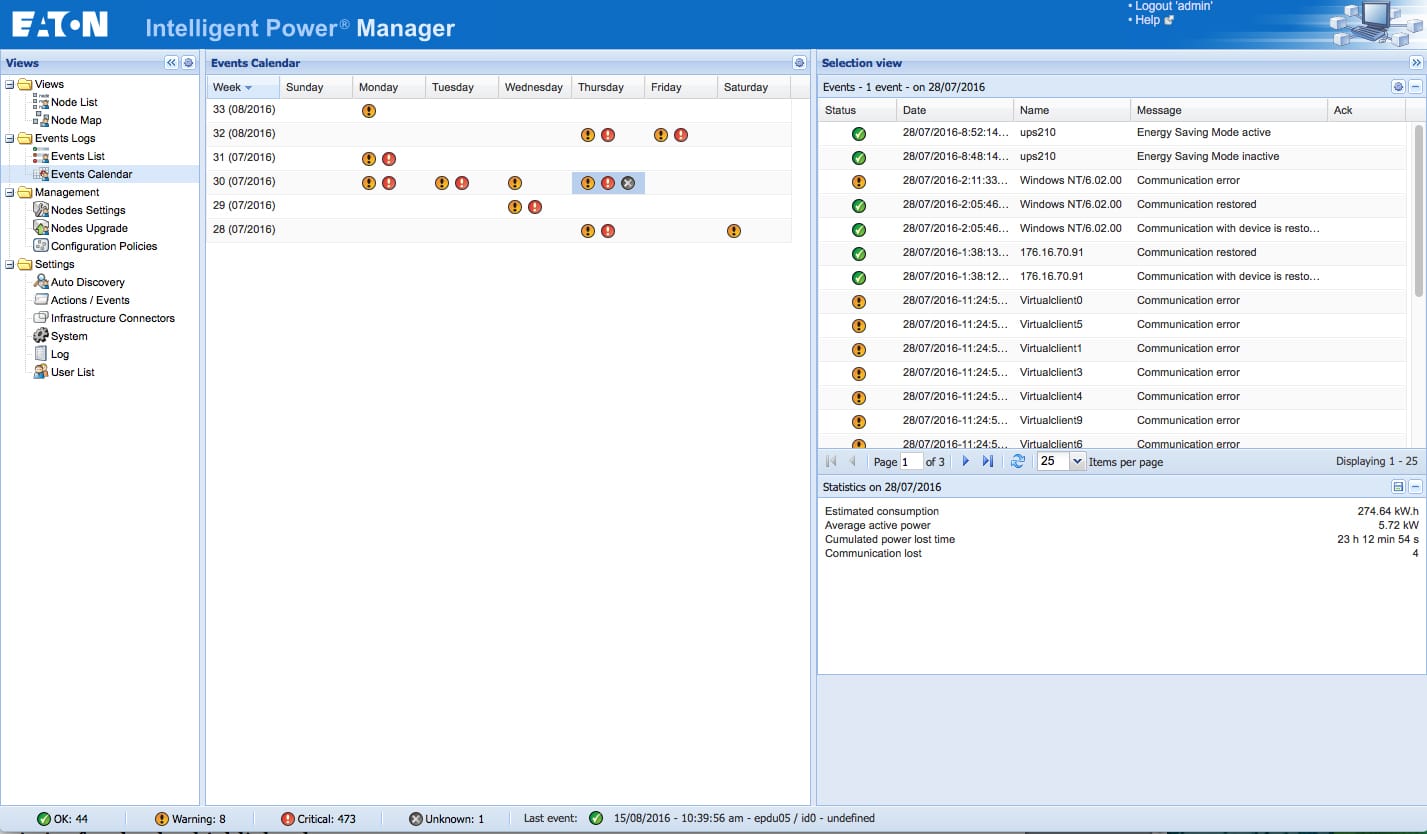
Right-click and open in new tab for larger image
The next tab is Management, the heart of the IPM. Beneath the main tab are three sub tabs: Nodes Setting, Nodes Upgrade, and Configuration Policy. The Nodes Settings tab displays all of the nodes within IPM. Clicking on a device gives users a list of current settings running down the right-hand of the screen. Each setting has a drop screen to show its current setting, as well as the ability to edit said settings. In the upper right-hand corner is a Configurations button that allows users to create new configurations, import existing configurations, or export configurations that they created.
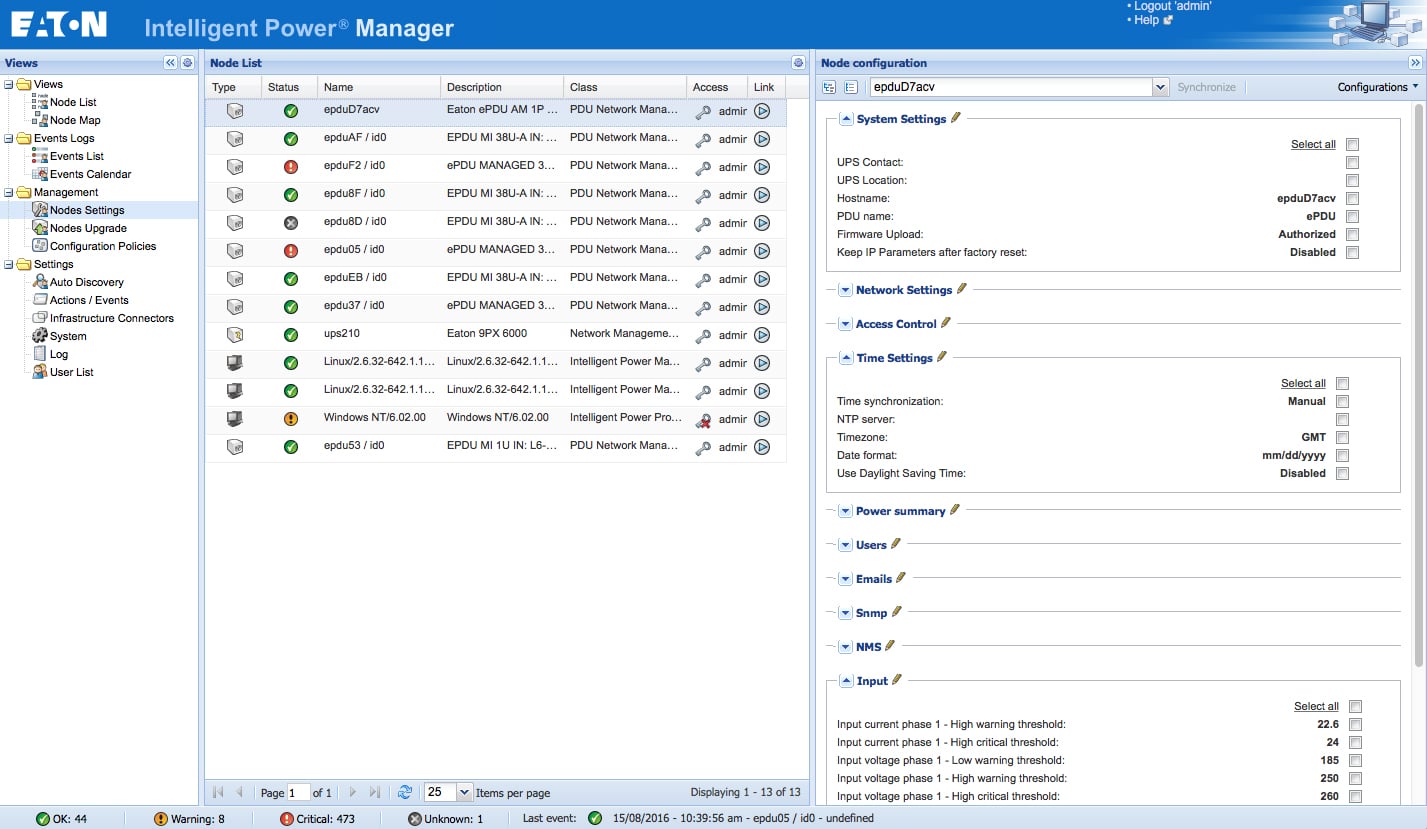
Right-click and open in new tab for larger image
The next sub tab is Nodes Upgrade. As the name implies, it is where users go to update the firmware for their nodes. Opening the tab displays the nodes by Type, Status, Name, Class, Upgrade status (whether an update is available), Access (which users have access to what nodes), and a link to the update. Clicking on one of the nodes presents users boxes on the right where they can add their firmware. They can also update several devices at once, which becomes more beneficial the larger the data center.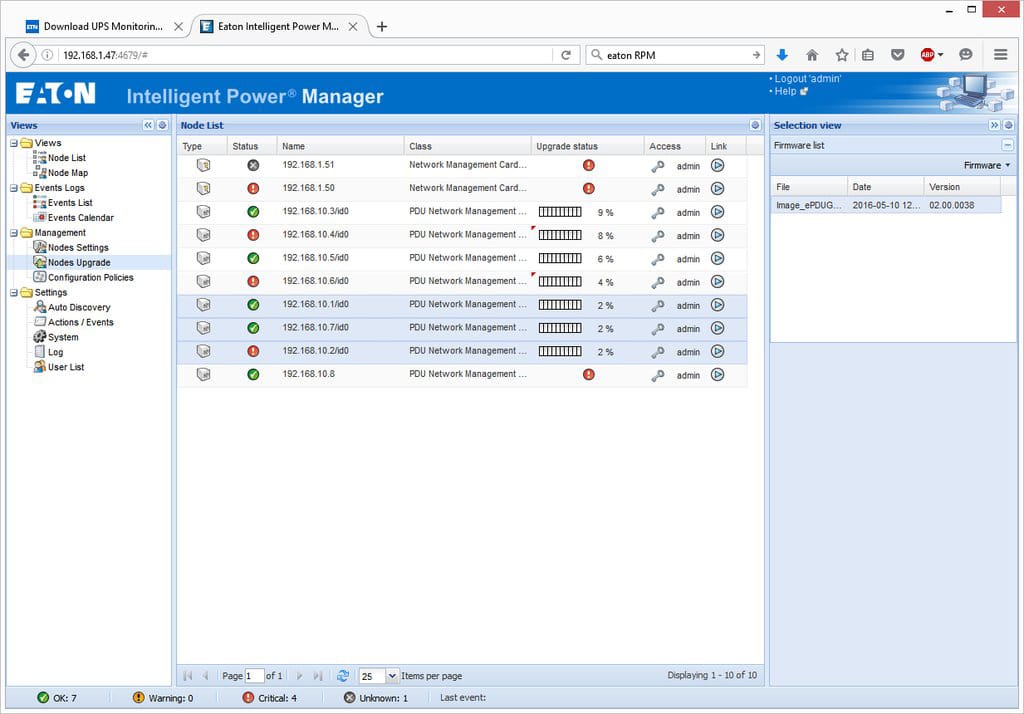
Right-click and open in new tab for larger image
The final sub tab under Management is Configuration Policies. Once a policy is set up, it can be edited or removed completely. Users can also add or remove target nodes to a policy they have configured. And they can copy a policy, if say they need a policy that is similar, but they need to edit one aspect of it for a different node.
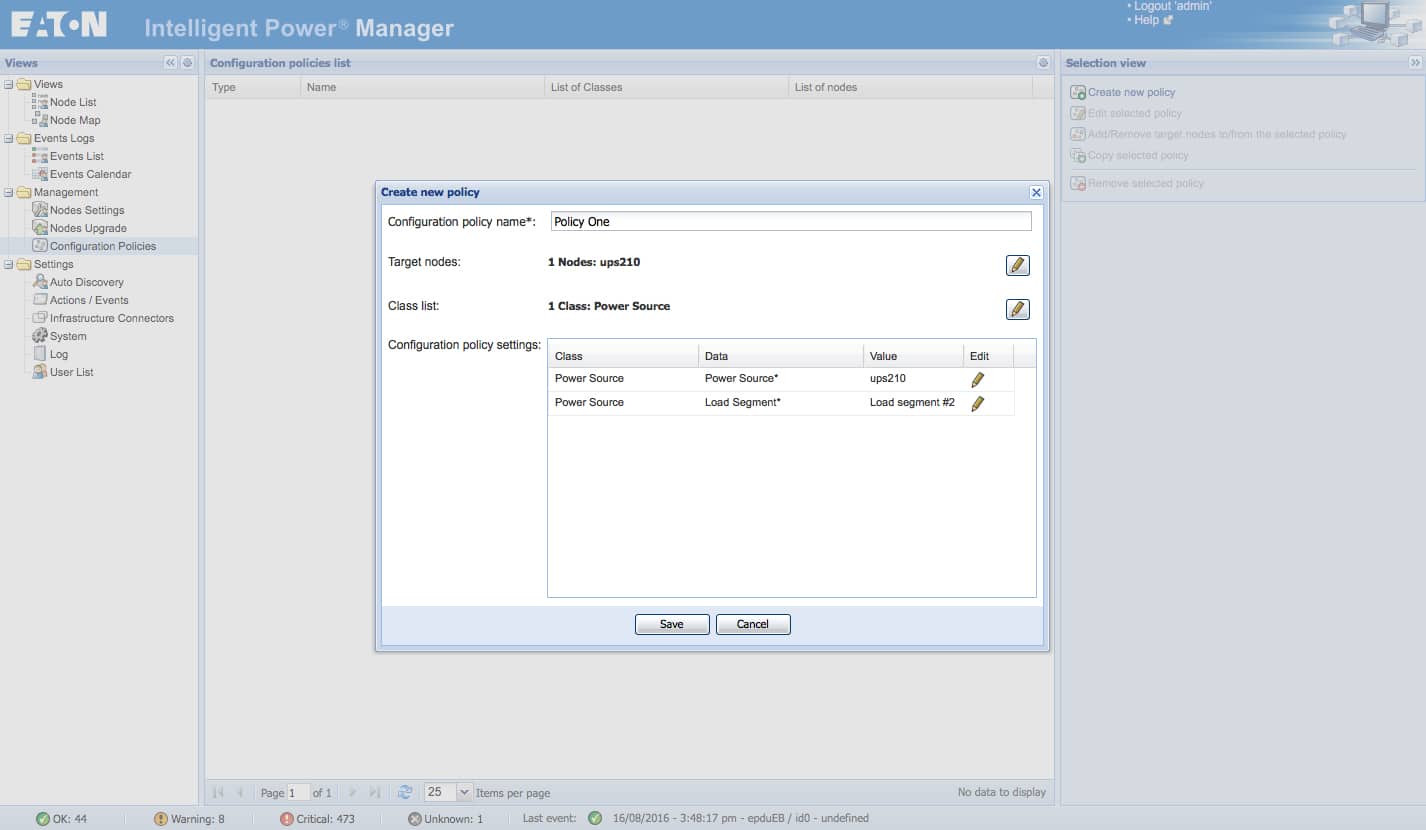
Right-click and open in new tab for larger image
The final main tab in IPM is the Settings tab. Within this tab is six sub tabs: Auto Discovery, Actions/Events, Infrastructure Connectors, System, Log, and User List. Auto Discovery allows users to find nodes and add them to IPM. Users have the option of using a Quick Scan, setting a range with a Range Scan, or using a specific address with Address(es) Scan, all located on the right-hand side of the screen. Once discovered, users are able to edit the node info, set access parameters, create new policies, remove the nodes, set up the node as a power source, edit a specific driver they would like to use, change the driver node, and export the drive to a .csv file and edit offline. With the edit-driver option, users will be able to create a driver for just about any other third-party device. For instance, users will be able to create drivers for non-Eaton UPS that they currently have and still manage this UPS in IPM.
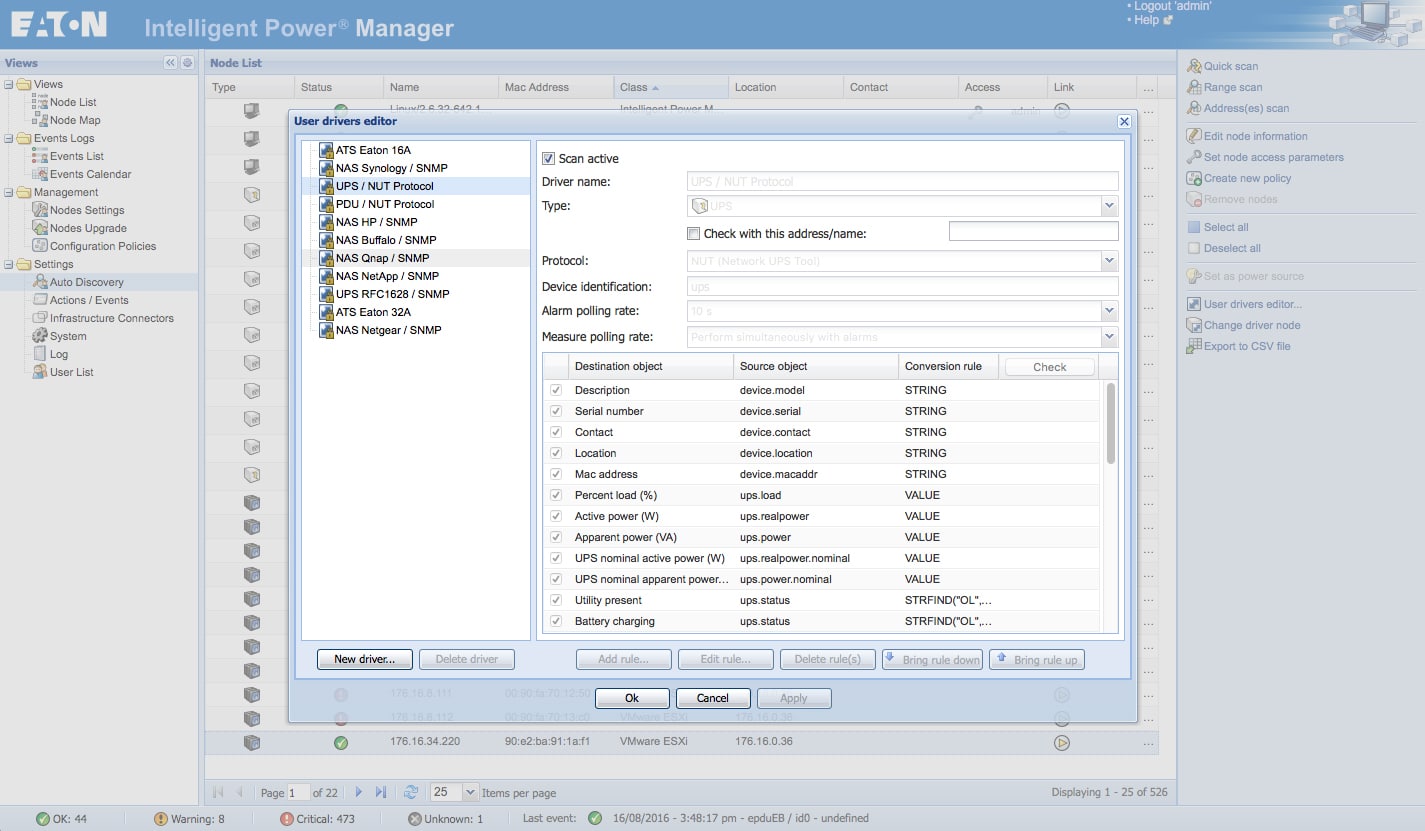
Right-click and open in new tab for larger image
The Actions/Events sub tab allows users to see the currently existing actions and how they relate to events. Users can use this sub tab to create new actions, copy an existing action, edit an action, test an action, remove an action, or edit event rules. So in the event that power is lost, the action could be to shut down non-essentials or migrate VMs.

Right-click and open in new tab for larger image
The Infrastructure Connectors sub-tab shows users where the connectors are and what product is connected. This is where the integration mentioned above comes in. In our case, we added in a connector to VMware. We found that adding other connectors generates a list of the major vendors mentioned earlier. Here users cannot only see what is connected where, but they can add new connectors, edit or remove existing ones, run a test shutdown on a connector, upgrade a connector, and create a Shutdown Policy.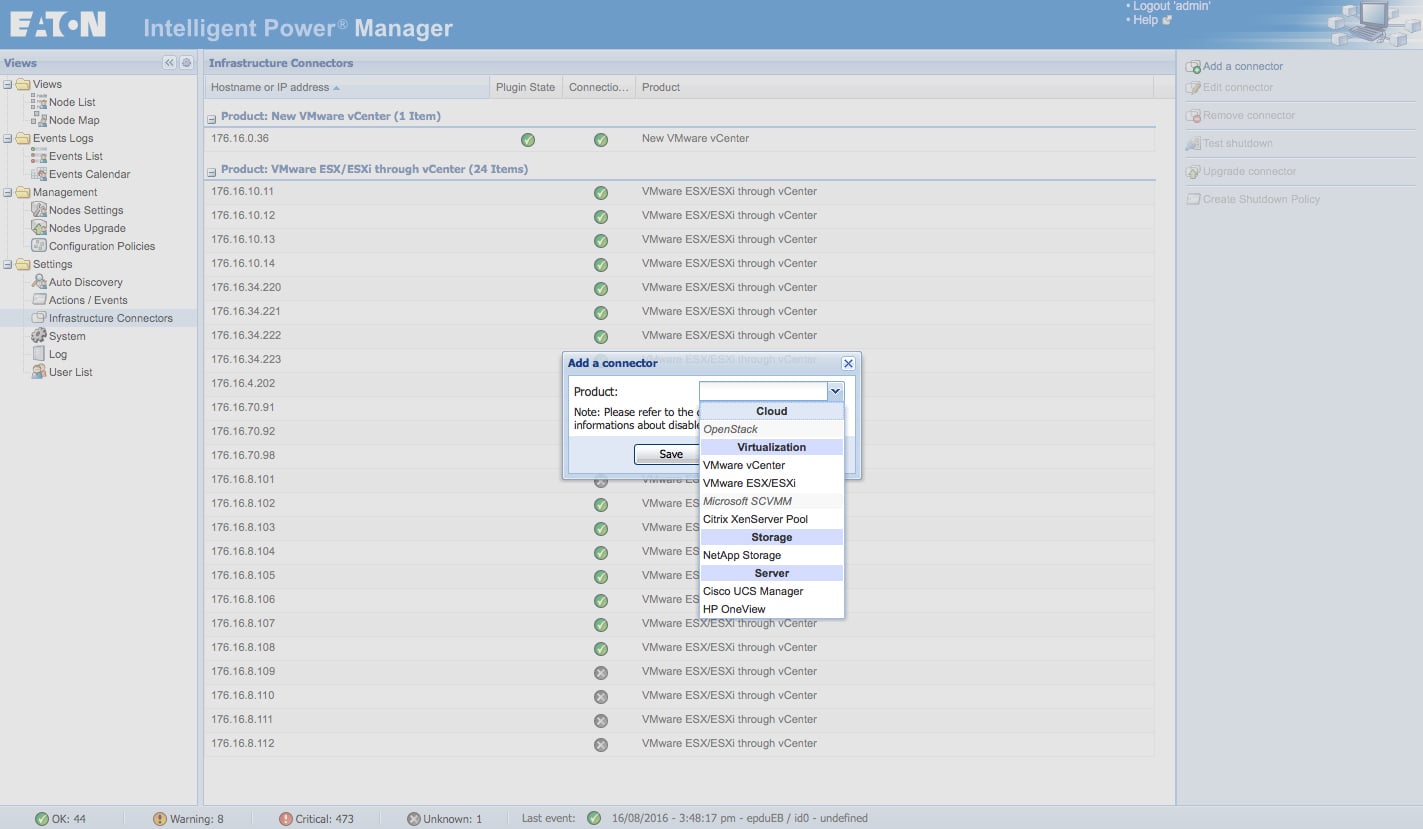
Right-click and open in new tab for larger image
The System sub tab is simpler than one would initially assume. It is basically a listing of general information about the system with the ability to edit the information on the right-hand side.
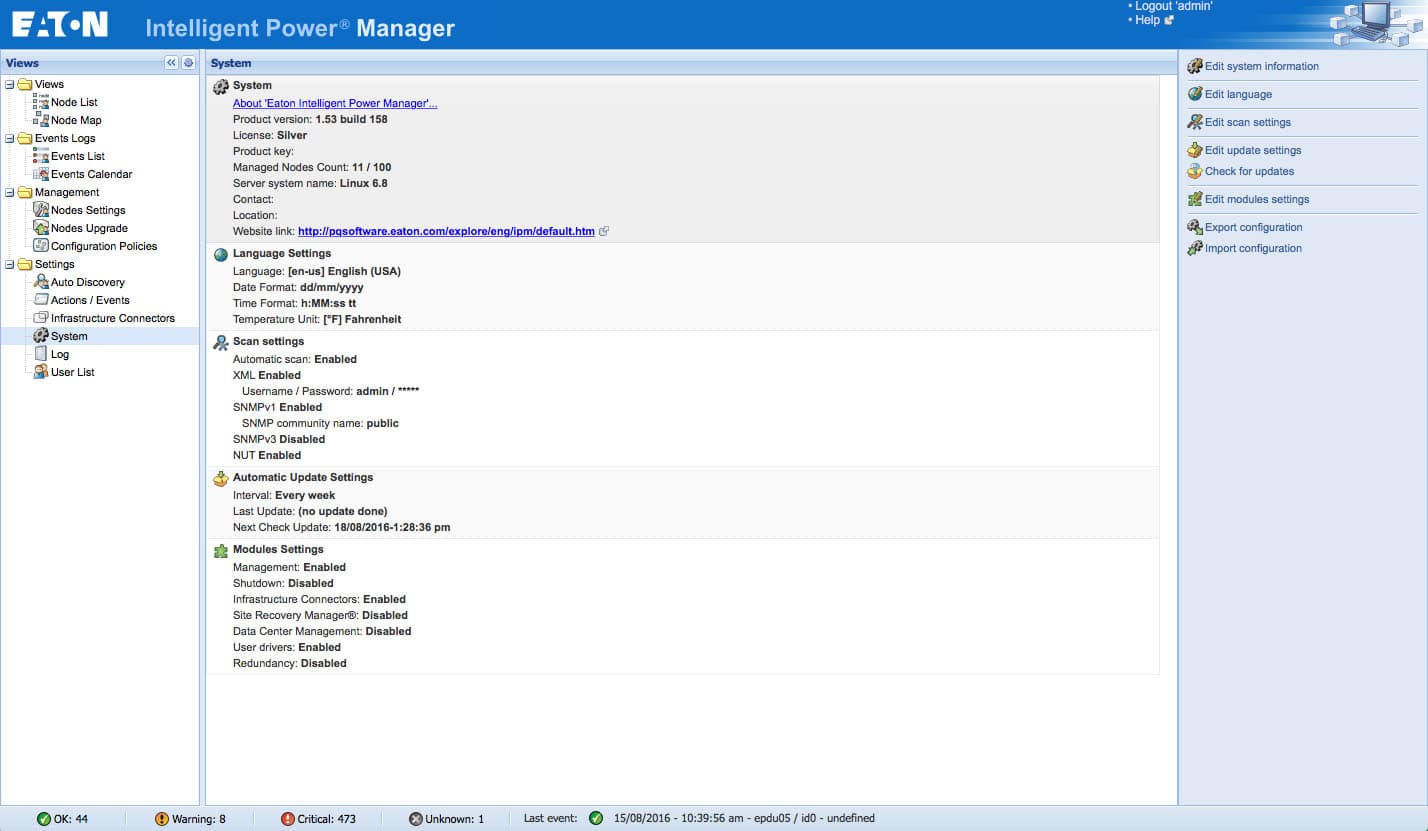
Right-click and open in new tab for larger image
The Log and User List sub tabs are self explanatory.
Usability
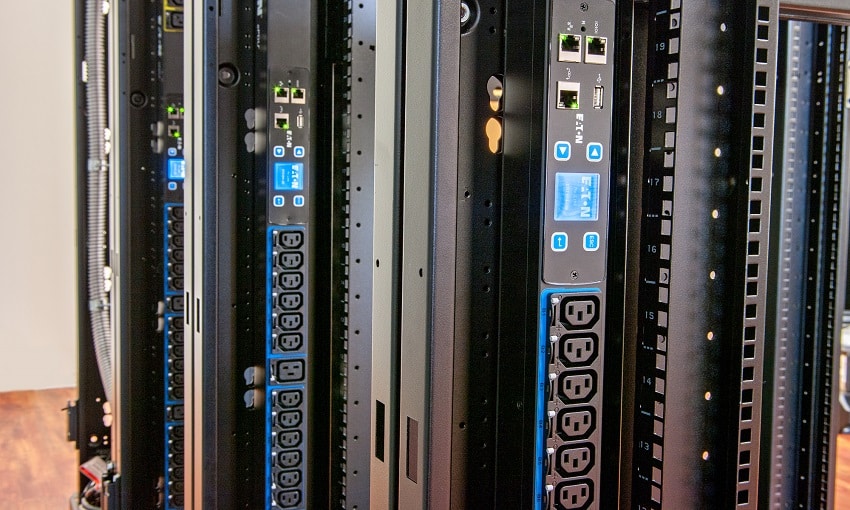
We found IPM fairly easy to install and set up. We have quite a bit of backup power gear running in our lab from Eaton including: 5PX UPS, ePDU (eAM001), 9PX UPS, BladeUPS, G3 ePDU, and of course our use of Eaton S-Series racks to hold most of our gear. IPM gave us a simple tool to control and monitor our power equipment and it shoots us alerts and alarms if something goes wrong.
While frequent blackouts are not something the StorageReview lab suffers from, brownouts, lasting 5-10 seconds, are more common here. There are swings in voltage coming into the lab that can also create issues. Recently we have had to contend with unseasonable weather and construction knocking out the power. In the event of a power outage, IPM enables the ability to quickly go through equipment and power down all non-essentials, followed by non-critical operations in an attempt to continue our testing off of our UPS. IPM also enables users to configure policies so that in the event power drops, tasks are automatically set in motion to keep critical components online as long as possible.
Conclusion
Time isn’t always money, but downtime certainly is. Outages are unavoidable but Eaton’s IPM is designed to help minimize the damage that can result from outages. IPM will enable users to better remotely monitor their power management devices and alert them when there is an issue, allowing them to react before the issue gets worse. IPM integrates with many of the big players in IT and also integrates with vSphere, enabling users to manage both their power devices and their VMware environment from the same dashboard. IPM also supports generic SNMP communication and a wide variety of third-party protocols that allows non-Eaton devices to be communicated with within IPM.
We found IPM to be a great tool in monitoring our power devices. Not only was it easy for us to use and provided us with remote-monitoring capability, it gave us another weapon in our arsenal as we try to find ideal cooling for our lab. Also, we had recently suffered a power outage as a dump truck took out a telephone pole and the power lines connected to it up the road. Our lab director was easily able to go into IPM and begin shutting down what we didn’t absolutely need, followed by other non-critical devices, to keep our benchmarks running off of our UPS.
Pros
- Industry-leading capabilities and feature set tying together the Eaton ecosystem
- Easy to deploy and manage
- Wide variety of software/hardware infrastructure integrations
Cons
- Some advanced configuration options need to be changed through console access
The Bottom Line
Eaton IPM is easy-to-use software that integrates with most of the major vendors and could potentially save companies, from very small to very large, thousands by helping them mitigate downtime.


 Amazon