

Kingston has launched the HyperX 3K SSD, a new entry in their enthusiast line of client SSDs. The twist with the HyperX 3K compared to its HyperX bigger brother is a simple NAND change. While they both use high-quality 25nm Intel MLC NAND, the 3K is rated for 3,000 P/E cycles where the HyperX is 5,000. The difference in practical terms is modest, most consumers won’t ever tax the write life of an SSD in the five year effective life of the drive. Even better then that Kingston offers the HyperX 3K SSD for those who want the great performance the HyperX line provides, with a lower price.
The obvious question many will ask is how can the same NAND be cheaper with lower write life cycle support. When IMFT in this case makes NAND wafers, the inner parts of any wafer are of higher quality and carry more endurance. The outer parts of the wafer are still of fantastic quality, but they aren’t rated for as many write cycles. Kingston has simply selected these outer wafer NAND pieces that are less expensive, but don’t sacrifice performance.
The Kingston HyperX 3K comes in 90GB, 120GB, 240GB and 480GB capacities with current street pricing of $140, $170, $340 and $700 respectively. Kingston also offers an upgrade kit with 2.5″ enclosure, screwdriver and cloning software for $10-15 more. Kingston aims to provide the HyperX 3K SSD at a lower price than the standard HyperX of the same capacity. Kingston provides a three year warranty with the HyperX SSD line.
Kingston HyperX 3K SSD Specs
- Capacities
- 90GB – SH103S3/90G
- 120GB – SH103S3/120G
- 240GB – SH103S3/240G
- 480GB – SH103S3/480G
- 2.5-inch form factor
- SandForce SF-2281 processor
- SATA III (6.0Gbps) interface
- 25nm Intel synchronous NAND memory
- Max. sequential read: 555MB/s
- Max. sequential write: 510MB/s
- Max. sustained random 4k read/write:
- 90GB – 20,000/50,000 IOPS
- 120GB – 20,000/60,000 IOPS
- 240GB – 40,000/57,000 IOPS
- 480GB – 60,000/45,000 IOPS
- Max. random 4k read/write:
- 90GB – 85,000/74,000 IOPS
- 120GB – 85,000/73,000 IOPS
- 240GB – 86,000/60,000 IOPS
- 480GB – 75,000/48,000 IOPS
- Power consumption:
- Idle: 0.455W
- Read: 1.58W
- Write: 2.11W
- Operating temperatures 0°C ~ 70°C
- Storage temperatures -40°C ~ 85°C
- Shock Resistance 1500G
- Vibration operating 2.17G
- Vibration non-operating 20G
- MTBF 1,000,000 Hrs
- Total Bytes Written (TBW)
- 90GB: 57.6TB
- 120GB: 76.8TB
- 240GB: 153.6TB
- 480GB: 307.2TB
- Dimensions: 69.85 x 100 x 9.5 mm
- Weight: 97g
- Three-year warranty
Design and Build
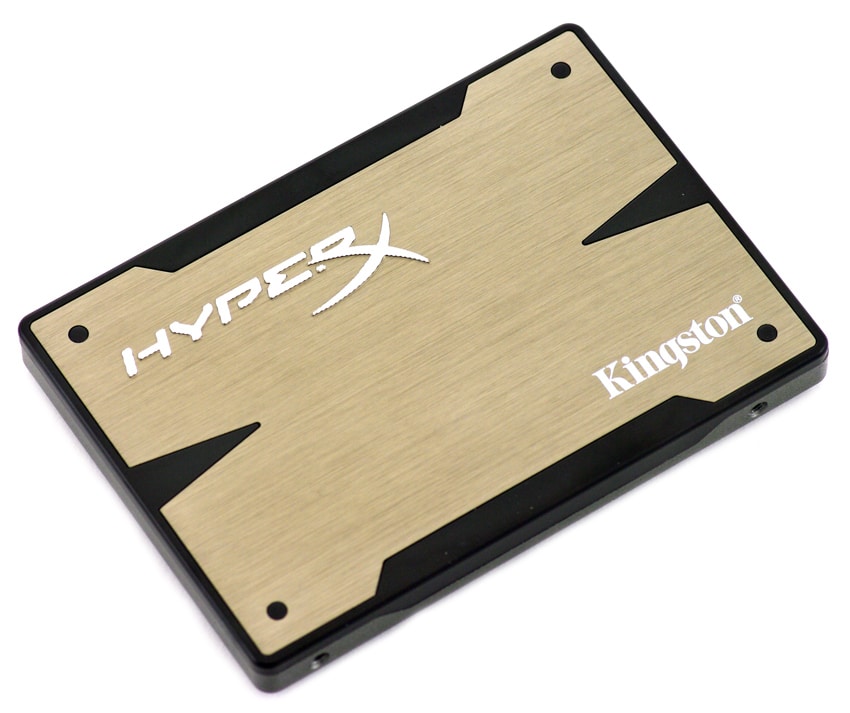
The first thing you notice when you pick up the Kingston HyperX 3K SSD is how hefty it is compared to other SSDs. This in in part to the thermal pads Kingston uses in all of their consumer and business SSDs which are designed to disperse heat from the controller and NAND into the case. The case Kingston used for this particular SSD is very rugged and durable, with a metal bottom and plastic/metal top cover. The color choice also quite aggressive for an SSD design; the gunmetal grey and black combo looks stunning. The side profile of the drive shows the case layers as well as the screw holes for a drive tray.

The front of the drive includes the standard SATA and power interface, as well as four service pins. During normal use these service pins have no function for the end user.

Before we dive into the tear-down of the Kingston HyperX 3K SSD, buyers need to be warned that opening up this particular model voids the warranty. A sticker is present that covers one of the screws that must be broken to take the case apart. With that out of the way, getting the case open may present its own challenges for some users.

With the case apart, you can see the thick thermal pads Kingston uses to draw heat off of the controller and NAND pieces to help with long term stability. This type of thermal protection is unique and not found in all consumer SSDs.
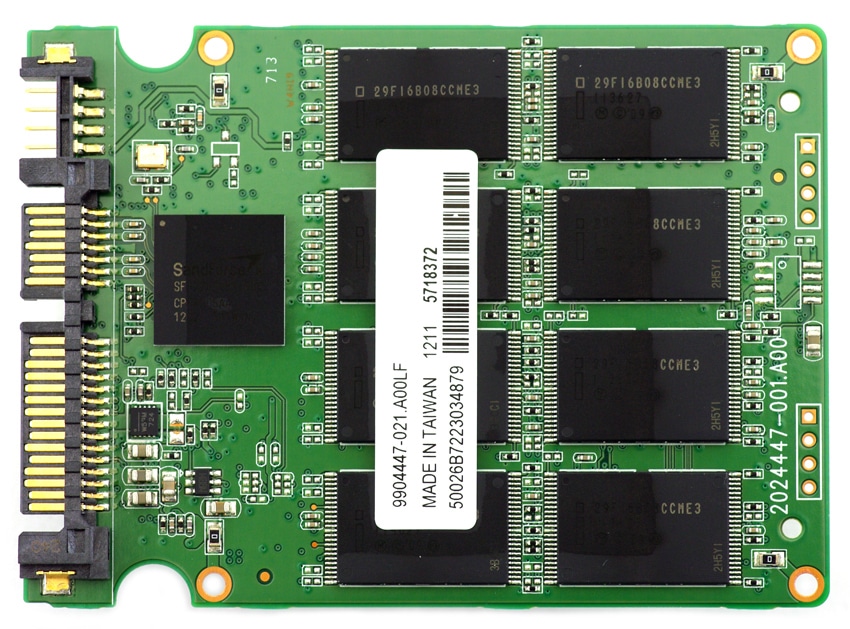
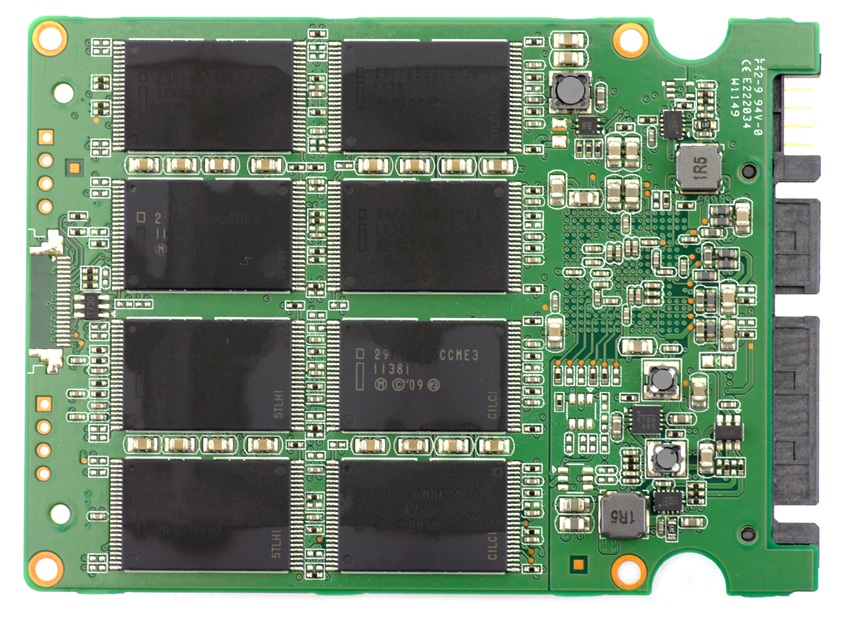
The controller found in the Kingston HyperX 3K SSD is a SandForce SF-2281 model. The 240GB HyperX 3K SSD uses a 16-piece NAND configuration, made up of 16GB synchronous Intel NAND, spread out evenly over both sides of the circuit board.
Synthetic Benchmarks
The Kingston HyperX 3K uses Intel’s 25nm synchronous MLC NAND, a SandForce SF-2281 controller and a 6.0Gb/s SATA interface; our review unit is 240GB. The comparables used for this review include the following recently tested SSDs: Intel SSD 520 (240GB, SandForce SF-2281, Intel 25nm NAND, SATA), OCZ Vertex 3 MAX IOPS (240GB, SandForce SF-2281, Toshiba 32nm MLC NAND, SATA), Plextor PX-M3P (256GB, Marvell 9174, Toshiba 24nm MLC Toggle NAND, SATA) and the Kingston HyperX SSD (240GB, SandForce SF-2281, Intel 25nm MLC NAND, SATA). All IOMeter figures are represented as binary figures for MB/s speeds. All SSDs were tested on our client testing platform.
Kingston lists the HyperX 3K SSD as having a peak sequential read speed of 555MB/s and a write speed of 510MB/s. We used IOMeter with a large-block transfer to see how the drive performed in our consumer test rig.
In our large-block sequential transfer test we measured an average read speed of 499.81MB/s and a write speed of 468.7MB/s with repeating data.
Our next test looks at large-block random transfers instead of sequential.
The new HyperX 3K picked up speed in our 2MB random-transfer test compared to the standard HyperX, measuring 498.84MB/s read and 472.07MB/s write.
Sticking with a random I/O transfer, we switch the block size to a smaller 4K transfer looking at performance at a low queue depth.
Compared to the original HyperX SSD, the new 3K model offered read-parity, but dropped behind in write performance.
In our expanded 4K read and write charts we look how performance scales as the workload increases.
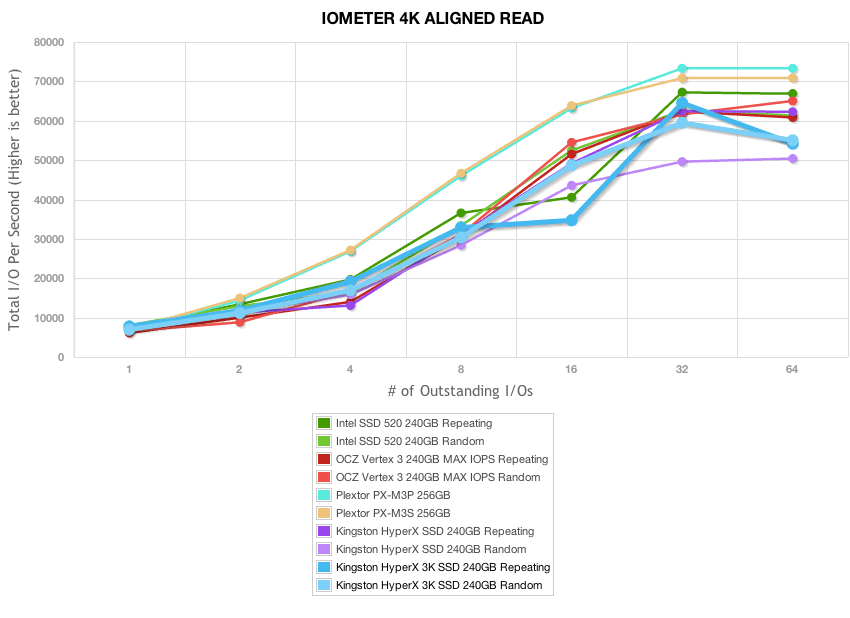
In our expanded 4K read chart, the new HyperX 3K scaled to slightly higher random 4K read speeds, peaking at 64,524 IOPS at a queue depth of 32 with repeating data.
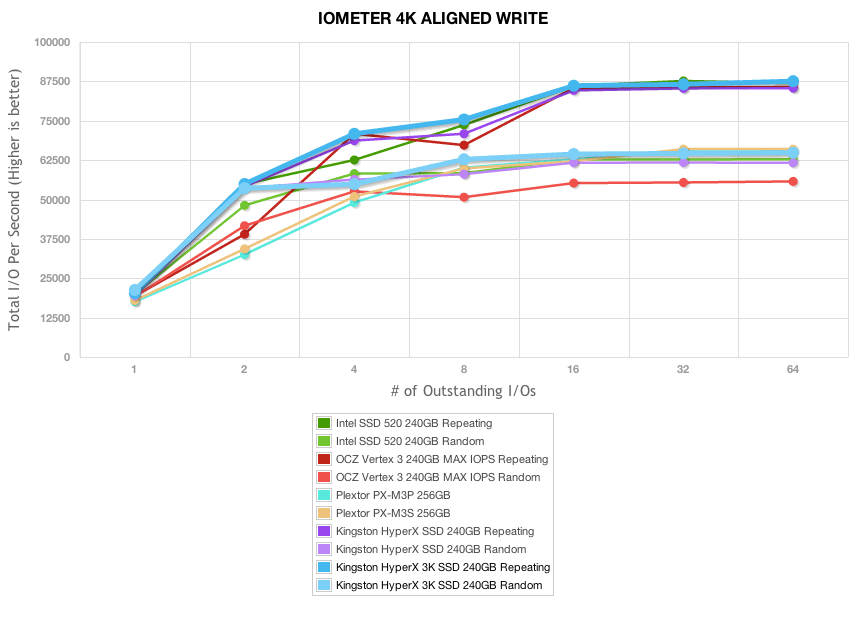
In a ramped 4K write setting, the HyperX 3K also offered slightly faster peak write speeds, topping at 87,553 IOPS.
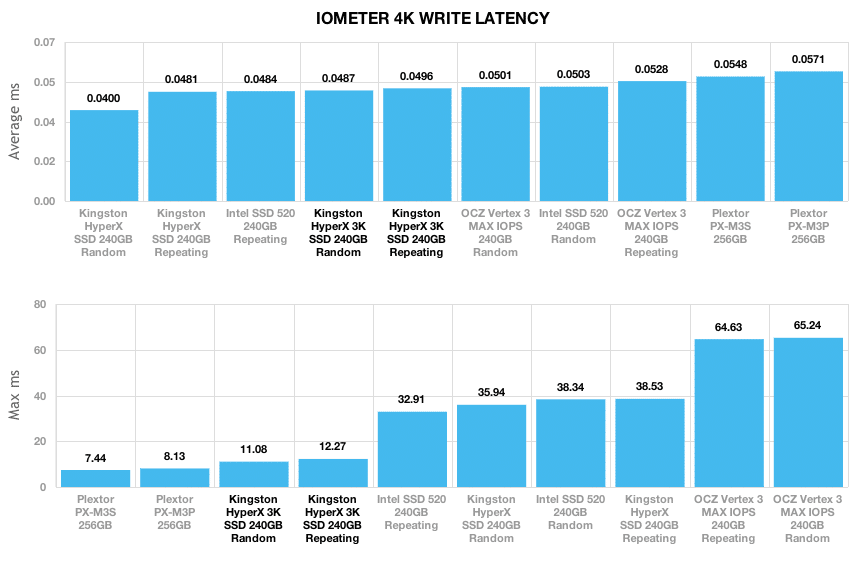
Expanding our QD1 4K test, we look at write latency of each SSD. Lower numbers are better, since it means less wait time for activity to process. Max latency is also important, although that number can change as the NAND wears over time. The Kingston HyperX 3K SSD offered low average and peak latency at QD1 in IOMeter. We measured an average latency of 0.0487ms with incompressible data and 0.0496ms with repeating data, with the HyperX 3K having very-low peak latency times of 11.08ms and 12.27ms respectively.
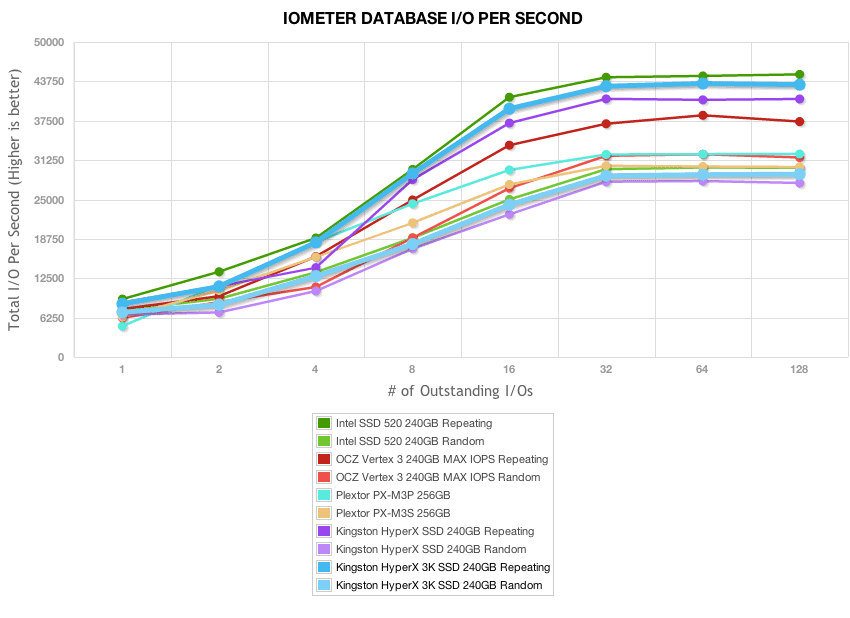
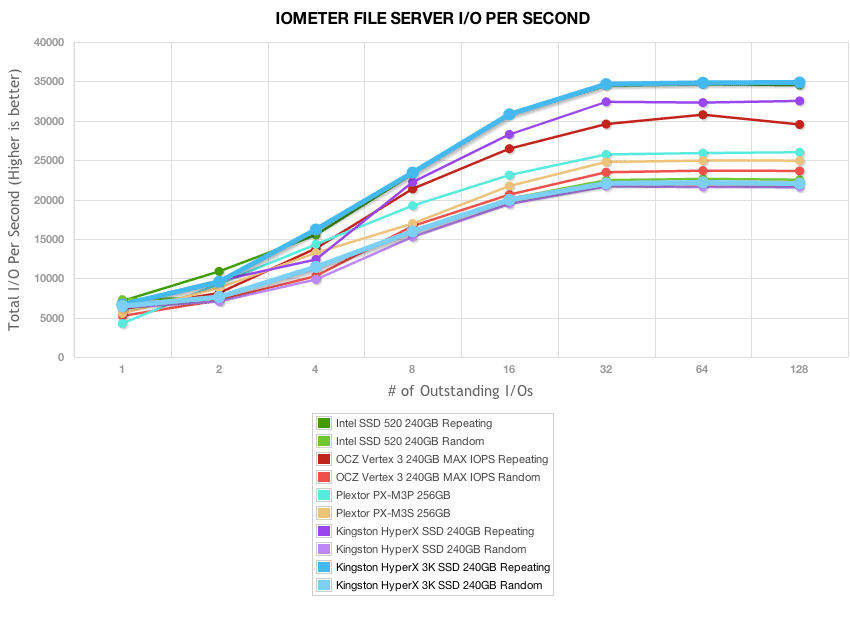
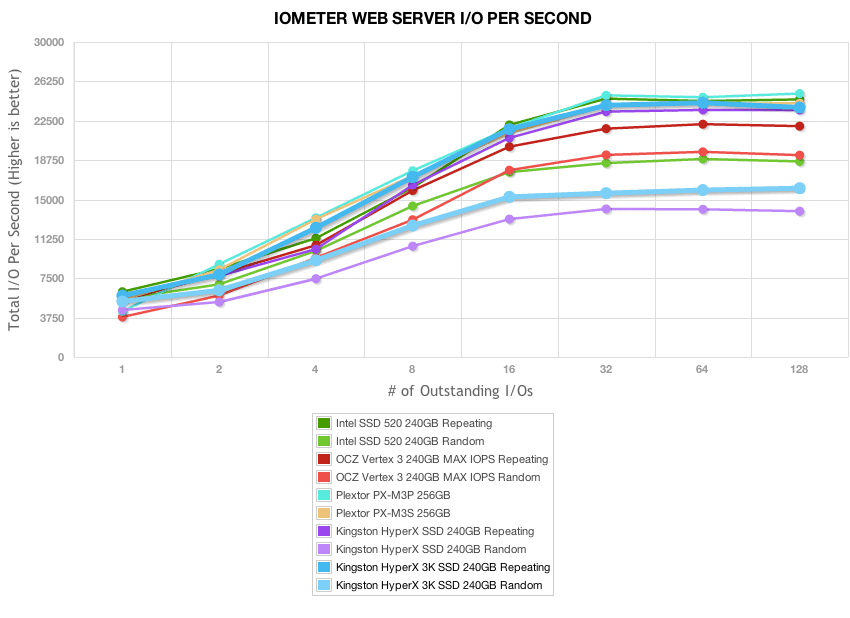
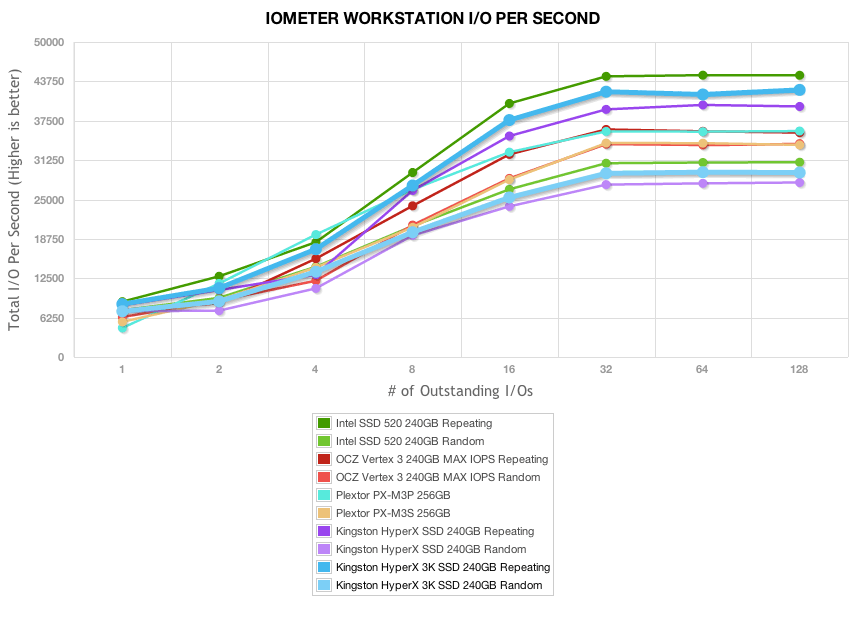
Our last group of consumer IOMeter synthetic benchmarks looks at mixed-load server profiles including Database, Workstation, File Server, and Webserver. In all mixed workloads the Kingston HyperX 3K was at top or very near throughout the tests, with a mild lead over the older HyperX.
Real-World Benchmarks
For the average consumer, trying to translate random 4K write speeds into an everyday situation is pretty difficult. It helps when comparing drives in every setting possible, but it doesn’t exactly work out into faster everyday usage or better game loading times. For this reason we turned to our StorageMark 2010 traces, which include HTPC, Productivity, and Gaming traces to help readers find out how a drive might rank under their conditions.
The first real-life test is our HTPC scenario. In this test we include: playing one 720P HD movie in Media Player Classic, one 480P SD movie playing in VLC, three movies downloading simultaneously through iTunes, and one 1080i HDTV stream being recorded through Windows Media Center over a 15 minute period. Higher IOps and MB/s rates with lower latency times are preferred. In this trace we recorded 2,986MB being written to the drive and 1,924MB being read. Our second real-life test covers disk activity in a productivity scenario. For all intents and purposes this test shows drive performance under normal daily activity for most users. This test includes: a three hour period operating in an office productivity environment with 32-bit Vista running Outlook 2007 connected to an Exchange server, web browsing using Chrome and IE8, editing files within Office 2007, viewing PDFs in Adobe Reader, and an hour of local music playback with two hours of additional online music via Pandora. In this trace we recorded 4,830MB being written to the drive and 2,758MB being read.
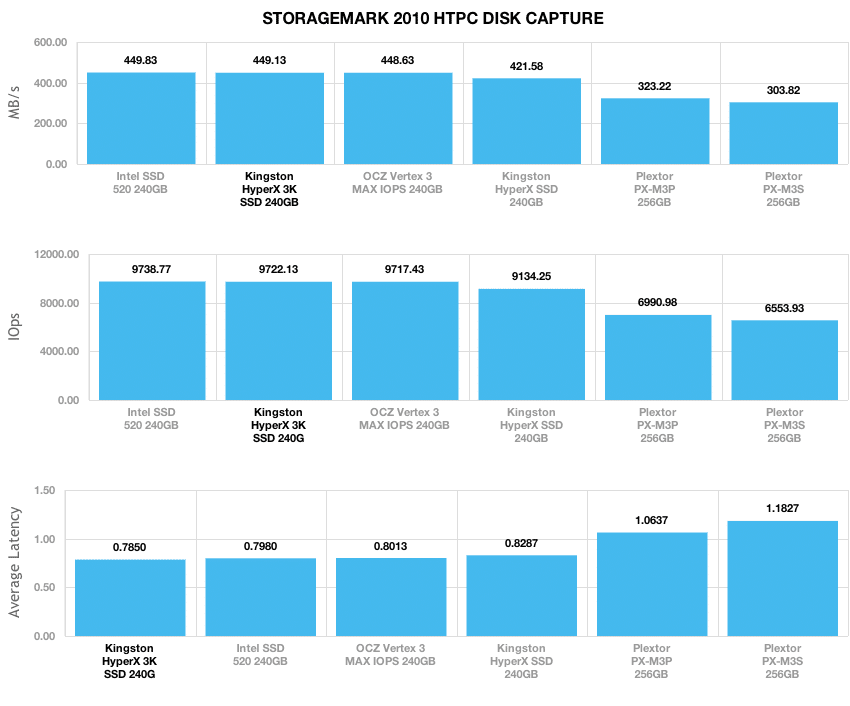
In our HTPC trace the new Kingston HyperX 3K came in with speeds matching those of the Intel SSD 520, and above the older HyperX SSD. It averaged 449.13MB/s over the duration of the test.
Our second real-life test covers disk activity in a productivity scenario. For all intents and purposes this test shows drive performance under normal daily activity for most users. This test includes: a three hour period operating in an office productivity environment with 32-bit Vista running Outlook 2007 connected to an Exchange server, web browsing using Chrome and IE8, editing files within Office 2007, viewing PDFs in Adobe Reader, and an hour of local music playback with two hours of additional online music via Pandora. In this trace we recorded 4,830MB being written to the drive and 2,758MB being read.
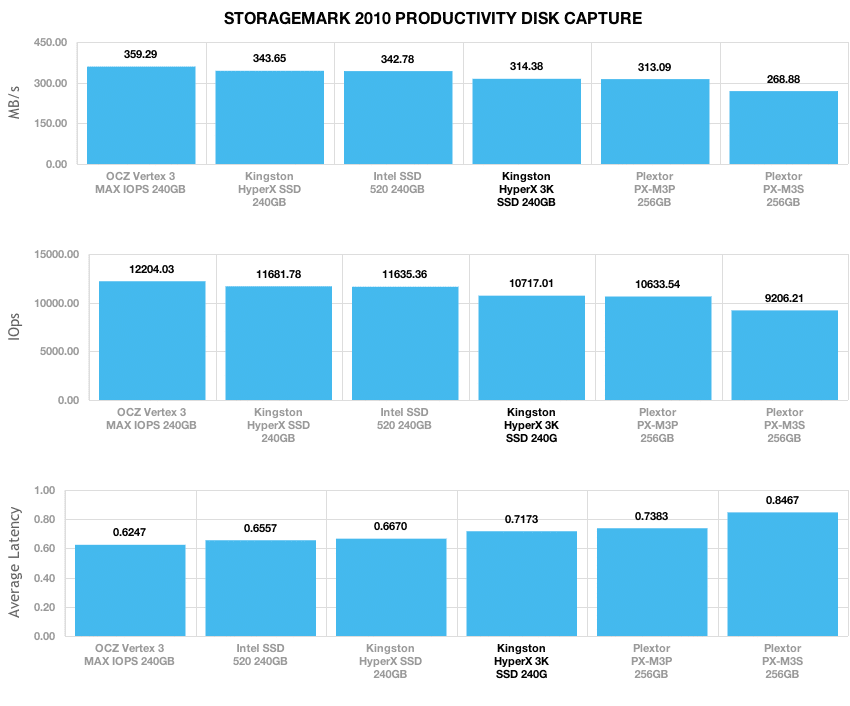
In our Productivity trace the HyperX 3K came in below the HyperX, with a speed of 314.38MB/s average.
Our third real-life test covers disk activity in a gaming environment. Unlike the HTPC or Productivity trace, this one relies heavily on the read performance of a drive. To give a simple breakdown of read/write percentages, the HTPC test is 64% write, 36% read, the Productivity test is 59% write and 41% read, while the gaming trace is 6% write and 94% read. The test consists of a Windows 7 Ultimate 64-bit system pre-configured with Steam, with Grand Theft Auto 4, Left 4 Dead 2, and Mass Effect 2 already downloaded and installed. The trace captures the heavy read activity of each game loading from the start, as well as textures as the game progresses. In this trace we recorded 426MB being written to the drive and 7,235MB being read.
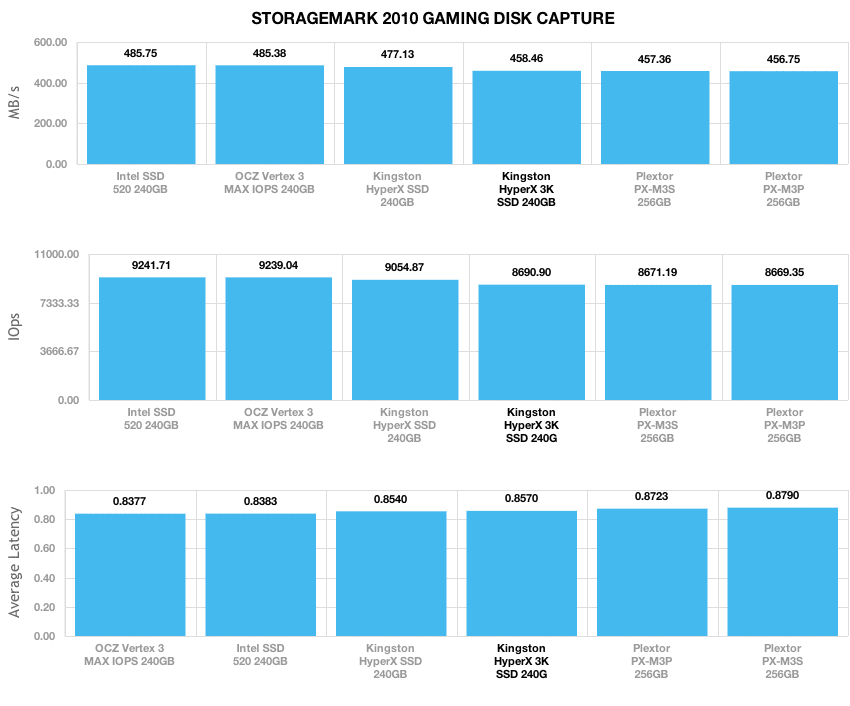
In our Gaming setting, the HyperX 3K offered an average speed of 458MB/s compared to 477MB/s from the older HyperX 3K.
Latency Benchmarks
One of the emerging trends we see affecting storage devices in consumer and enterprise applications is a disconnect between IOPS or MB/s and latency. With flash products on the market usually saturating SATA 6Gb/s interfaces with 500MB/s+ sequential read or write speeds, or hitting large IOPS figures, trying to sort through all of it in a meaningful way can get difficult. To that end we are introducing a new line of tests specifically aimed at showcasing drive latency in a way that better mimics what the products could see in the real world. Few, if any consumer drives will ever be under peak queue depth load in a normal environment, so why only test drives under those conditions?
The first set of new latency benchmarks we are introducing look at a specific I/O goal; hitting 40,000 IOPS 4K read or write under our parameters. We set the upper limit at a queue depth of 10, and see how hard each drive has to work to hit that figure. We measure the average and peak latency and rank SSDs accordingly, as well as make note of the queue depth required to hit the target. Drives that come close to missing the target, or miss it entirely are shaded red or a gradient thereof, while drives that can meet that goal with less work are closer to blue. To account for SSDs that perform higher with compressible data, we use a data-pattern with 85% incompressibility level to partially mimic the real world.
Our first latency benchmark looks at 4K read latency with a target of 40,000 IOPS.
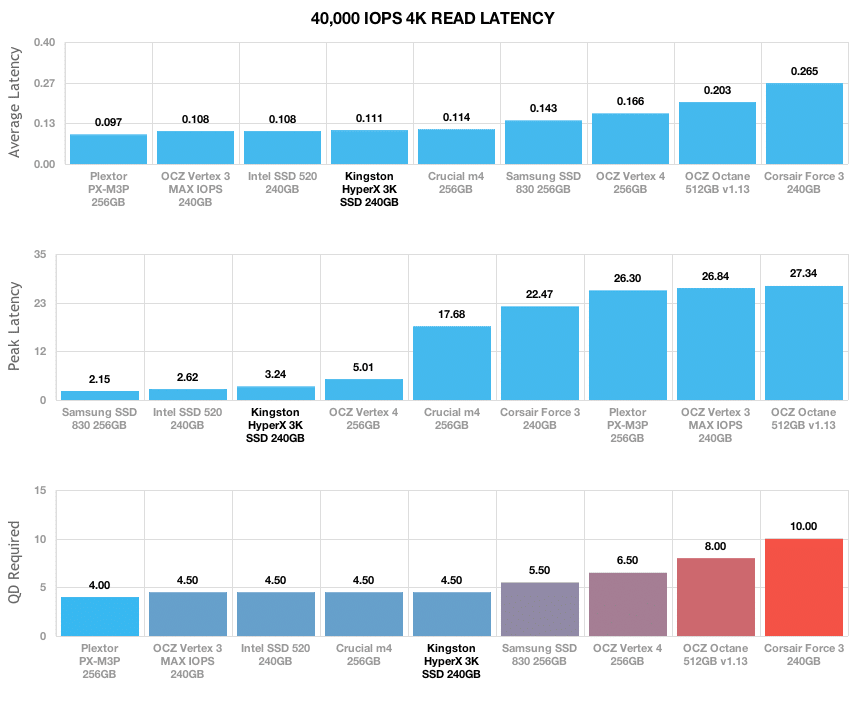
In our 40,000 IOPS 4K read test, the new Kingston HyperX 3K came in very close to the Intel SSD 520, with an average latency of 0.111ms and a peak latency of 3.24ms.
Our next latency benchmarks measured 4K write latency, also with a target of 40,000 IOPS.
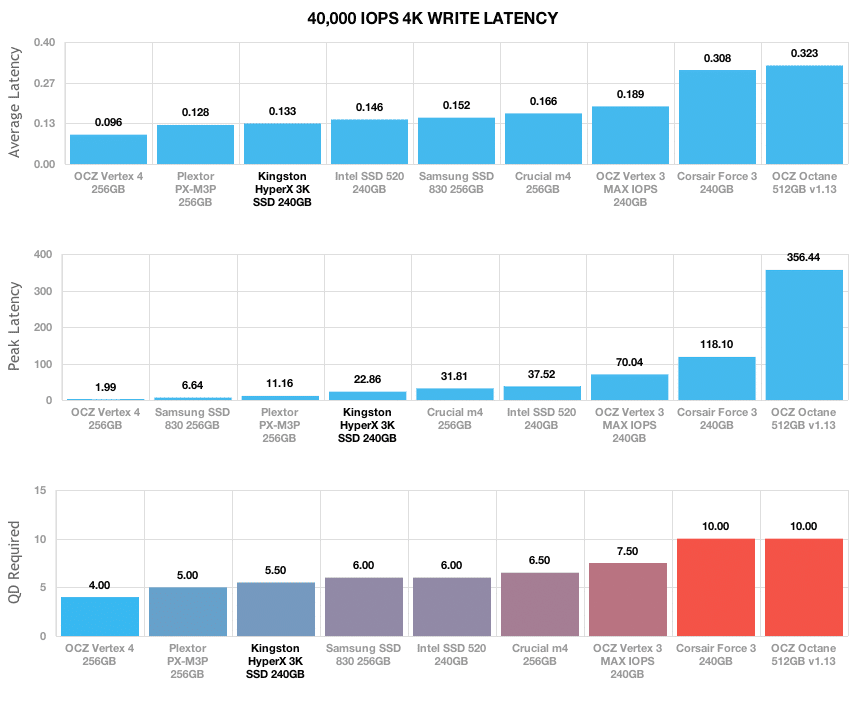
In our 40,000 IOPS random 4K write test, the Kingston HyperX 3K came out ahead of the other SandForce SF-2281 models, with an average latency of 0.133ms and a peak latency of 22.86ms.
Power Consumption
When looking at any modern SSD, power consumption is a huge deciding factor for many mobile shoppers, since the drive itself can make up a large portion of the total power used in a given notebook. In our power consumption tests we look at how much a given drive draws during read and write activities, as well as startup requirements and idle.
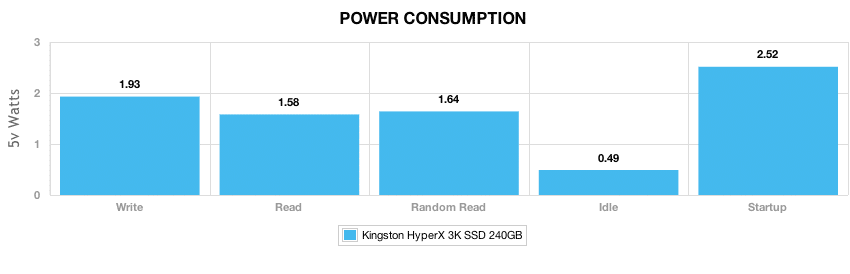
Kingston’s listed power consumption figured were very close to what we measured in our own lab. For idle they listed 0.455 watts, where we measured 0.49 watts. For read and write, they listed 1.58 and 2.11 watts, while we measured 1.58 and 1.93 watts. For random 4K read we measured 1.64 watts. The highest power usage came under startup conditions, where the HyperX 3K needed 2.52 watts.
Conclusion
The Kingston HyperX 3K SSD is an interesting offering. Kingston took what was a very good enthusiast SSD in the original HyperX, and made a compromise on NAND quality to give them the flexibility to drive pricing down for the consumer. Compromise shouldn’t be taken as a negative though, SSDs are gradually moving to lower cost NAND as controllers, firmware and software get more adept at managing flash and achieving more write cycles than previously.
When we look at the HyperX 3K specifically, it lives up to the promise. We found performance to be roughly the same to the HyperX, some a little slower, some a little faster, but a net neutral in aggregate. In retail the 3K is for the most part less expensive than the original, but in talking to Kingston, it’s clear they plan on promotions and other activities to drive the retail price of the 3K down, so the mainstream buyers can take advantage of the 3K’s enthusiast speeds.
It’s true that the reduced quality NAND does reduce the amount of data that can effectively be written to the drive. That’s a fair trade though as consumers historically barely scratch the surface when it comes to drive writes. If you fit the profile of a mainstream user that might not come close to putting a dent in the TBW of your future SSD, the HyperX 3K is a very good choice with barely impact on performance.
Pros
- Minimal performance impact with lower-grade NAND (faster in some cases)
- Offered as a lower cost alternative without replacing existing higher-endurance model
- Very low response times in our new fixed I/O latency test
Cons
- Slips behind slightly in our gaming trace
Bottom Line
Kingston promised a less expensive SSD in the HyperX 3K, with the same performance as the original HyperX. They delivered on both counts, lowering the price threshold for enthusiast-grade SSD performance. Sure consumers give up write cycles, but few will hit 3,000 P/E cycles anyway and while Kingston won’t say it, the drive will probably long outlast the quoted endurance figures.
 Kingston HyperX 3K SSD at Amazon.com

 Amazon