

The Kingston SSDNow KC100 may sit in Kingston’s business-class family of SSDs, but don’t let the standard grey casing fool you – it’s a performance drive through and through. Sharing the same high-throughput components as their enthusiast-grade HyperX SSD, the Kingston KC100 gives client users within the enterprise up to 555 MB/s read speeds and 510 MB/s writes thanks to the SATA 6Gb/s interface, SandForce controller and Intel NAND.
Aside from the casing, the KC100 and HyperX are nearly identical; the differences are in the details. The two drives share the same firmware, but the KC100 enables enterprise SMART values like soft read error rate, IOEDC errors, uncorrectable sector count and SATA R-errors count. The KC100 is also enterprise friendly in that it records unexpected power loss events. While the HyperX has that as well, Kingston is on the forefront in this regard.
Kingston offers the KC100 in 120GB, 240GB and 480GB capacities, our review unit is 240GB. Kingston also offers the drive in an upgrade kit bundle with includes external enclosure, cloning software and cables for a modest premium.
Kingston SSDNow KC100 Specifications:
- Form factor 2.5-inch
- Interface SATA Rev. 3.0 (6Gb/s), SATA Rev. 2.0 (3Gb/s)
- Intel 25nm Synchronous MLC NAND
- LSI SandForce SF-2281 Controller
- Capacities
- 120GB
- SATA 6.0Gb/s – 555MB/s read, 510MB/s write
- SATA 3.0Gb/s – 280MB/s read, 260MB/s write
- Sustained 4K Performance – 20,000/60,000 IOPS
- Max 4K Performance – 90,000/70,000 IOPS
- 240GB
- SATA 6.0Gb/s – 555MB/s read, 510MB/s write
- SATA 3.0Gb/s – 280MB/s read, 260MB/s write
- Sustained 4K Performance – 20,000/60,000 IOPS
- Max 4K Performance – 90,000/60,000 IOPS
- Formatted Capacity – 224GB
- 480GB
- SATA 6.0Gb/s – 540MB/s read, 450MB/s write
- SATA 3.0Gb/s – 280MB/s read, 260MB/s write
- Sustained 4K Performance – 60,000/45,000 IOPS
- Max 4K Performance – 77,000/45,000 IOPS
- 120GB
- Warranty/support five-year warranty with free 24/7 support
- Enterprise SMART Tools Reliability Tracking, Usage Statistics, Life Remaining, Wear Leveling, Temperature, Drive Life Protection
- Power Consumption 0.455 W (TYP) Idle / 1.6 W (TYP) Read / 2.05 W (TYP) Write
- Dimensions 69.85mm x 100mm x 9.5mm
- Storage temperatures -40 ~ 85°C
- Operating temperatures 0 ~ 70°C
- Vibration operating 2.17G
- Vibration non-operating 20G
- MTBF 1,000,000 Hrs
- Three Year Warranty
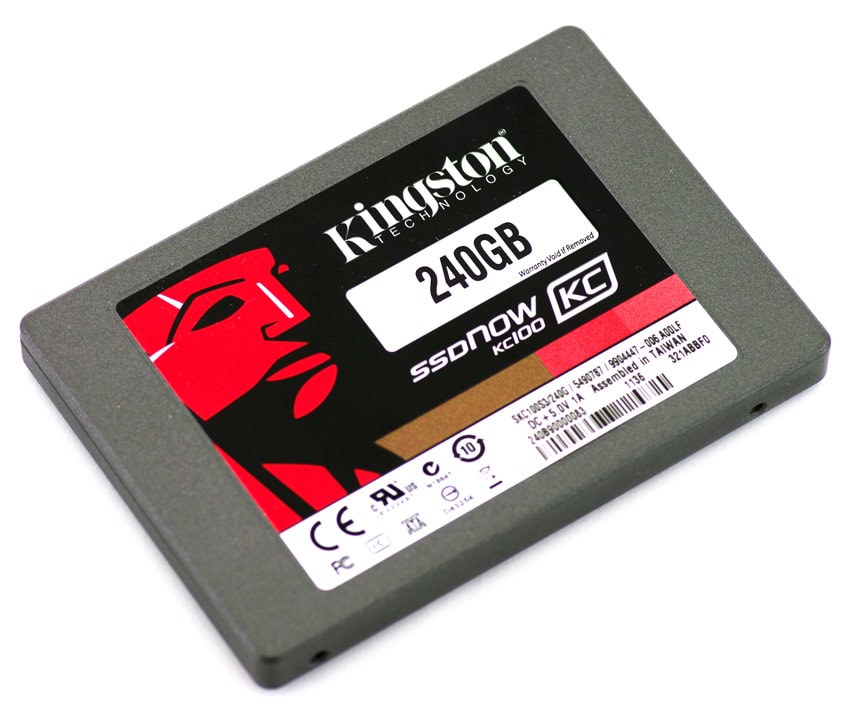
Aesthetics
The Kingston SSDNow KC100 has a metal alloy case split between two halves connected with screws. The case has a bit of heft to it compared to other SSDs we have reviewed, with a very sturdy feel. The KC100 has a single drive sticker on the top, showing the drive information, including model, firmware revision, and serial number amongst other things.
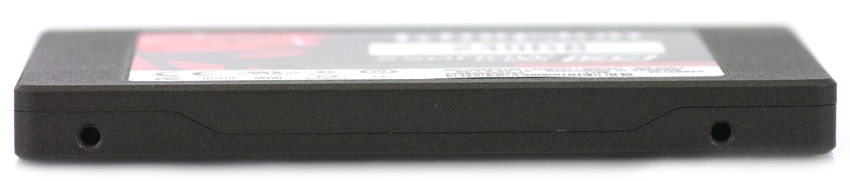
The side profile of the SSD shows the seam where the top and bottom case segments meet and align for a precise fit in any 2.5-inch drive enclosure.

The front of the drive has a standard SATA data and power interface, with service pins next to it.
Disassembly
The SSDNow KC100 is simple to take apart, if you have a security Torx bit. While most other SSD manufacturers opt for using standard Phillips head or Torx screws, Kingston went a non-tamper route to further limit users from opening the drive. Considering there is a warranty void if removed sticker on the back and no user-serviceable parts inside, there is really no reason why anyone should need to open up the case during the use of this SSD.
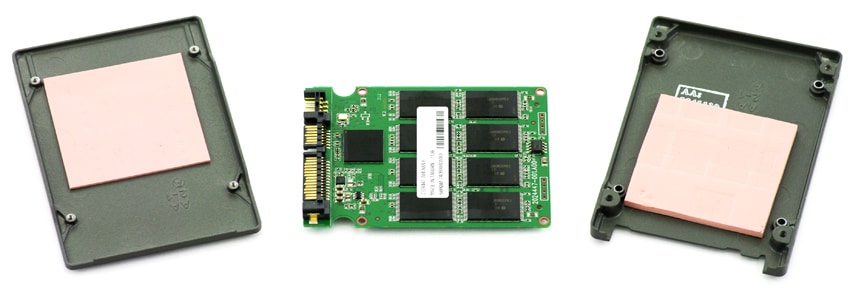
Inside we see that Kingston continues the tradition of using thermal pads above and below the circuit board to draw heat away from components such as the SandForce SF-2200 controller and Intel NAND. This is rather unique, as few SSD manufacturers go this route for drives that are designed for PC/workstation use. Good thermals are important though, especially if an SSD is going to be pressed hard, so while a seemingly small design feature, for heavy use this is a critical addition. To give an example of where these played a part, in our enterprise testing the thermal pads helped draw much of the heat away from the components and evenly dissipated it into the case.
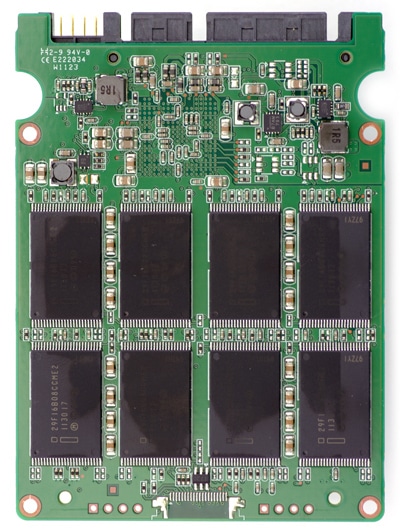
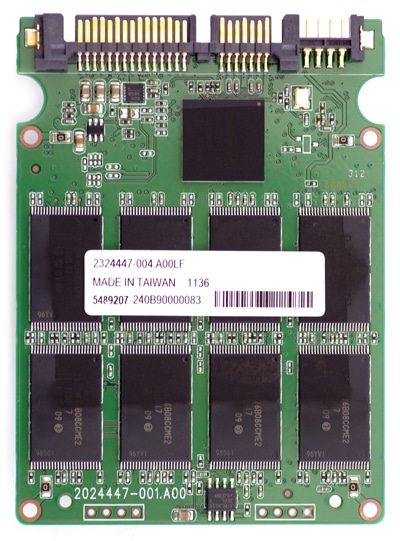
The Kingston SSDNow KC100 is powered by a SandForce SF-2281 processor, connected to sixteen 16GB Intel Synchronous NAND pieces. They are divided evenly on both sides of the circuit board, with eight on top and eight on the bottom.
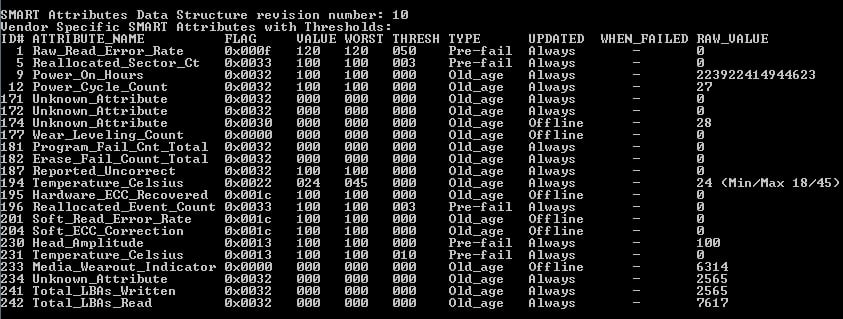
With the primary difference between the business/enterprise SSDNow KC100 and consumer SSDNow HyperX being SMART attribute differences, we turned to the console for a comparison. The first shown is the standard consumer LSI SandForce SMART readout.
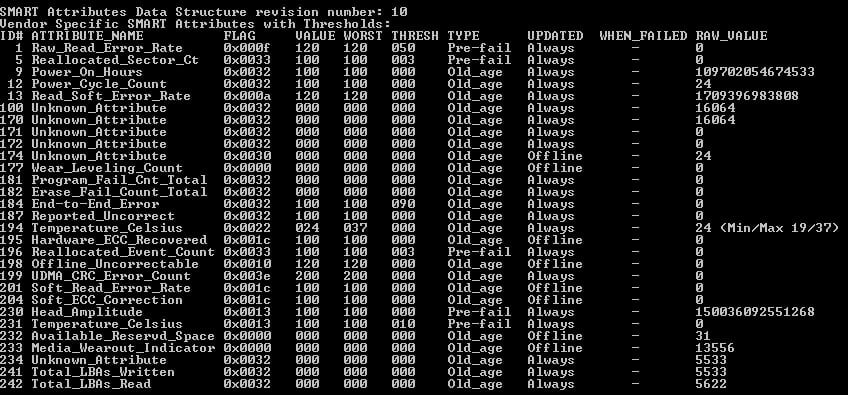
Next is the SSDNow KC100, which adds soft read error rate, IOEDC errors, uncorrectable sector count and SATA R-errors count.
Client Synthetic Benchmarks
The Kingston SSDNow KC100 uses Intel’s 25nm consumer MLC NAND, a SandForce SF-2281 controller and a 6.0Gb/s SATA interface; our review unit is 240GB. The comparables used for this review include the following recently tested SSDs: Intel SSD 520 (240GB, SandForce SF-2281, Intel 25nm NAND, SATA), Kingston HyperX SSD (240GB, SandForce SF-2281, Intel 25nm MLC NAND, SATA), and OCZ Vertex 3 MAX IOPS (240GB, SandForce SF-2281, Toshiba 32nm MLC NAND, SATA). All IOMeter figures are represented as binary figures for MB/s speeds.
Kingston lists the SSDNow KC100 as having a peak sequential read speed of 555MB/s and a write speed of 510MB/s. We used IOMeter with a large-block transfer to see how the drive performed in our consumer test rig.
With repeating data the Kingston SSDNow KC100 measured 500.88MB/s read and 462.5MB/s write. With incompressible data speeds dropped to 498.35MB/s read and 294.96MB/s write.
Our next test sticks with the same large-block transfer but switches from sequential to random transactions.
The SSDNow KC100 led the pack with a transfer speed of 500.78MB/s read and 462.13MB/s write with repeating data. This slowed to 491.49MB/s read and 296.34MB/s write with incompressible data.
With the bread and butter of SSDs being their 4K random I/O speed, we look at low-queue depth performance, as well as expanded performance to see how well performance scales under higher queue depths.
At a queue depth of 1, the KC100 measured 7,453 IOPS read and 23,808 IOPS write with repeating data and 6,983 IOPS read and 21,180 IOPS write with incompressible data. The strong low queue depth write performance was also shared by its consumer-oriented HyperX SSD variant.
The next set of tests looks at expanded performance, to measure burst 4K read and write speed, as well as measure the peak I/O levels.
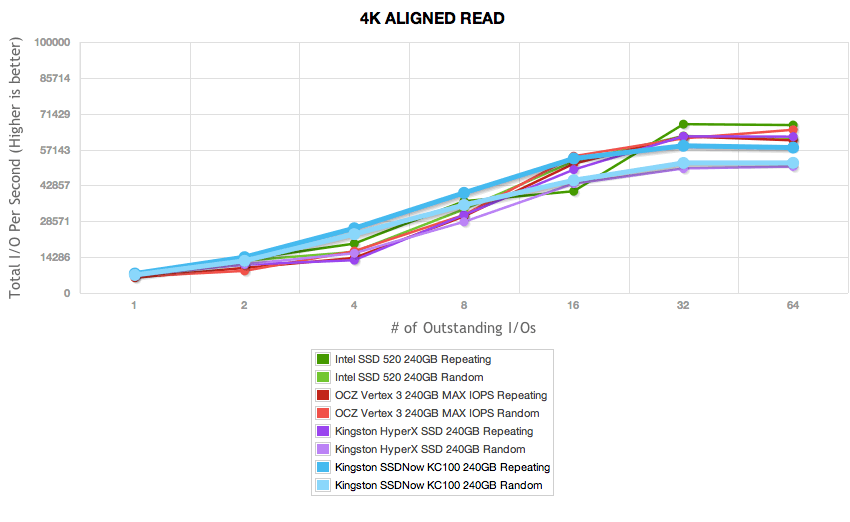
The Kingston SSDNow KC100 maintained a strong 4K random read speed through the higher queue depths, peaking with an I/O level of 58,663 IOPS at a queue depth of 32 with compressible data. With incompressible or randomized data the I/O speed topped at 51,867 IOPS at a queue depth of 64.
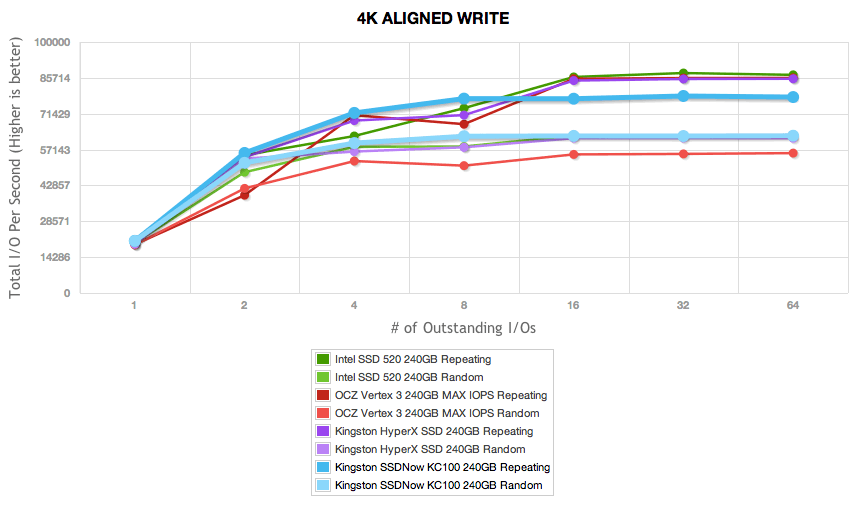
4K random write speeds from the KC100 peaked at 78,490 IOPS at a queue depth of 32 with repeating data or 62,661 IOPS with incompressible data at a queue depth of 64.
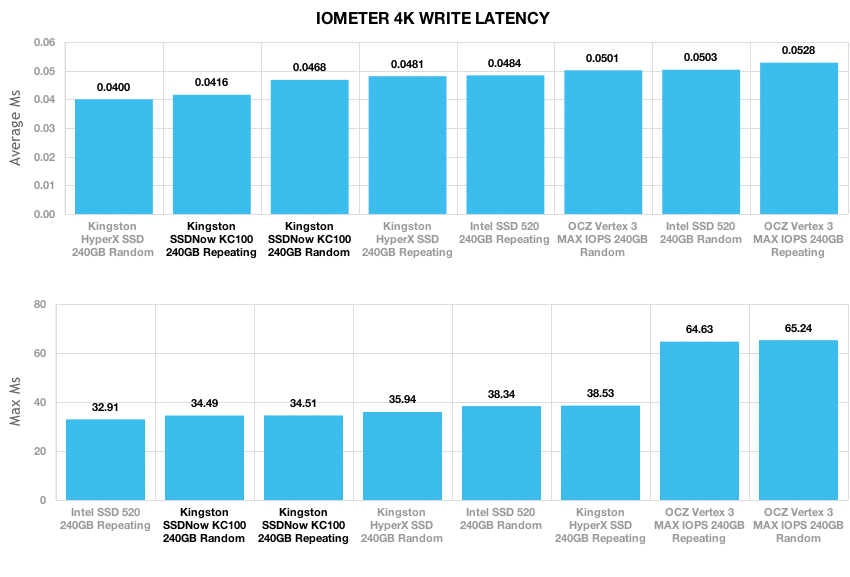
Expanding our low-queue depth 4K read and write test, we look at write latency of each SSD. Lower numbers are better, since it means less wait time for activity to process. Max latency is also important, although that number can change as the NAND wears over time. The Kingston SSDNow KC100 measured 0.0416ms with repeating data and 0.0468ms with incompressible data.
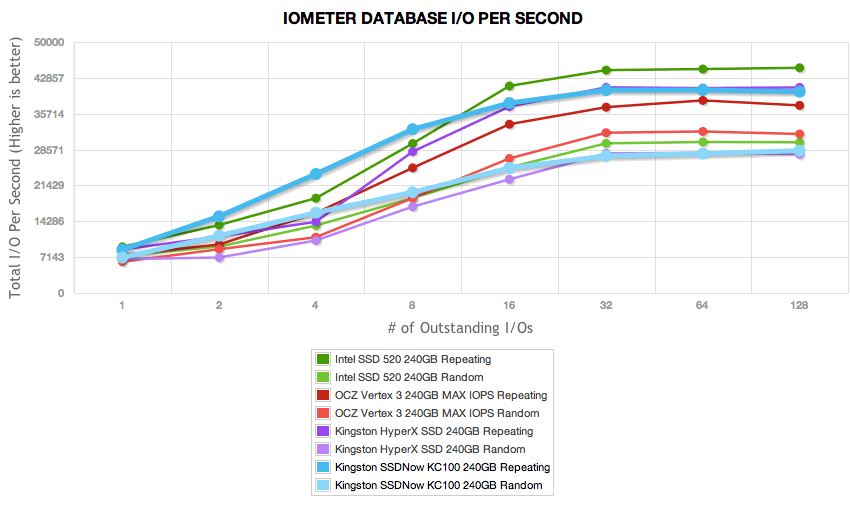
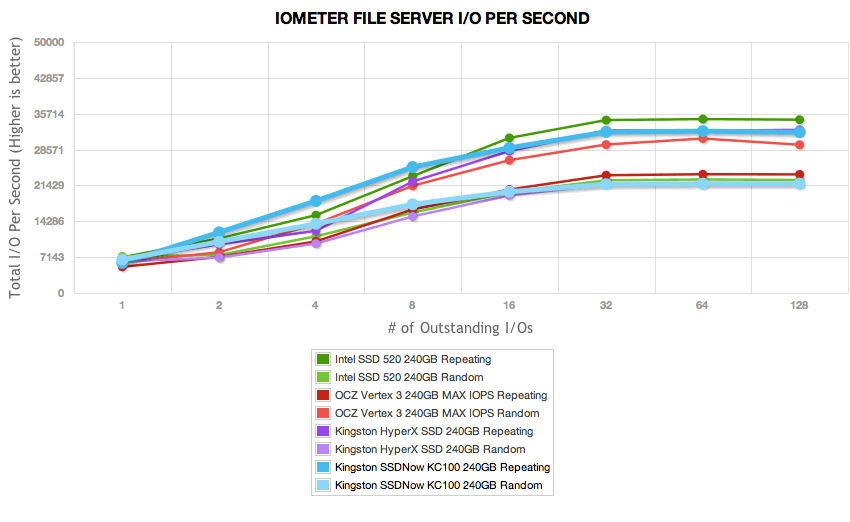
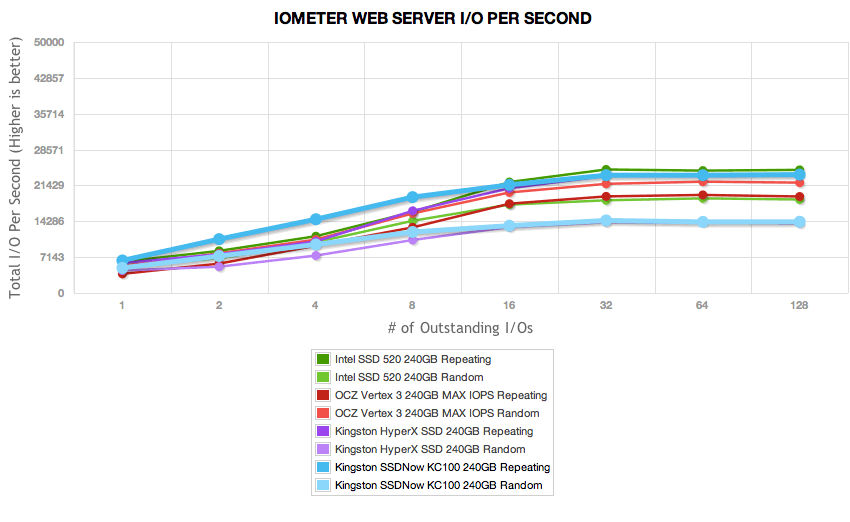
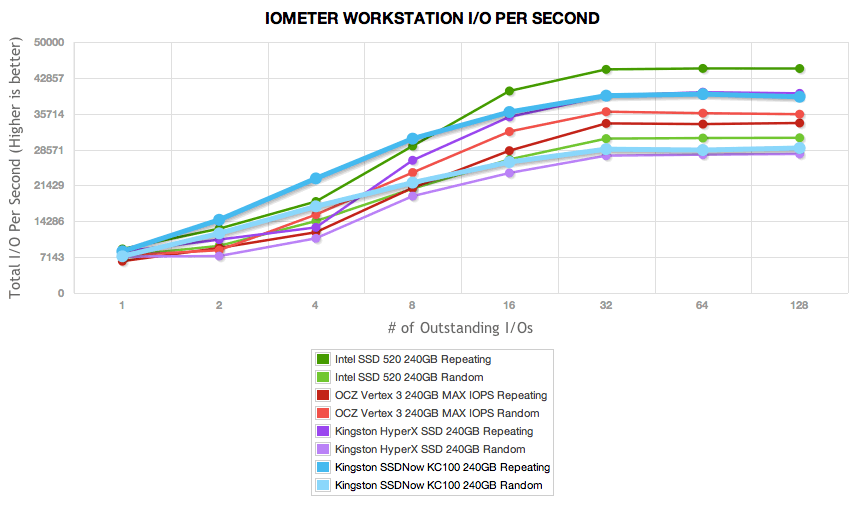
Our last group of consumer IOMeter synthetic benchmarks looks at mixed-load server profiles including Database, Workstation, File Server, and Webserver. The Kingston SSDNow KC100 performed well in our mixed workload tests, roughly matching the performance of the HyperX SSD in burst speeds, coming in below the Intel SSD 520.
Real-World Benchmarks
One thing we try to focus on with our reviews is how any given drive might perform under real-world conditions. For the average user, trying to translate random 4K write speeds into an everyday situation can be difficult. It helps when comparing drives in every setting possible, but it doesn’t exactly work out into faster everyday usage or better game loading times. For this reason we turned to our StorageMark 2010 traces, which include HTPC, Productivity, and Gaming traces to help readers find out how a drive might rank under their conditions.
The first real-life test is our HTPC scenario. In this test we include: playing one 720P HD movie in Media Player Classic, one 480P SD movie playing in VLC, three movies downloading simultaneously through iTunes, and one 1080i HDTV stream being recorded through Windows Media Center over a 15 minute period. Higher IOps and MB/s rates with lower latency times are preferred. In this trace we recorded 2,986MB being written to the drive and 1,924MB being read.
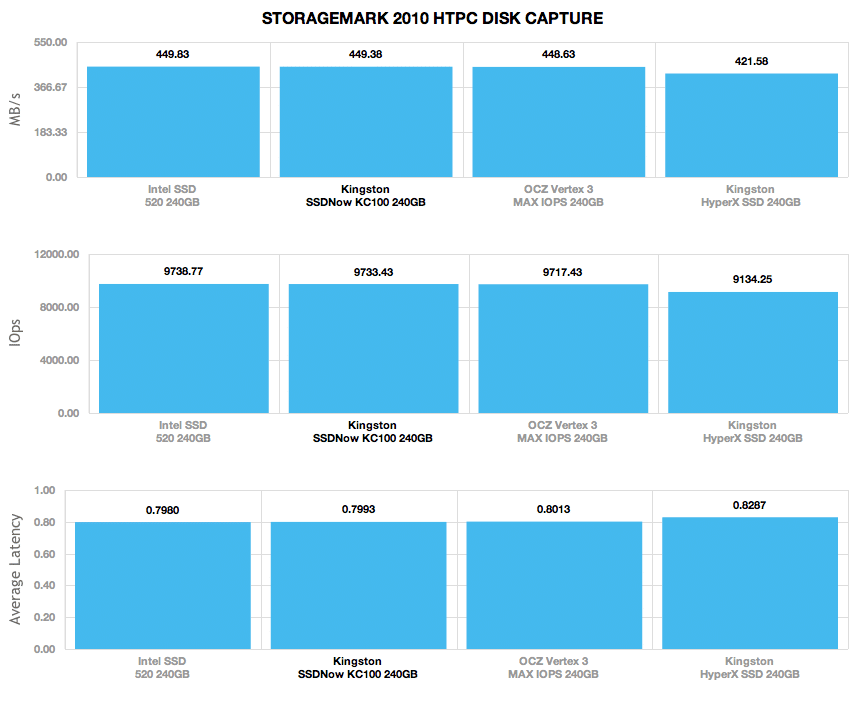
In a HTPC scenario the SSDNow KC100 averaged 9,733 I/O or 449MB/s over the duration of the test, picking up quite a bit of speed compared to the HyperX which only measured 412MB/s.
Our second real-life test covers disk activity in a productivity scenario. For all intents and purposes this test shows drive performance under normal daily activity for most users. This test includes: a three hour period operating in an office productivity environment with 32-bit Vista running Outlook 2007 connected to an Exchange server, web browsing using Chrome and IE8, editing files within Office 2007, viewing PDFs in Adobe Reader, and an hour of local music playback with two hours of additional online music via Pandora. In this trace we recorded 4,830MB being written to the drive and 2,758MB being read.
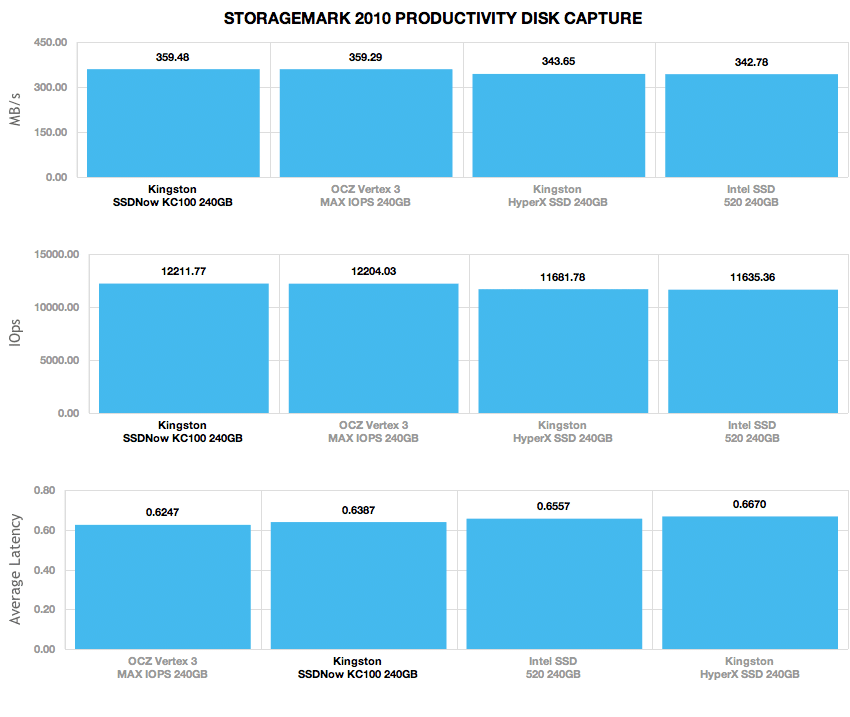
The SSDNow KC100 led the pack in our Productivity scenario, with an average speed of 12,211 I/O or 359MB/s, compared to 342MB/s from the HyperX.
Our third real-life test covers disk activity in a gaming environment. Unlike the HTPC or Productivity trace, this one relies heavily on the read performance of a drive. To give a simple breakdown of read/write percentages, the HTPC test is 64% write, 36% read, the Productivity test is 59% write and 41% read, while the gaming trace is 6% write and 94% read. The test consists of a Windows 7 Ultimate 64-bit system pre-configured with Steam, with Grand Theft Auto 4, Left 4 Dead 2, and Mass Effect 2 already downloaded and installed. The trace captures the heavy read activity of each game loading from the start, as well as textures as the game progresses. In this trace we recorded 426MB being written to the drive and 7,235MB being read.
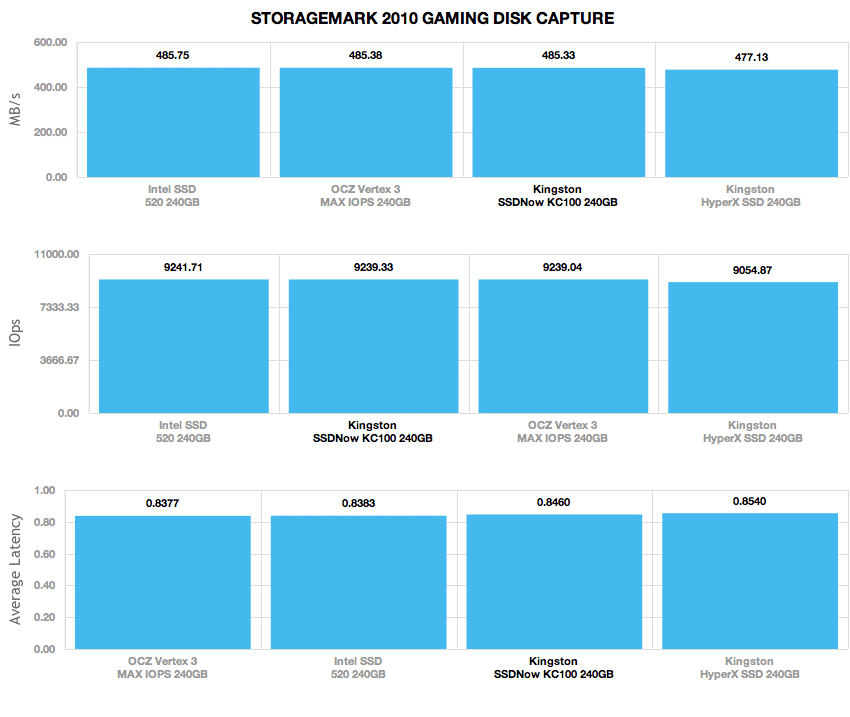
In our read-heavy Gaming trace, the KC100 measured 9,239 I/O or 485MB/s average.
Enterprise Synthetic Benchmarks
Flash media for the enterprise needs to be tested in a different manner than standard platter drives and even client-based SSDs. Flash performance changes the longer you write to a drive and speeds taper down until the drive hits its steady state speed. In an enterprise setting, initial burst is hardly relevant if after one hour of use the drive will never see that speed again. This is where steady state benchmarking comes in, showing how the drive performs when under a 24/7 load. For this reason, all of the following benchmarks were pre-conditioned and recorded in a steady-state mode.
We used our StorageReview Enterprise Testing Environment to benchmark the Kingston SSDNow KC100; accurately representing its capabilities in an enterprise environment. The enterprise testing platform is based around a Lenovo ThinkServer RD240, equipped with dual Intel Xeon X5650 processors, running Windows Server 2008 R2. For single-drive benchmarks we connect each SSD through an LSI SAS 9211-8i HBA to measure performance without any influence of caching. All IOMeter figures are represented as binary figures for MB/s speeds. All tests are performed in steady-state. Each of our server profile tests has a strong preference towards read activity, ranging from 67% read with our database profile to 100% read in our web server profile.
Going beyond just reporting Enterprise SMART conditions, the KC100 also performed better in our steady-state benchmarking compared to more consumer-oriented SSDs. This means it scored higher in write-intensive conditions.
The first is our database profile, with a 67% read and 33% write workload mix primarily centered on 8K transfer sizes.
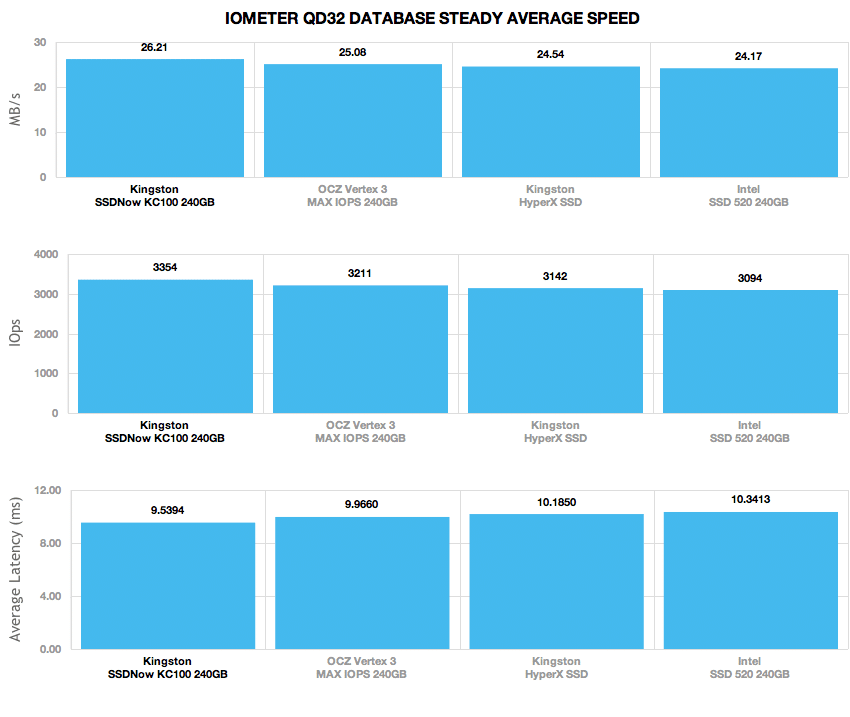
The SSDNow KC100 measured an average speed of 3,354 IOPS or 26.21 MB/s in our steady-state Database test, compared to 3,142 IOPS or 24.54MB/s from the HyperX.
The next profile looks at a file server, with 80% read and 20% write workload spread out over multiple transfer sizes ranging from 512-byte to 64KB.
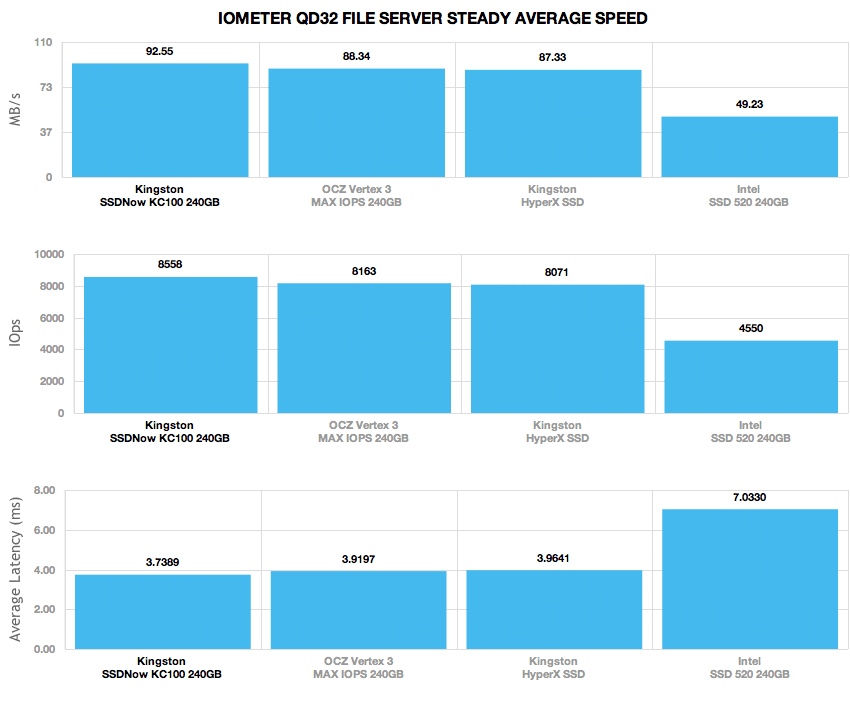
In a file server setting the KC100 measured an average speed of 8,558 IOPS in steady-state, or 92.55MB/s compared to 8,071 IOPS or 87.33MB/s from the HyperX SSD.
Our web server profile is read-only with a spread of transfer sizes from 512-byte to 512KB.
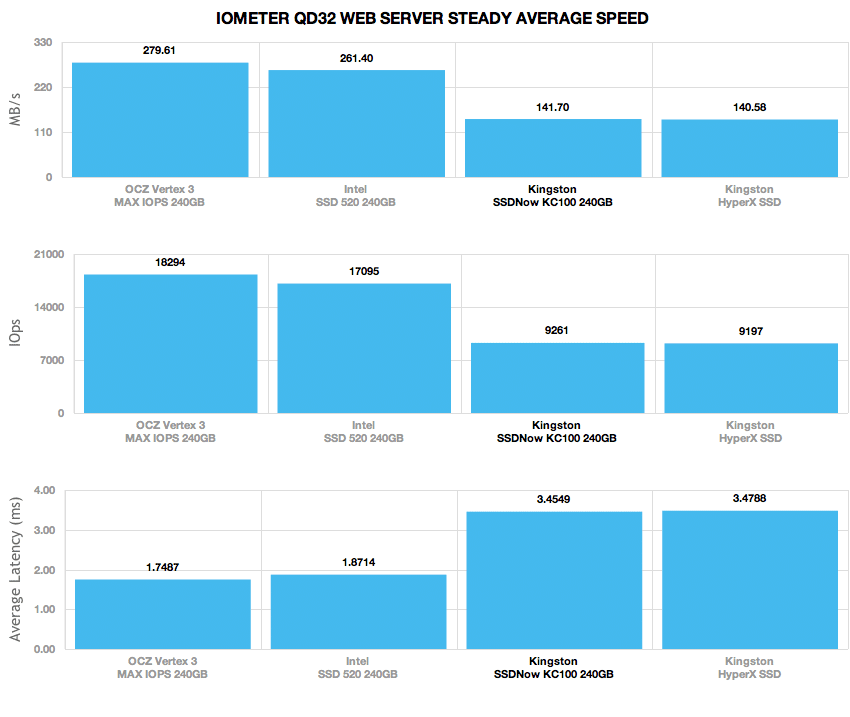
Being optimized for more write-heavy workloads instead of read-heavy, the performance of the KC100 dipped in our webserver profile. It measured 9,261 IOPS or 141.70MB/s, alongside the HyperX with similar results.
The last profile looks at a workstation, with a 20% write and 80% read mixture using 8K transfers.
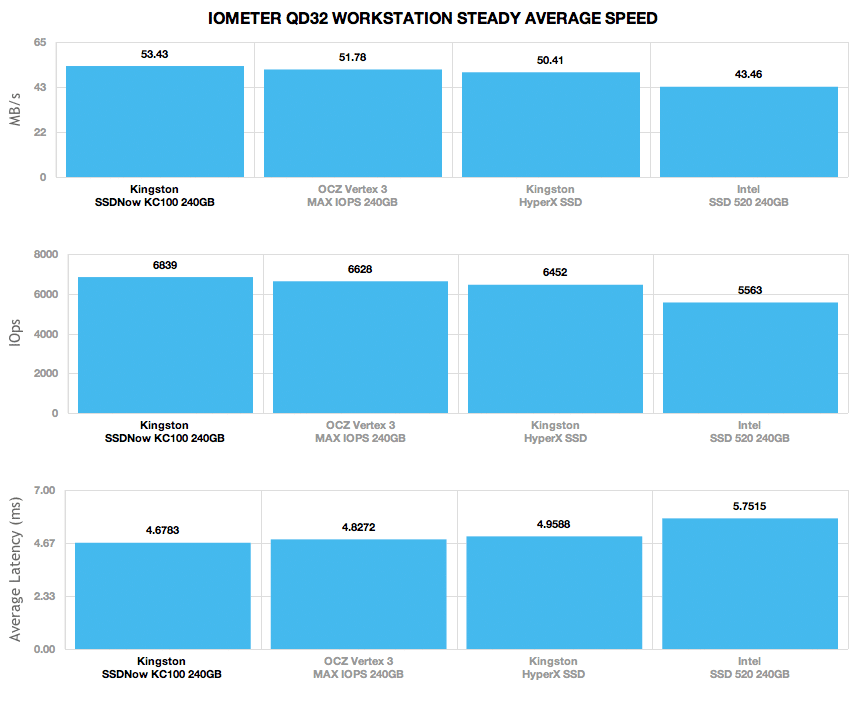
In a workstation setting, the KC100 led the pack once more, with an average speed in steady-state measuring 6,839 IOPS or 53.43MB/s compared to 6,452 IOPS or 50.41MB/s from the HyperX.
Power Consumption
Applying the same read and write profiles that we performed at the beginning of this review, we measure the power used by the SSD during these read or write profiles. SandForce SSDs heavily rely on compression for faster speeds and less write amplification, as a result we measure power with both compressible and incompressible data.
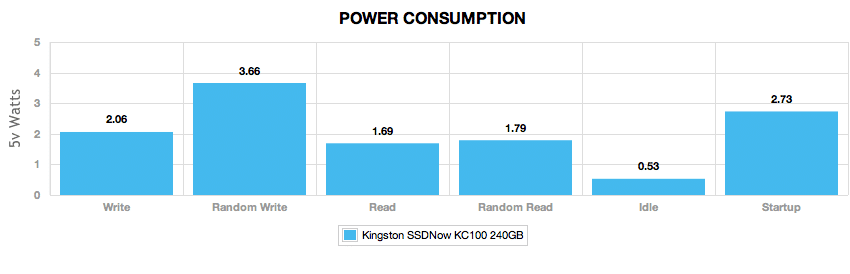
Kingston lists an average idle power usage of 0.46 watts, with activity varying from 1.6 watts with read I/O to 2.05 watts from write I/O. In our tests we measured an active power usage of 2.06 watts to 3.66 watts from write transfers, varying between compressible and incompressible workloads. Sequential read activity needed 1.69 watts, with random 4K read using slightly more with 1.79 watts. Idle power measured slightly above listed, using 0.53 watts in our lab.
Conclusion
The Kingston SSDNow KC100 may be dressed in a button down shirt, but underneath it’s even more edgy than its HyperX brother. The KC100 scored surprisingly well though most of our tests, highlighted by its strong steady-state performance in write-heavy workloads as well as great performance under bursty conditions. Kingston even includes heat shedding thermal pads, not something seen in many SATA client-purpose SSDs, and for the target audience they provide an enhanced array of SMART value reporting.
While nothing is holding back the buyer from doing a little custom over-provisioning to bring the KC100 more in line with other enterprise models for enhanced performance under write-heavy workloads, we were surprised this model shared the same capacity OP% as the HyperX. It still offered a small lead compared to the other consumer models we tested, but that difference would have been much greater with an enterprise-level 28% OP instead of the capacity-maximizing 12.5% seen on the KC100.
The KC100 slips a little when it comes to read-intensive workloads compared to the OCZ Vertex 3 MAX IOPS or Intel SSD 520, but overall, the good far outweighs these trouble spots. With the enhanced SMART reporting, added thermal protection for heavy workloads, and better performance in steady-state, it seems like a no brainer to buy the KC100 for business environments over the consumer HyperX. This is especially true as the prices are roughly identical, with the KC100 having a small edge on the HyperX SSD.
Pros
- Enhanced enterprise-level SMART reporting
- Good steady-state performance over consumer models
- Great thermal layout to cope with business workloads
Cons
- Slips in performance in our webserver profile with randomized data
Bottom Line
With excellent performance and nice bonuses like thermal pads for heat dissipation and additional SMART values that IT departments demand, the KC100 is an excellent choice for client users within the enterprise.
 Kingston KC100 at Amazon.com


 Amazon