

Memblaze offers a dizzying array of configurations for PBlaze3 across 38 different capacities as part Memblaze's Pianokey technology. In addition to the MLC-based drives evaluated for this review, both drives are also available in SLC editions. Pianokey and other core components of the PBlaze3 platform are built with Memblaze's own proprietary technologies which is one reason to keep an eye on their emerging new product lines. One of the advantages that Memblaze argues for its products over comparable drives is that the card provides most of the computational and DRAM requirements for its operation, reducing PBlaze3's operational overhead to the host system.
One way for a new technology venture to make itself known is by picking a fight with the established players in their market sector. That may be why Memblaze makes a point to argue that its PCIe flash products outperform Fusion-io whenever they have an opportunity. Memblaze provided us with evaluation units of its 2.4TB PBlaze3H MLC and 1.2TB PBlaze3L MLC to put through the paces against comparable drives from Fusion-io as well as other incumbents on the PCIe SSD market.
Memblaze PBlaze3 Specifications
- 1.2TB PBlaze3L MLC
- Available Capacities: 600GB – 1200GB
- Form Factor: Half-height, half-length
- Power Consumption: 10W – 25W
- Read Bandwidth (64KB): 2.4GB/s
- Write Bandwidth (64KB): 1.1GB/s
- Random Read (4KB) IOPS: 615,000
- Random Write (4KB) IOPS: 130,000
- Random Read &Write (4KB 75:25 R/W) IOPS: 500,000
- Typical R/W Access Latency (4KB): 80μs/14μs
- Lifetime Endurance: 8PB – 16PB
- Weight: 190g
- 2.4TB Pblaze3H MLC
- Available Capacities: 1200GB – 2400GB
- Form Factor: Full-height, half-length
- Power Consumption: 30W – 55W
- Read Bandwidth (64KB): 3.2GB/
- Write Bandwidth (64KB): 2.2GB/s
- Random Read (4KB) IOPS: 750,000
- Random Write (4KB) IOPS: 260,000
- Random Read &Write (4KB 75:25 R/W) IOPS: 600,000
- Typical R/W Access Latency (4KB): 80μs/14μs
- Bit Error Rate (BERM): Less than 10e-20
- Lifetime Endurance: 16PB – 33PB
- MTBF: 2,000,000 hours
- Weight: 350g
- Interface: PCI Express 2.1 x8
- Flash Type: NAND MLC (Multi Level Cell)
- Operating System Support: RHEL, SLES, CentOS, Windows, ESXi, KVM
- File System Support: NTFS, FAT, FAT32, EXT2, EXT3, EXT4, XFS, VMFS
- Management: CLI, GUI, Telnet, SSH
- Operational Temperature: 0ºC to 50ºC
- Non-operational Temperature: -40ºC – 70ºC
- Cooling Condition: >300LFM@25ºC
- Wear Leveling
- Latency Smooth
- Power Loss Protection: Polymer Capacitor, 18-20ms of Retention Time
- Software RAID Support: 0, 1, 5
- Data Protection: Supper Error Correction, RAIDCross NAND, Backup Die, Randomizer
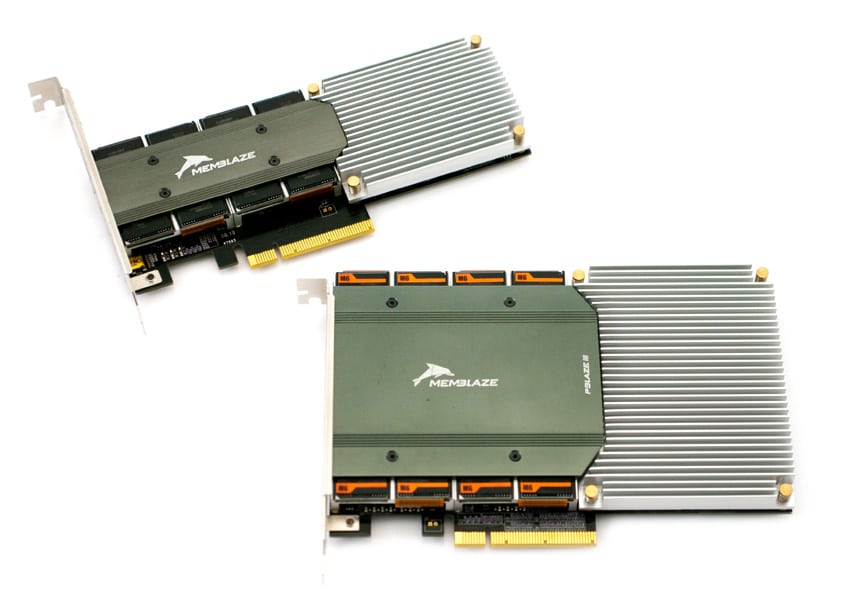
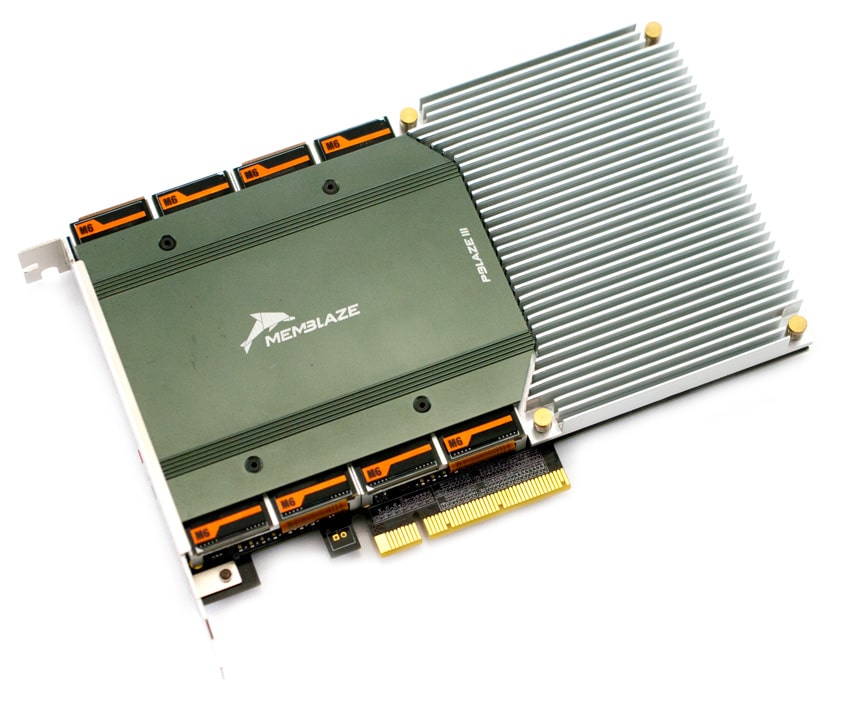
Design and Build
The PBlaze3 family utilizes Memblaze's proprietary Pianokey technology, which allows for a wide range of capacities and NAND types in increments of 50GB. This is dramatically different from existing designs on the market that may only have one or two different configurations available, while Memblaze is able to offer 38 different configurations. The PBlaze3 family is made up of two primary board designs; a full-height half-length dual controller model (Pblaze3H) and a half-height half-length single controller model (Pblaze3L).
The PBlaze3 uses a single controller and features on-card DRAM to reduce the overhead requirements for the host system. Similar to Fusion-io, Virident and Huawei, Memblaze leverages an FPGA design instead of an ASIC.
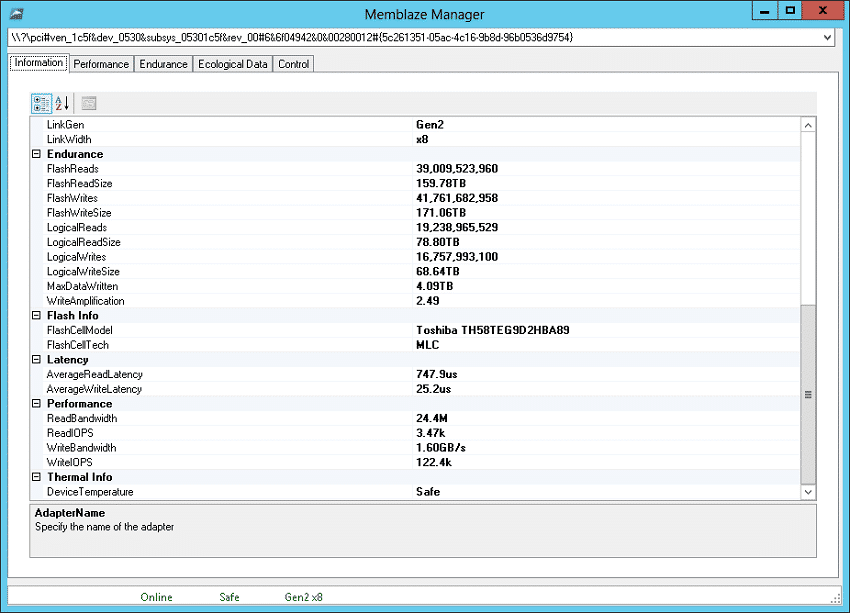
From a management perspective Memblaze offers utilities to monitor and manage the cards from both Windows and Linux. In Windows we interfaces with their GUI, which is a one stop shop for updating firmware, formatting the card, over-provisioning it as well as monitoring performance.
We used the CLI in Linux that offers much of the same functionality, but slightly less refined than others in the space. At the end of the day as long as the management interface works without too much hassle, it meets the expectations for most users.
Testing Background and Comparables
The StorageReview Enterprise Test Lab provides a flexible architecture for conducting benchmarks of enterprise storage devices in an environment comparable to what SAN administrators encounter in real deployments. The Enterprise Test Lab incorporates a variety of servers, networking, power conditioning, and other network infrastructure that allows our staff to establish real-world conditions to accurately gauge performance during our reviews.
We incorporate these details about the lab environment and protocols into reviews so that IT professionals and those responsible for storage acquisition can understand the conditions under which we have achieved the following results. None of our reviews are paid for or overseen by the manufacturer of equipment we are testing. Additional details about the StorageReview Enterprise Test Lab and an overview of its networking capabilities are available on those respective pages.
PCIe Application Accelerators are benchmarked on our second-generation enterprise testing platform based on a Lenovo ThinkServer RD630. For synthetic benchmarks, we utilize FIO version 2.0.10 for Linux and version 2.0.12.2 for Windows. In our synthetic testing environment, we use a mainstream server configuration with a clock speed of 2.0GHz, although server configurations with more powerful processors may yield greater performance.
- 2 x Intel Xeon E5-2620 (2.0GHz, 15MB Cache, 6-cores)
- Intel C602 Chipset
- Memory – 16GB (2 x 8GB) 1333Mhz DDR3 Registered RDIMMs
- Windows Server 2008 R2 SP1 64-bit, Windows Server 2012 Standard, CentOS 6.3 64-Bit
- 100GB Micron P400e Boot SSD
- LSI 9211-4i SAS/SATA 6.0Gb/s HBA (For boot SSDs)
- LSI 9207-8i SAS/SATA 6.0Gb/s HBA (For benchmarking SSDs or HDDs)
Comparables for this review:
- Fusion-io ioDrive2 Duo MLC (2.4TB, 2 x 40nm Xilinx Virtex-6 FPGA controllers, Intel MLC NAND, PCIe 2.0 x8)
- Fusion-io ioDrive2 (1.2TB, 1 x Xilinx Virtex-6 FPGA controllers, MLC NAND, PCIe 2.0 x4)
- Huawei Tecal ES3000 (2.4TB, 3 x Proprietary FPGA controllers, MLC NAND, PCIe 2.0 x8)
- Intel SSD 910 (800GB, 4 x Intel EW29AA31AA1, MLC NAND, PCIe 2.0 x8)
- LSI Nytro WarpDrive BLP4-400 (400GB, 4 x SandForce SF-2500 controller, Toshiba eMLC NAND, PCIe 2.0 x8)
- Micron P420m (1.6TB, IDT Controller, MLC NAND, PCIe 2.0 x8)
- Virident FlashMAX II (2.2TB, 2 x Proprietary FPGA controllers, eMLC NAND, PCIe 2.0 x8)
Application Workload Analysis
In order to understand the performance characteristics of enterprise storage devices, it is essential to model the infrastructure and the application workloads found in live production environments. Our first three benchmarks of the Memblaze PBlaze3H and PBlaze3L are therefore the MarkLogic NoSQL Database Storage Benchmark, MySQL OLTP performance via SysBench and Microsoft SQL Server OLTP performance with a simulated TCP-C workload.
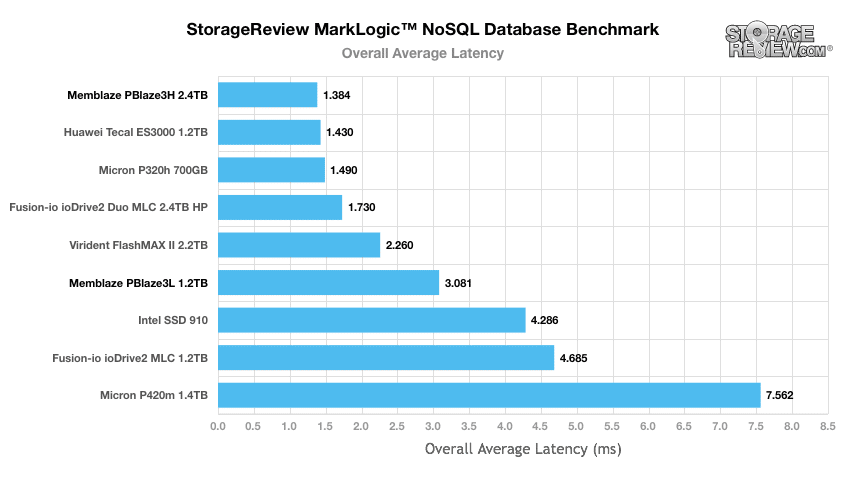
Our MarkLogic NoSQL Database environment requires groups of four SSDs with a usable capacity of at least 200GB, since the NoSQL database requires roughly 650GB of space for its four database nodes. Our protocol uses an SCST host and presents each SSD in JBOD, with one allocated per database node. The test repeats itself over 24 intervals, requiring between 30-36 hours total. MarkLogic records total average latency as well as interval latency for each SSD.
Both PBlaze3 drives performed well in the MarkLogic NoSQL benchmark, with the 2.4TB PBlaze3H scoring the lowest average latency among the comparables at 1.38ms. The 1.2TB PBlaze3L remained in the middle of the pack with 3.08ms average latency.
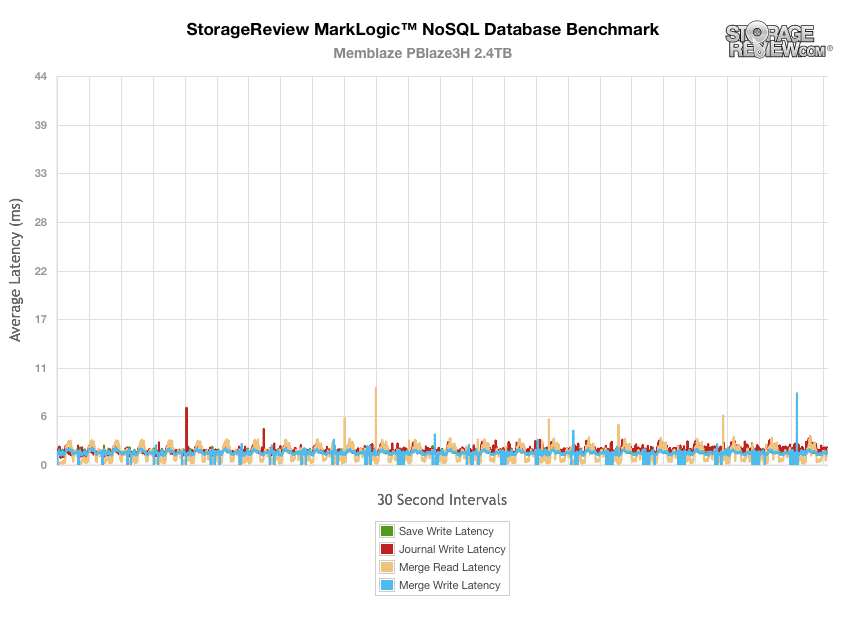
A closer examination of the PBlaze3H latency results during the NoSQL benchmark reveals a few minor spikes but no particularly notable trouble spots.
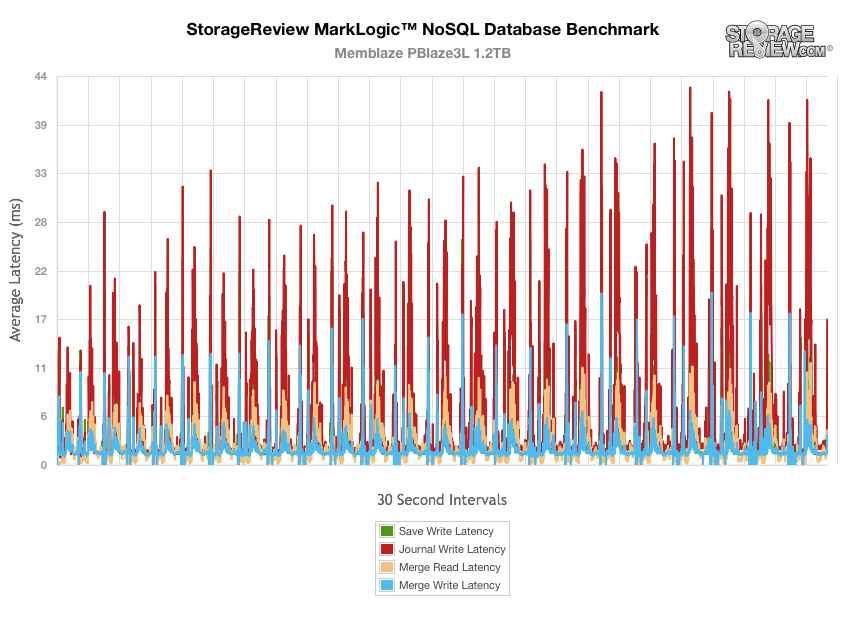
The Memblaze PBlaze3L has more trouble with journal write and merge write operations during the MarkLogic NoSQL benchmark.
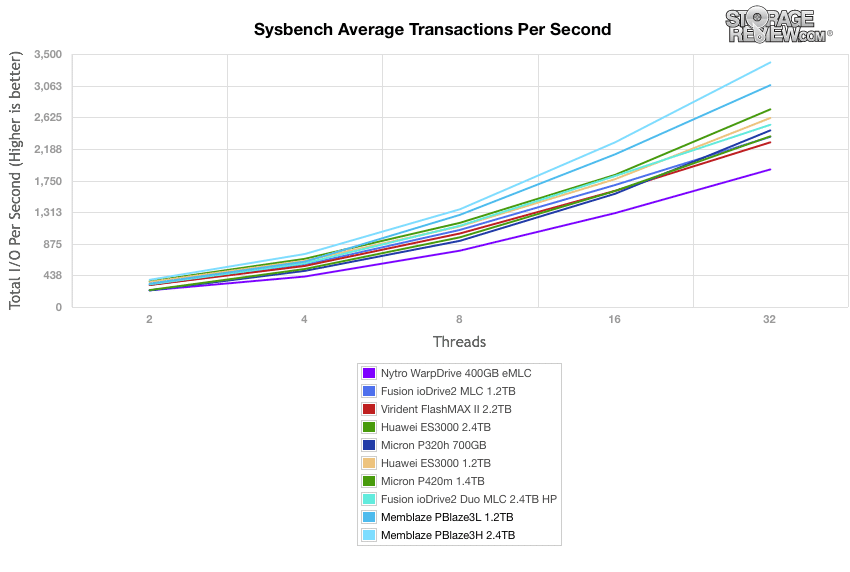
The next application benchmark consists of a Percona MySQL OLTP database measured via SysBench. In this configuration, we use a group of Lenovo ThinkServer RD630s as database clients and the database environment stored on a single drive. This test measures average TPS (Transactions Per Second), average latency, as well as average 99th percentile latency over a range of 2 to 32 threads. Percona and MariaDB are using the Fusion-io flash-aware application APIs in the most recent releases of their databases, although for the purposes of this comparison we test each device in their "legacy" block-storage modes.
As the thread count increases above four in the MySQL benchmark, both our PBlaze3 drives cruise into the top positions in terms of average transactions per second. The 1.2TB PBlaze3L tops out at 3,069TPS with 32 threads, while the 2.4TB PBlaze3H reaches 3,384TPS.
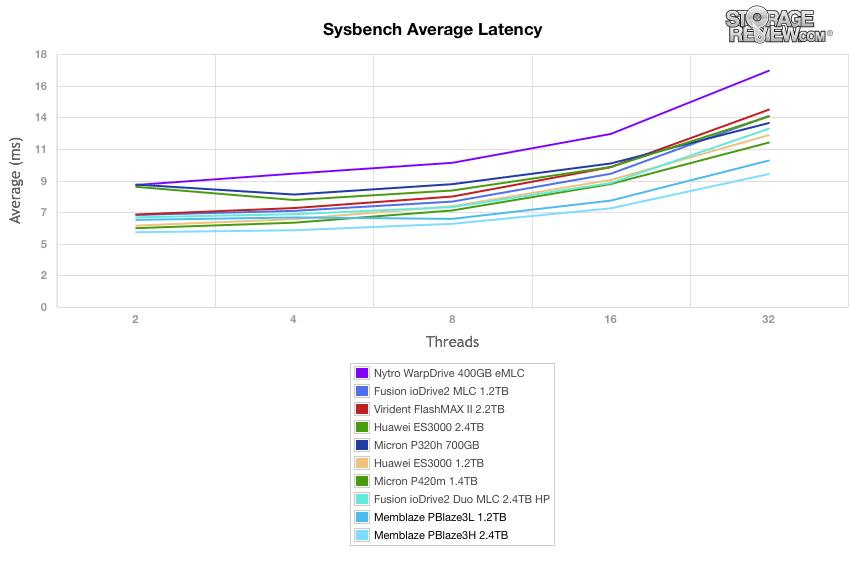
The PBlaze3 platform also outperforms its competition in terms of average latency at higher thread counts during the Sysbench MySQL benchmark.
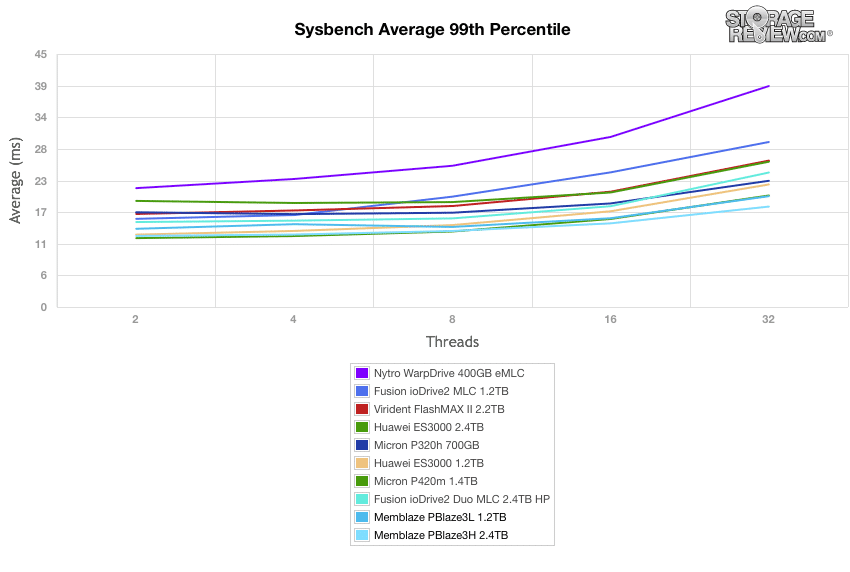
In our worst-case MySQL latency scenario, the two PBlaze3 drives exhibited no noteworthy spikes in latency. Both the PBlaze3L and the PBlaze3H remained among the best performers in terms of 99th percentile latency throughout the benchmark, with their best performance at greater workloads.
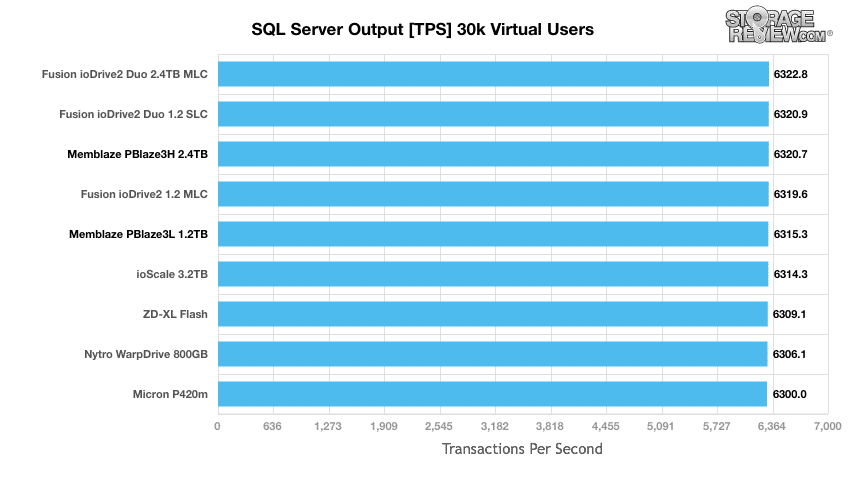
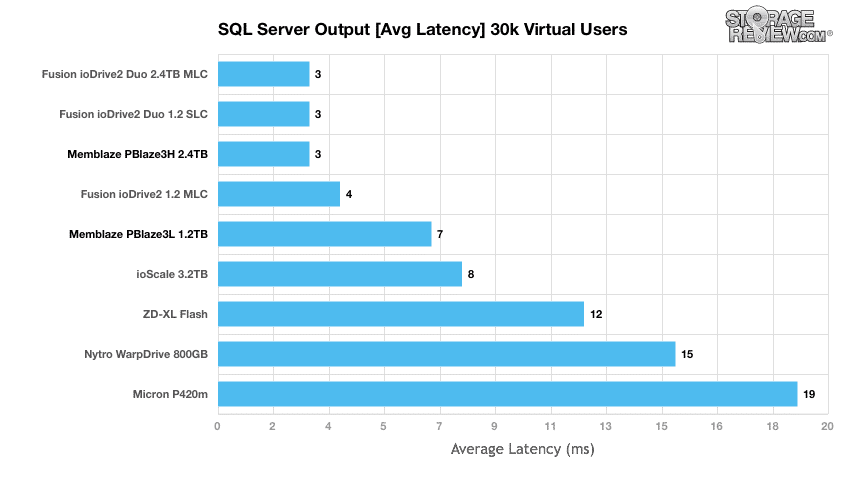
StorageReview’s Microsoft SQL Server OLTP testing protocol employs the current draft of the Transaction Processing Performance Council’s Benchmark C (TPC-C), an online transaction processing benchmark that simulates the activities found in complex application environments. The TPC-C benchmark comes closer than synthetic performance benchmarks to gauging the performance strengths and bottlenecks of storage infrastructure in database environments. Our SQL Server protocol uses a 685GB (3,000 scale) SQL Server database and measures the transactional performance and latency under a load of 30,000 virtual users.
In terms of transactions per second, both of the PBlaze3 drives were able to keep pace with the comparable drives in our Microsoft SQL benchmark. The 1.2TB PBlaze3L delivered 6,315TPS, while the 2.4TB PBlaze3H reached 6,321TPS.
The more important metric for evaluating performance in the Microsoft SQL benchmark is average latency. With a workload of 30,000 virtual users, both Memblaze drives performed well. The PBlaze3H kept its latency to 3ms, while the PBlaze3L averaged 7ms.
Synthetic Workload Analysis
Our synthetic benchmark protocols each begin by preconditioning the target storage into steady-state with the same workload that will be used to test the device. The preconditioning process uses a heavy load of 16 threads with an outstanding queue of 16 per thread.
Preconditioning and Primary Steady-State Tests:
- Throughput (Read+Write IOPS Aggregate)
- Average Latency (Read+Write Latency Averaged Together)
- Max Latency (Peak Read or Write Latency)
- Latency Standard Deviation (Read+Write Standard Deviation Averaged Together)
Once preconditioning is complete, each device being compared is then tested across multiple thread/queue depth profiles to show performance under light and heavy usage. Our synthetic workload analysis for this review will use two profiles which are widely referenced among manufacturer specifications and benchmarks.
- 4k Profile
- 100% Read and 100% Write
- 8K Profile
- 70% Read, 30% Write
Whereas the application performance benchmarks for the two PBlaze3 SSDs used consolidated charts and results, our synthetic benchmarks will present the two cards independently. In order to provide the most useful analysis, we conducted these benchmarks with both a Linux and Windows host system as well as configuring the PBlaze3 drives in both a standard mode and high performance (HP) profile which uses increased overprovisioning.
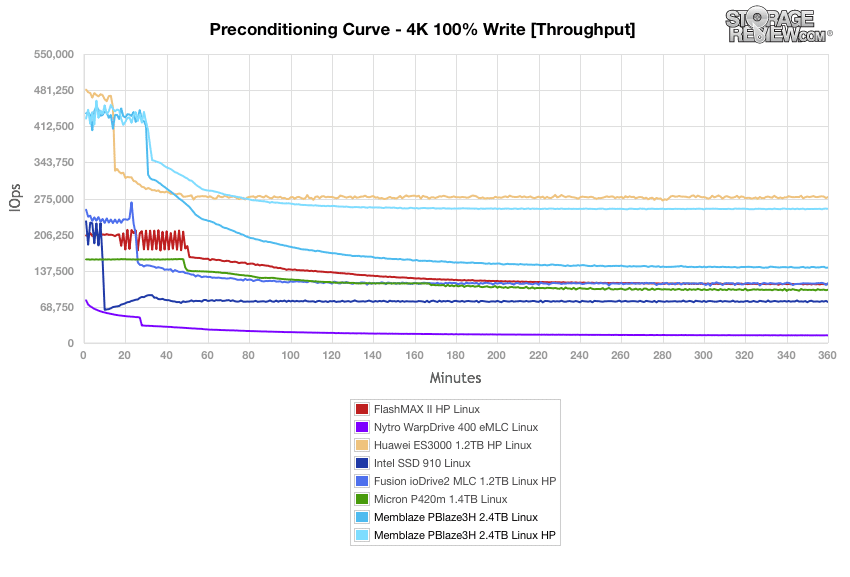
Used with a Linux host system, the 2.4TB PBlaze3H maintains strong results throughout preconditioning process for the FIO 4k benchmark. Both the standard and high performance overprovisioning profiles maintain a strong second place to the Huawei ES3000, even surpassing the ES3000 during a portion of the initial burst period.
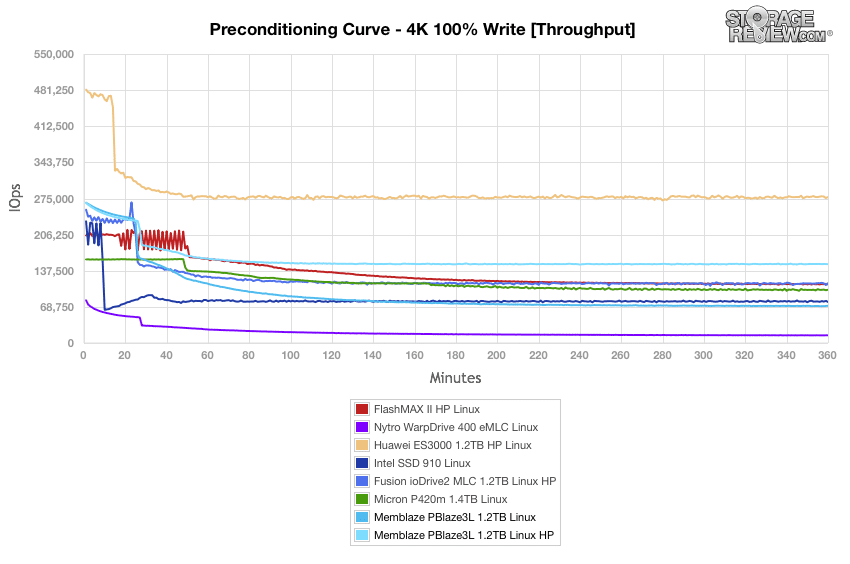
The 1.2TB PBlaze3L settles into a clear second-place result as the drive reaches steady state when configured with the high performance profile during 4k preconditioning in Linux.
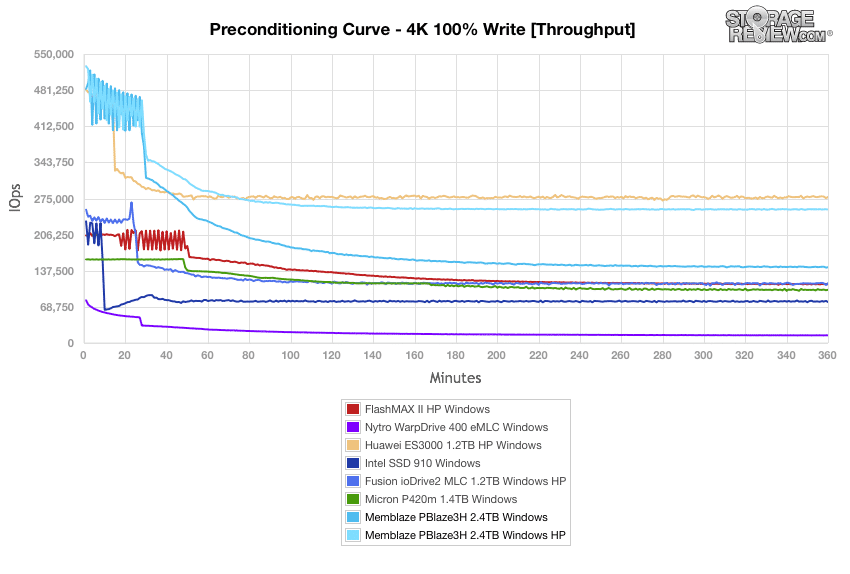
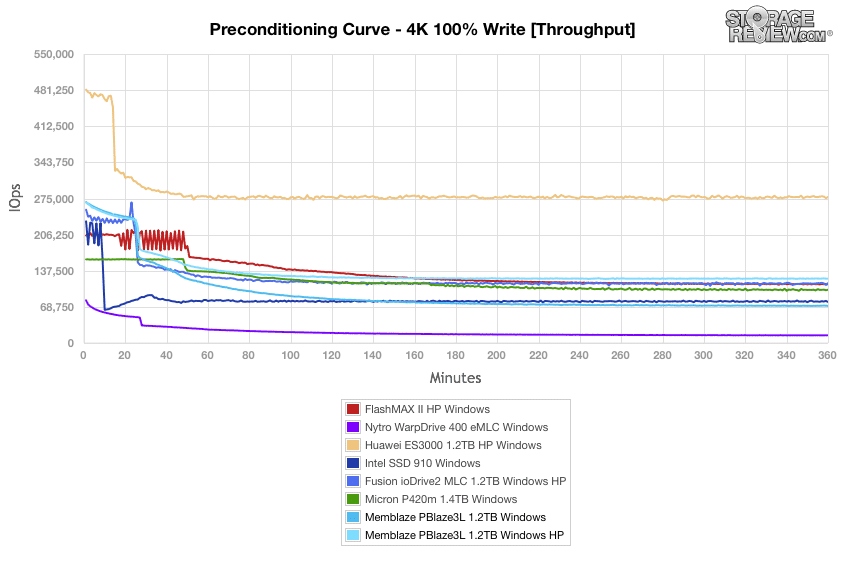
The overall arc of PBlaze3H 4k write performance is the same for the StorageReview Windows testbed as during our Linux benchmark, although the PBlaze3H does experience a greater range of performance values during the burst period with a Windows host than during Linux preconditioning.
The 1.2TB PBlazeL does not perform as well in Windows as it did with Linux, but the PBlaze3L does eventually edge out the FlashMAX II for a second place finish among the comparables as the drive approaches steady state when overprovisioned for high performance.
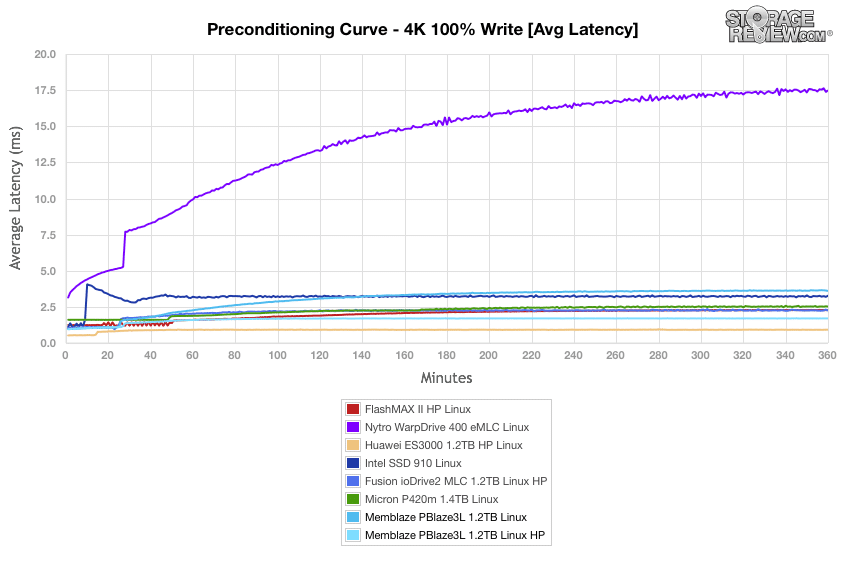
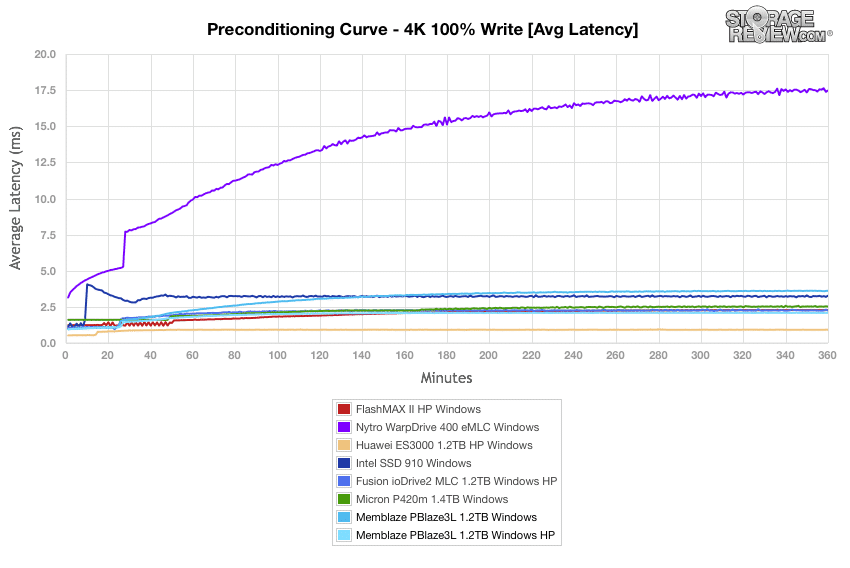
During preconditioning for the 4k Linux benchmark, the 2.4TB PBlaze3H clocks strong average latency results in both the standard and high performance profiles. The PBlaze3H winds up in a dead heat with the Huawei ES3000 near 1ms at steady state when the PBlaze3H is configured for high performance.
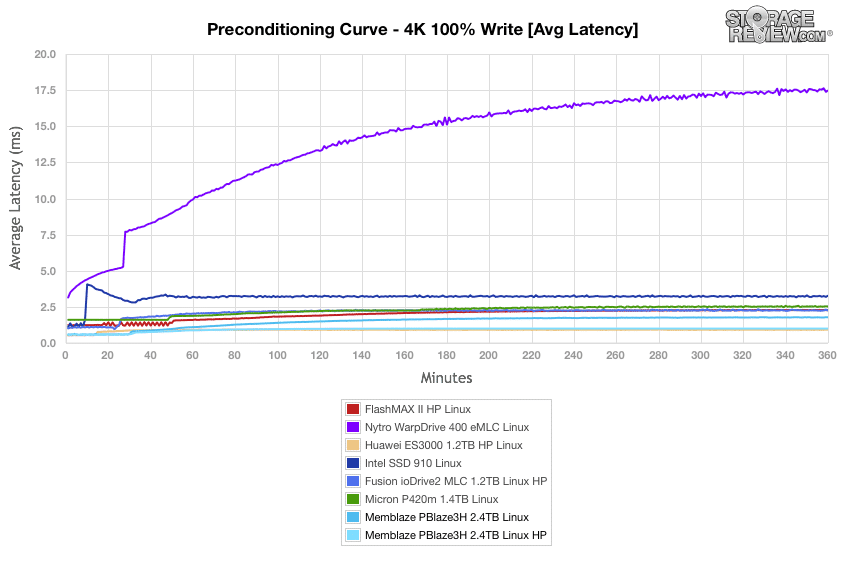
Average latency results were also strong while preconditioning the 1.2TB Memblaze PBlaze3L for the 4k benchmark in Linux. The standard PBlaze3L profile wound up with average latency results near 3.65ms during preconditioning, while its high performance profile claimed second place at approximately 1.7ms near steady state.
During 4k preconditioning with the Windows testbed, the2.4TB PBlaze3H has similar average latency performance results to the PBlaze3H with a Linux host.
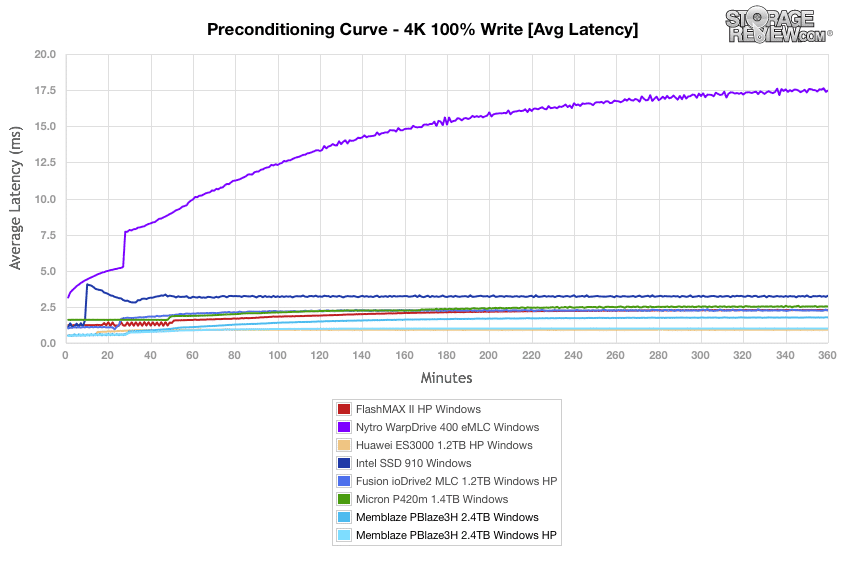
The 1.2TB PBlaze3L has a harder time maintaining its strong performance in average latency results during preconditioning with a Windows host. The high performance PBlaze3L profile does still edge out the Micron P420m and Fusion ioDrive2 as preconditioning approaches steady state.
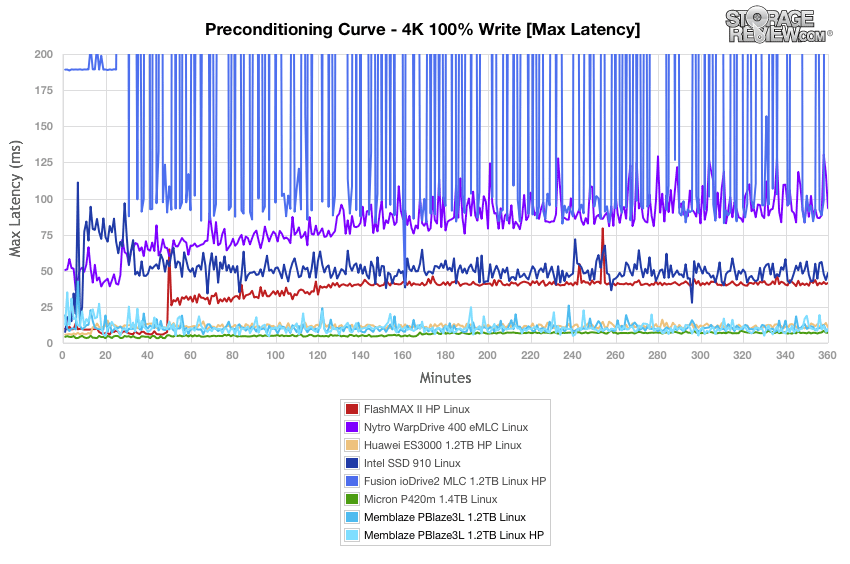
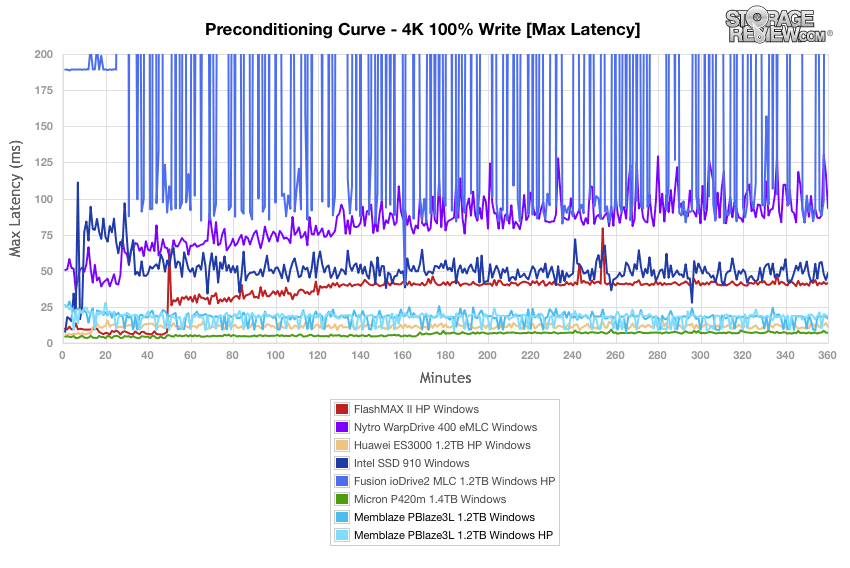
After the burst period when maximum latency results had more variation, the 2.4TB PBlaze3H maintained maximum latencies during 4k preconditioning in Linux that were almost entirely less than 50ms in both standard and high performance profiles. This placed the PBlaze3H behind the Huawei ES3000 and the Micron P420m as the benchmark approached steady state.
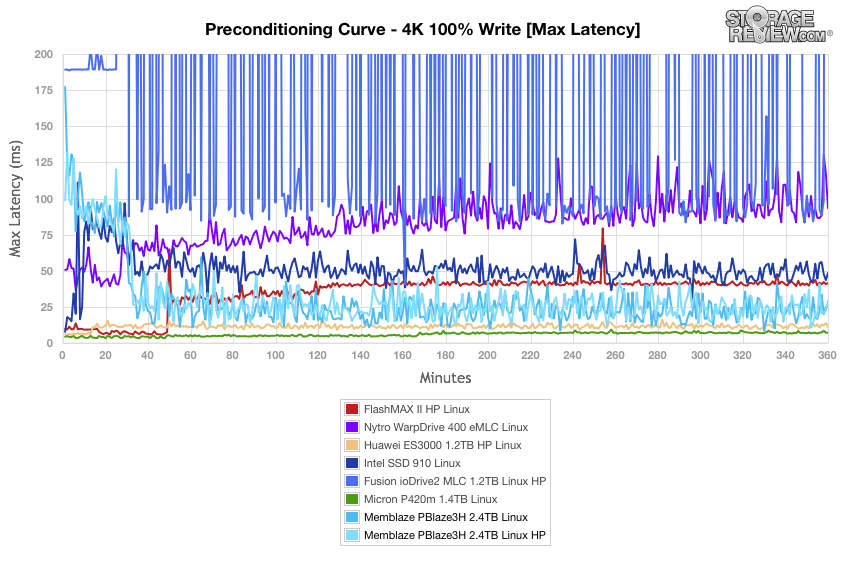
The 1.2TB PBlaze3L was even more competitive in terms of maximum latency during 4k preconditioning in Linux in both profiles. Beginning at approximately 30 minutes into preconditioning, both PBlaze3L configurations generally edged below the Huawei ES3000 to maintain second-place to the Micron P420m.
The 2.4TB PBlaze3H experienced more variations in maximum latency during 4k preconditioning on our Windows testbed, but the overall result is the same as we measured in Linux. Both PBlaze3H overprovisioning schemes clock maximum latencies just higher than the Huawei ES3000 and the MicronP420m.
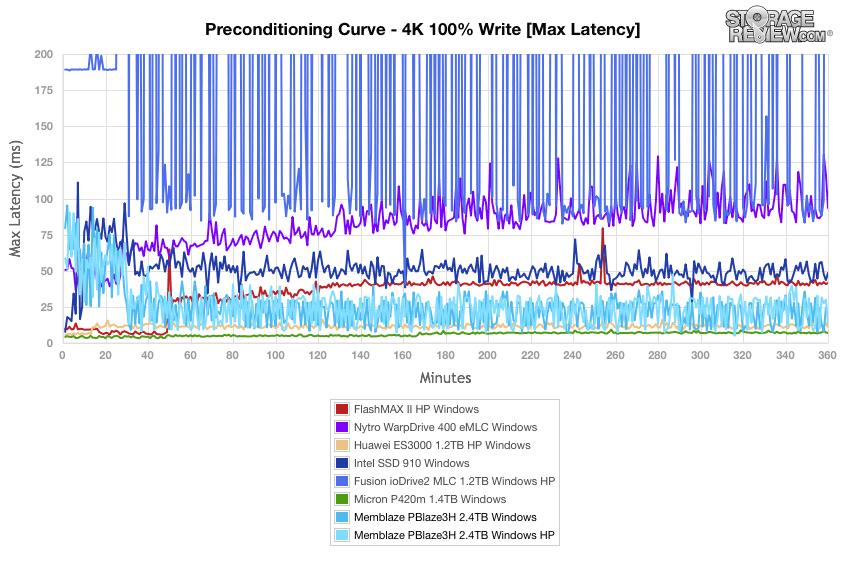
The PBlaze3L is not able to keep its maximum latencies quite as low during 4k preconditioning in Windows as with Linux, but is still able to outperform all comparables except those from Huawei and Micron.
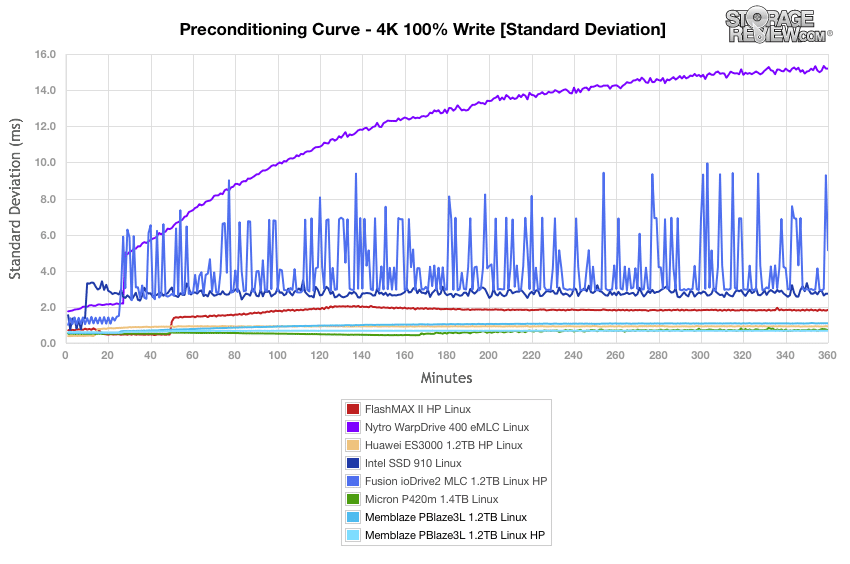
Plotting standard deviation calculations provides a clearer way to compare the amount of variation between individual latency datapoints collected during a benchmark. The 2.4TB Memblaze PBlaze3H experienced consistent latencies during 4k preconditioning in Linux with its standard deviation settling near 2ms for the standard configuration and 1.1ms with overprovisioned with a high performance profile.
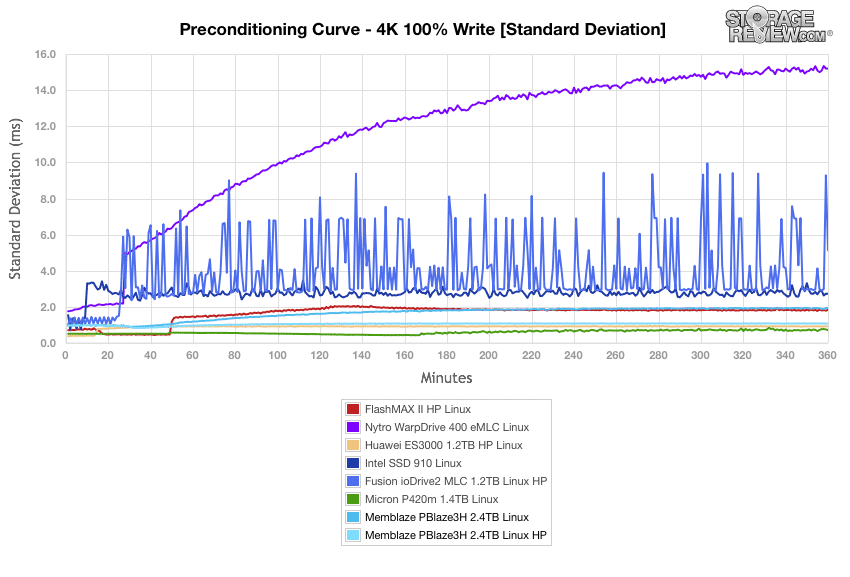
The 1.2TB PBlaze3L begins to edge out the Micron P420m in terms of latency standard deviation by the midway point of its 4k preconditioning in Linux when overprovisioned for high performance. With a standard configuration the PBlaze3L was able to keep just behind the Huawei ES3000 at approximately 1.1ms.
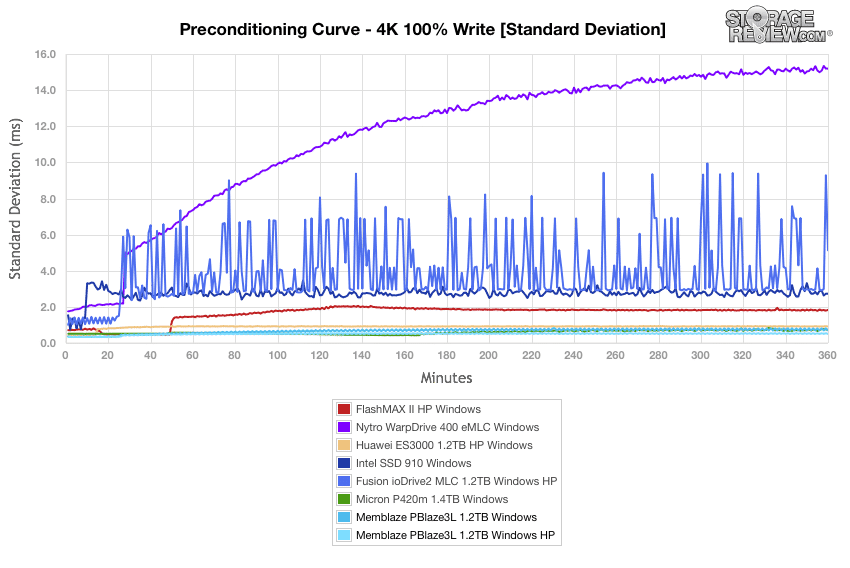
Overprovisioned for high performance, the 2.4TB PBlaze3H was able to nearly match the standard deviation results of the Huawei ES3000 in during Windows 4k preconditioning, placing both the PBlaze3H and the Huawei ES3000 behind only the MicronP420m. With standard overprovisioning, the PBlaze3H experienced standard deviation results much more close to the FlashMAX II by the midway point of 4k preconditioning.

The 1.2TB PBlaze3L is able to achieve the most consistent latency results among our comparables in 4k Windows preconditioning when overprovisioned for high performance, although the three top performers are all clustered in a tight pack at the bottom of this chart.
With Linux preconditioning completed for the 4k benchmark, the 2.4TB PBlaze3H scores 474,839IOPS on read operations in a standard configuration and adds approximately 3,000IOPS with high performance overprovisioning. Its 142,844IOPS for write operations jumps from second-highest among comparables to the highest position with the high performance configuration, at 254,931IOPS.
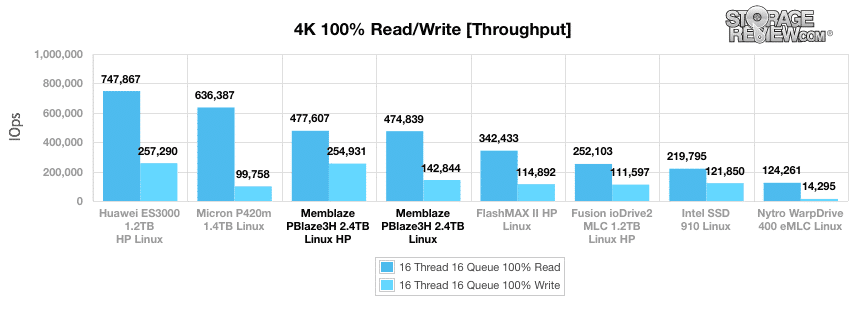
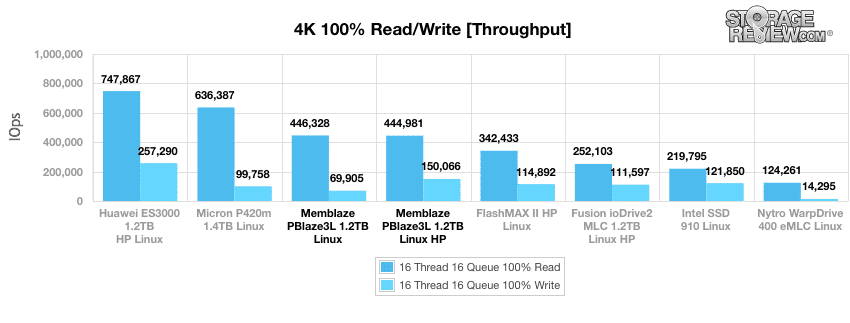
The 1.2TB PBlaze3L achieves comparable read performance to its PBlaze3H sibling in Linux during our 4k synthetic benchmark across the standard and high performance configurations. Switching from the standard configuration to high performance overprovisioning makes a notable difference in write performance, moving the PBlaze3L from second-to-last in write performance up to second-highest at 150,066IOPS.
The 2.4TB PBlaze3H is able to sustain 4k higher read throughput in Windows than with the Linux testbed, at 588,421IOPS with high performance overprovisioning. For both overprovisioning profiles the PBlaze3H is second only to the Huawei ES3000 in write throughput, although the high performance profile puts the PBlaze3H within close reach of the Huawei comparable at 254,100IOPS.
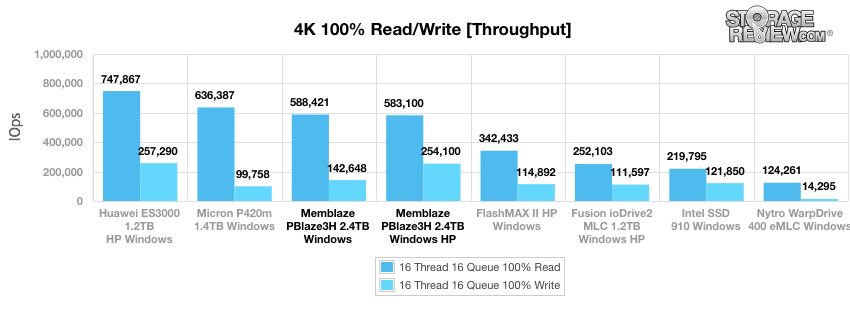
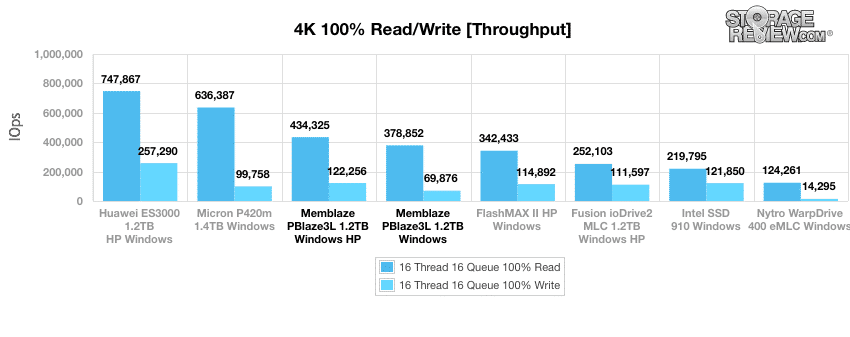
The 1.2TB PBlaze3L earns a solid third place for 4k read throughput in Windows, and as with its performance moves from second-to-last in write throughput to second-best when overprovisioning is reconfigured to improve performance.
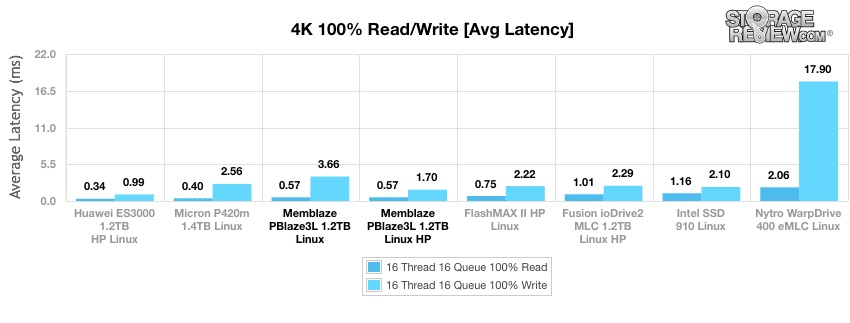
The 2.4TB PBlaze3H clocked strong average latency results during our 4k Linux benchmark, particularly for write operations.
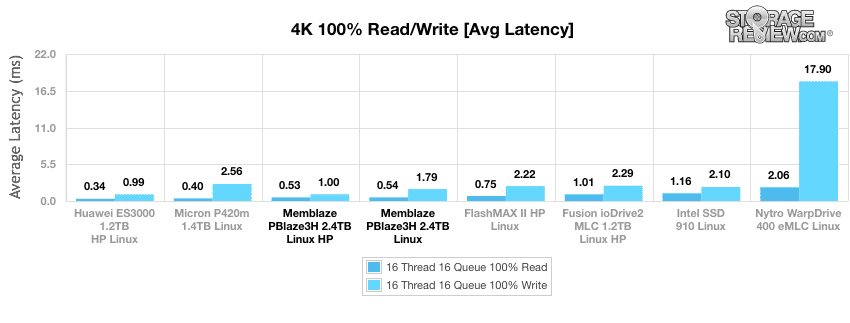
The 1.2TB PBlaze3L manages a respectable average latency in Linux when configured with standard overprovisioning, but is also able to reach second-best average write latencies with 4k operations in Linux when overprovisioned for high performance.
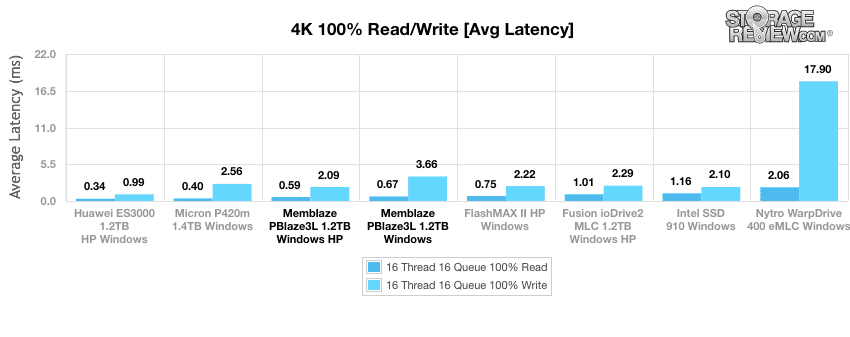
In Windows, the 2.4TB PBlaze3H is competitive with the highest-performing comparables in our 4k benchmark in terms of average latency. Overprovisioned for higher performance, the PBlaze3H keeps its average latencies to 0.44ms on read operations and 1ms on write operations.
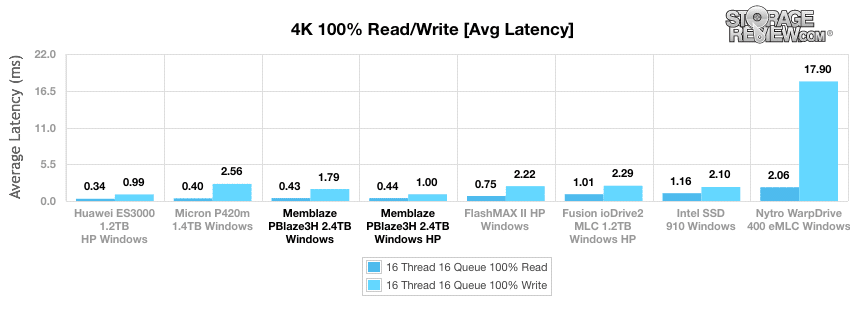
The 1.2TB PBlaze3L is also competitive at the top of the pack when overprovisioned for performance in a Windows environment. We were able to keep average latencies for 4k write transfers to 2.09ms for that configuration.
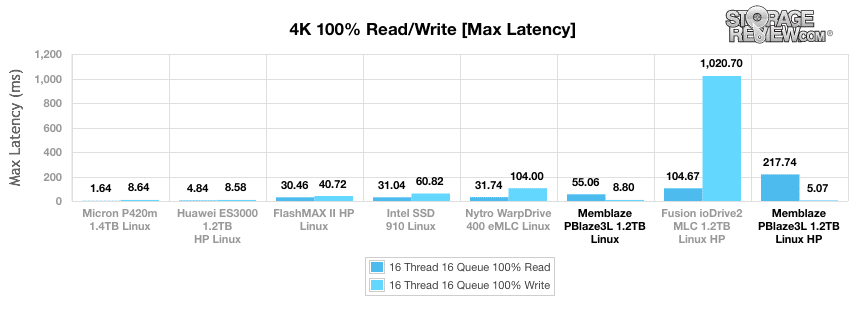
Maximum latency results reveal the worst-case scenario for latency performance during the 4k benchmark. The 2.4TB PBlaze3H experienced maximum latencies for read operations that were highest among our comparables with the Linux testbed, but the PBlaze3H did notably better in terms of write latency with a third-best 9.37ms maximum latency for write operations in a standard configuration. Overprovisioning for higher performance did not improve maximum latency scores for the PBlaze3H with 4k write transfers.
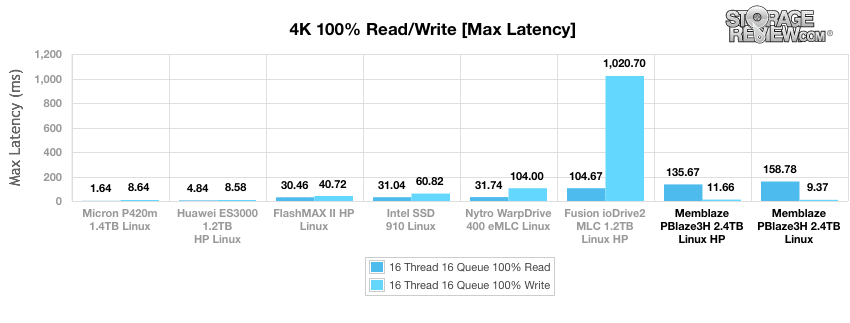
The 1.2TB PBlaze3H experiences better maximum read latencies than its PBlaze3L sibling during the 4k benchmark with our Linux testbed. Overprovisioning the PBlaze3H does decrease its maximum write latency from 8.8ms to 5.07ms, albeit at the cost of increased 4k read latencies.
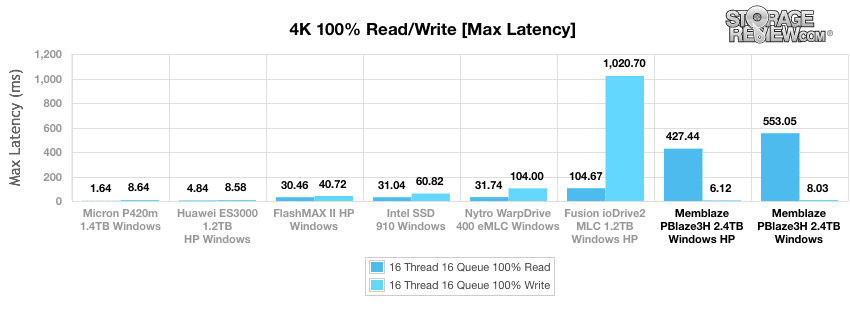
The 2.4TB PBlaze3H was also the poorest performer in terms of maximum read latency for 4k operations in Windows but achieved in best-in-class maximum latency results for write operations. Its best write latency performance came when overprovisioned for high performance, at 6.12ms.
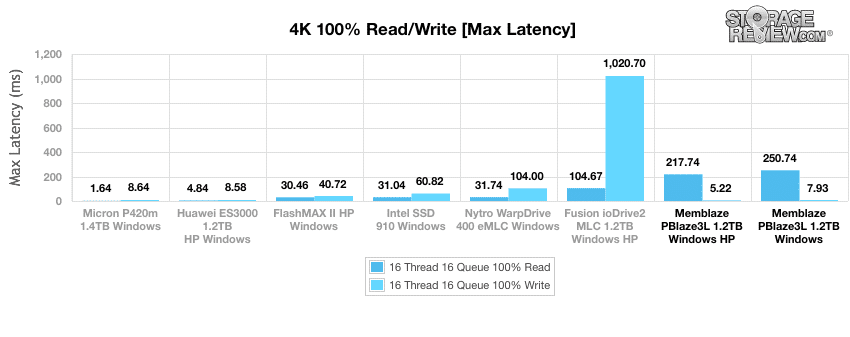
The 1.2TB PBlaze3L also struggles to keep up with the maximum latency scores of the comparable drives during our 4k Windows benchmark, but is able to keep maximum latencies to a best in class 5.22ms when overprovisioned for high performance.
Plotting the results of a standard deviation calculation provides insight into how consistent the latency results are during the 4k benchmark protocol. By this measure, the 2.4TB PBlaze3H is not a leader in terms of read operations with our Linux testbed, but it does glide into third place for write operations both with standard overprovisioning and overprovisioned for higher performance.
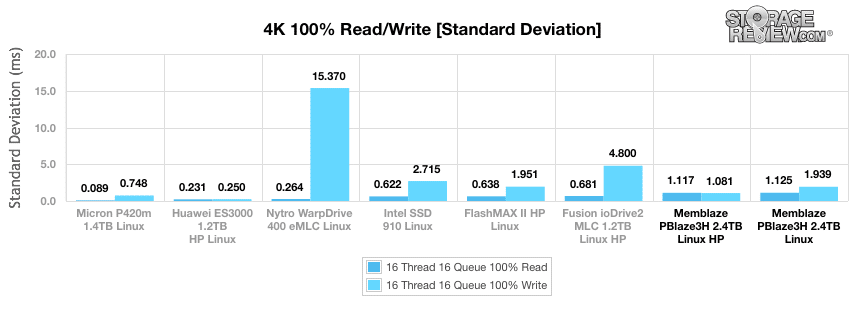
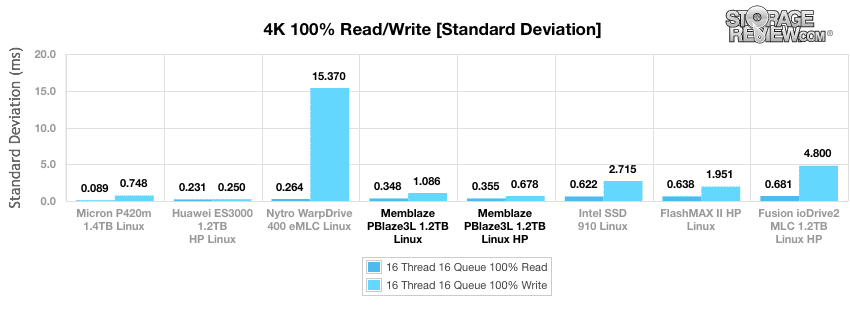
The 1.2TB PBlaze3L keeps its 4k latency standard deviation in the middle of the pack with the Linux testbed in both the standard and high performance configurations. With write operations, the PBlaze3L is able to keep the standard deviation to 0.678ms in our high performance configuration, second-best among the comparables.
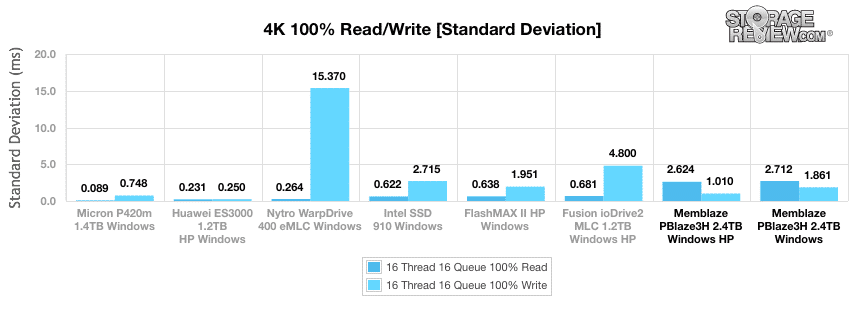
The 2.4TB PBlaze3H takes the third place position for Windows 4k operations with both standard overprovisioning and when configured for high performance. The high performance profile drops standard deviation for 4k write operations to 1.01ms.
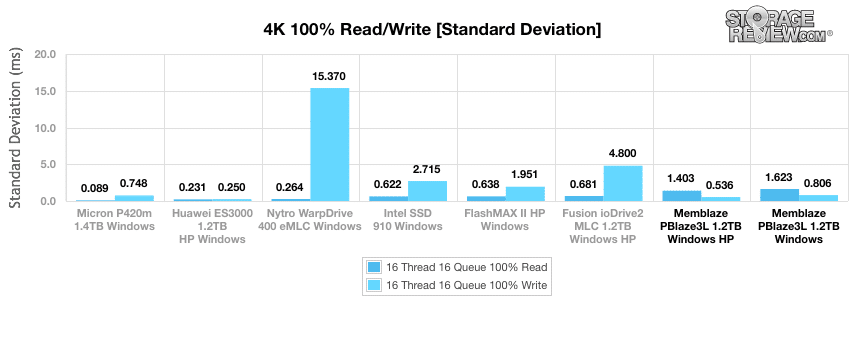
The plot of latency standard deviation for 4k transfers in Windows with the 1.2TB PBlaze3L does not reveal any surprises. The PBlaze3L clocks in the highest standard deviations for read operations and a second-best 0.635ms for write operations when overprovisioned for high performance.
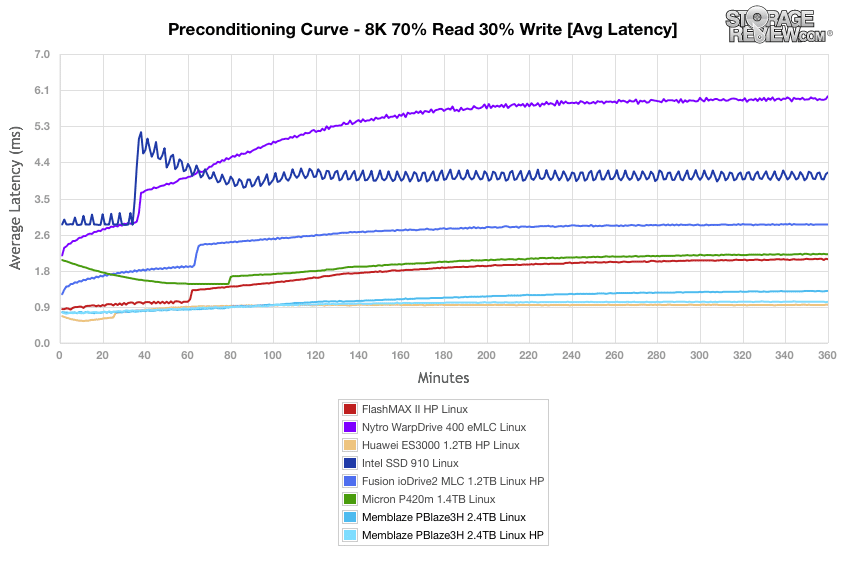
Our next workload uses 8k transfers with a ratio of 70% read operations and 30% write operations. The first set of charts present measurements made during the preconditioning process. After the burst period where the PBlaze3H vies for top position with the Huawei ES3000 for greatest throughput with our Linux platform, the PBlaze3H settles into second place with a notable improvement when overprovisioned for higher performance.
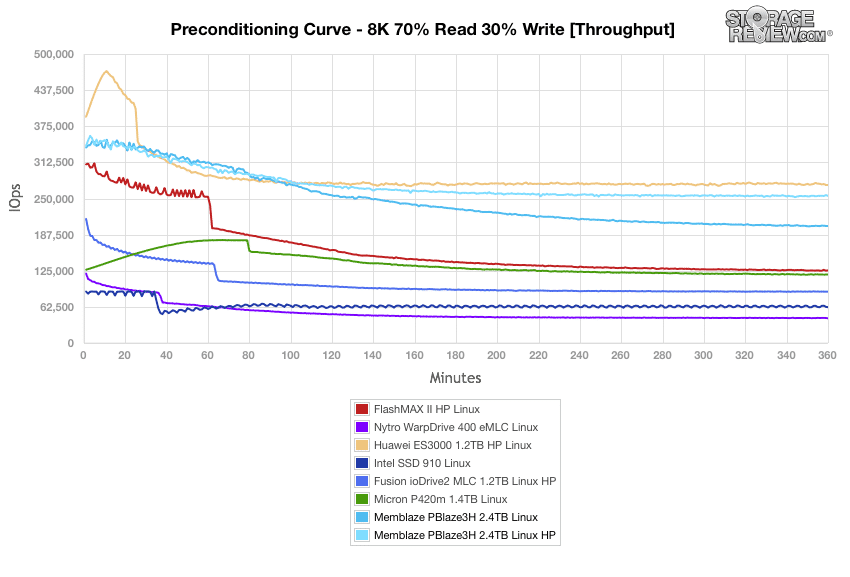
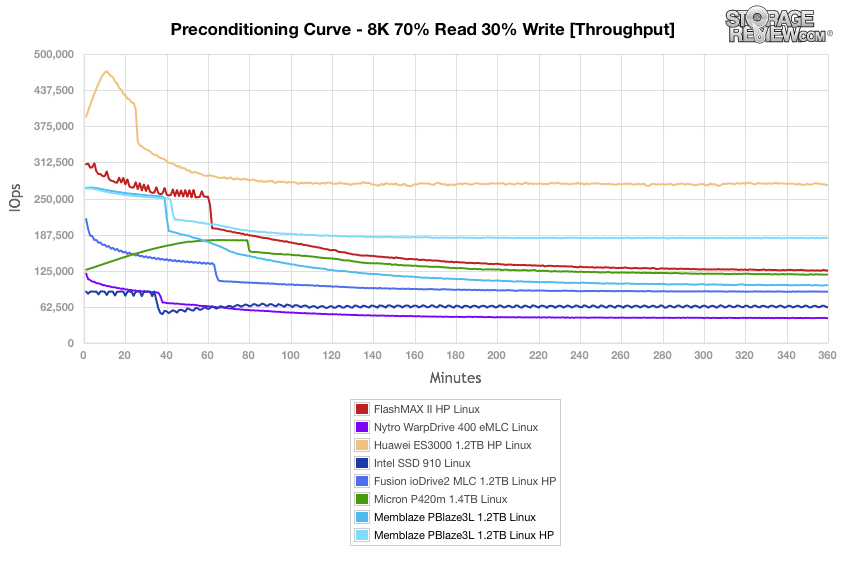
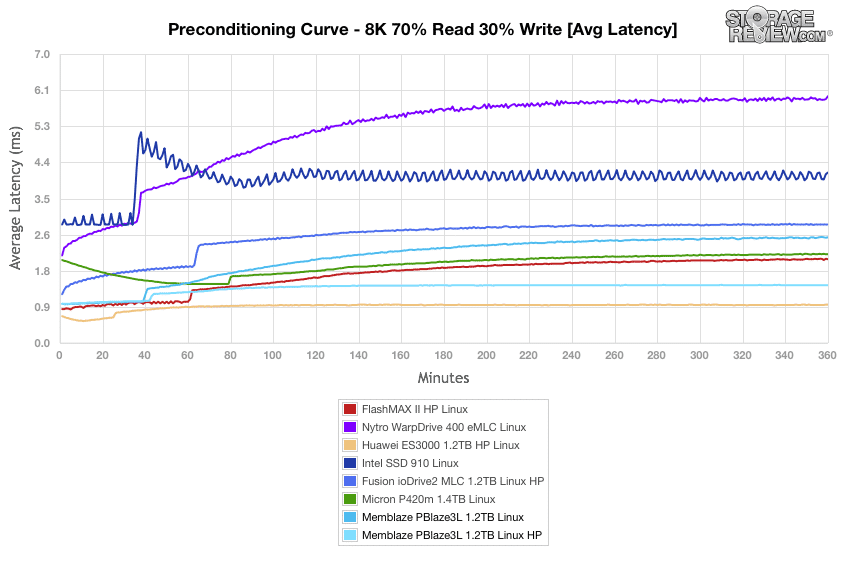
During the period of initial burst performance with our Linux testbed, the 1.2TB PBlaze3L performs comparably in its standard configuration and with high performance overprovisioning. At +40 minutes, the two configurations diverge, with the high performance configuration taking second place among the comparables at approximately 8,000 greater IOPS as the preconditioning curve approaches steady state.
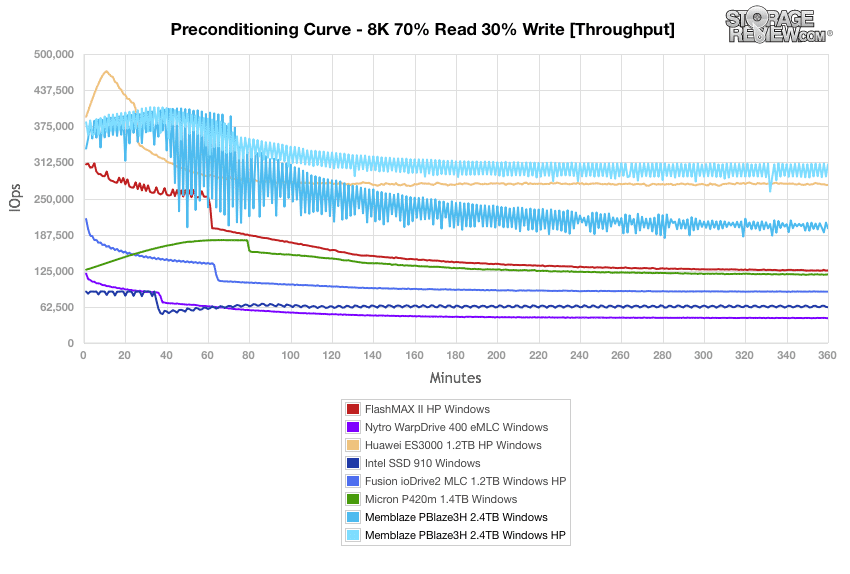
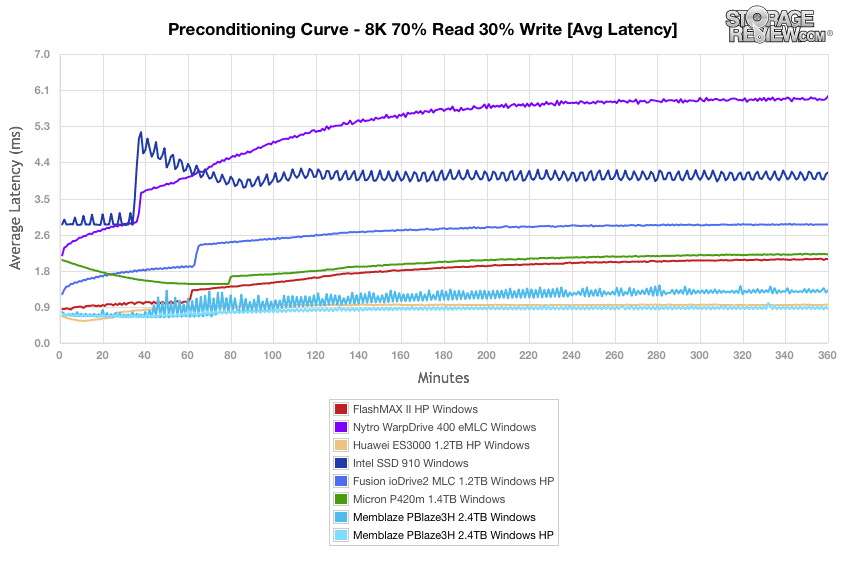
In Windows, the 2.4TB PBlaze3H experiences a marked cycling of throughput performance values between intervals during preconditioning for the 8k 70/30 benchmark. Regardless of this phenomenon, the high performance configuration takes the lead among the comparable drives by +30 minutes into the preconditioning process.
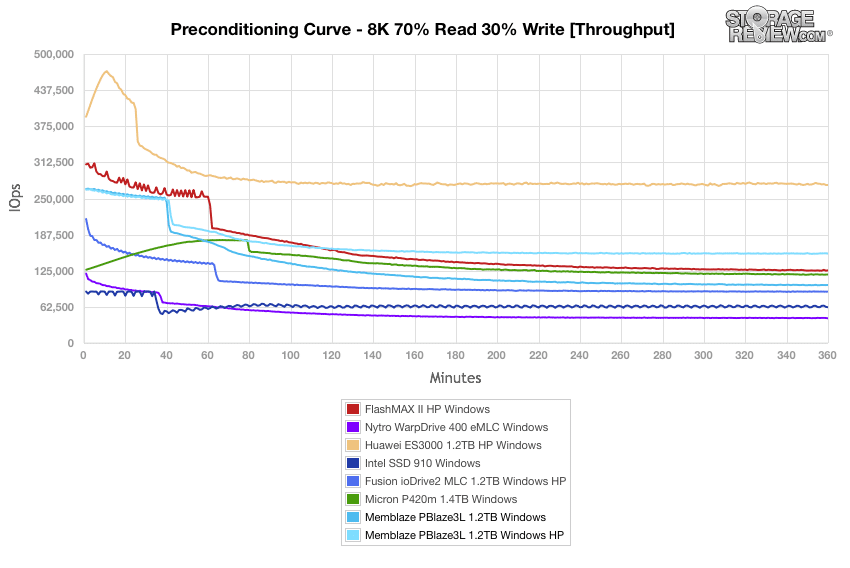
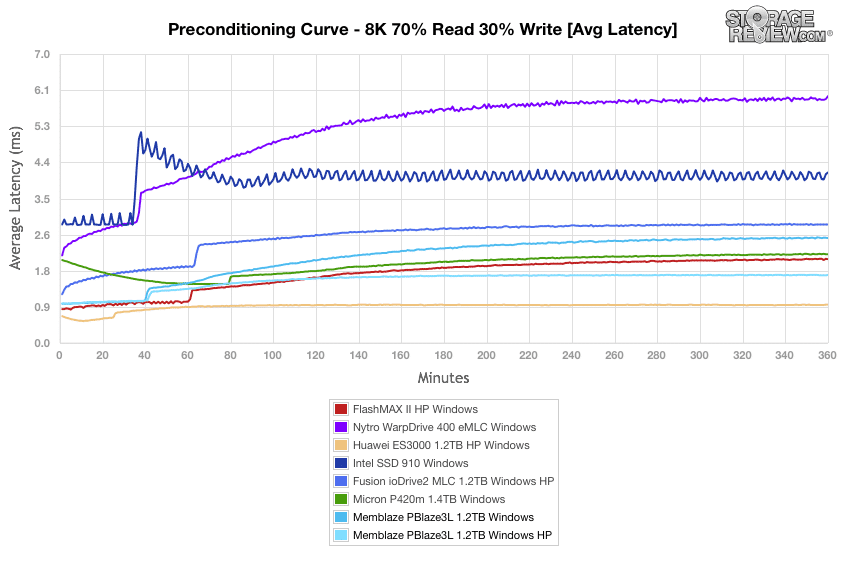
The 1.2TB PBlaze3L did not experience the same pattern of cycling in Windows, and is able to maintain a second-position performance to the Huawei ES3000 when configured for high performance as the curve approaches steady state.
Our measurements of average latency values for the 2.4TB PBlaze3H during Linux 8k 70/30 preconditioning are just above the Huawei ES3000 throughout this protocol, putting the PBlaze3H in second place among the comparables.
The 1.2TB PBlaze3L has a greater variation in average latencies between its standard configuration and the high performance overprovisioning during 8k 70/30 preconditioning in Linux. The high performance PBlaze3L configuration takes second place among these comparables.
The 2.4TB PBlaze3H is able to outperform the Huawei ES3000 in terms of average latency when overprovisioned for high performance during preconditioning for the 8k 70/30 benchmark in Windows.
The 1.2TB PBlaze3L moves towards steady state in Windows with a second-place average latency of approximately 2.5ms in its standard configuration and 1.6ms overprovisioned for high performance.
The 2.4TB PBlaze3H generally experienced maximum latencies in the range between 50ms and 70ms during the preconditioning process for the 8k 70/30 benchmark in Linux, scoring weakly against most comparables in this regard.
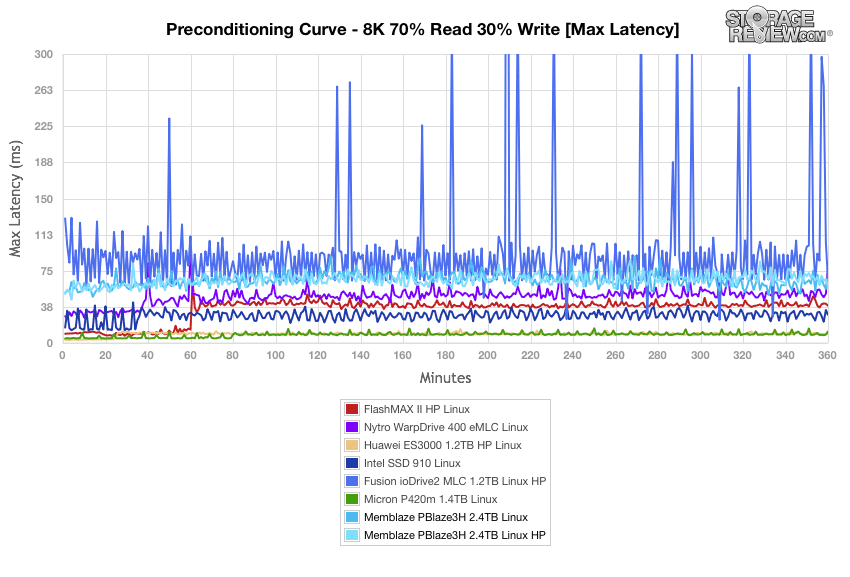
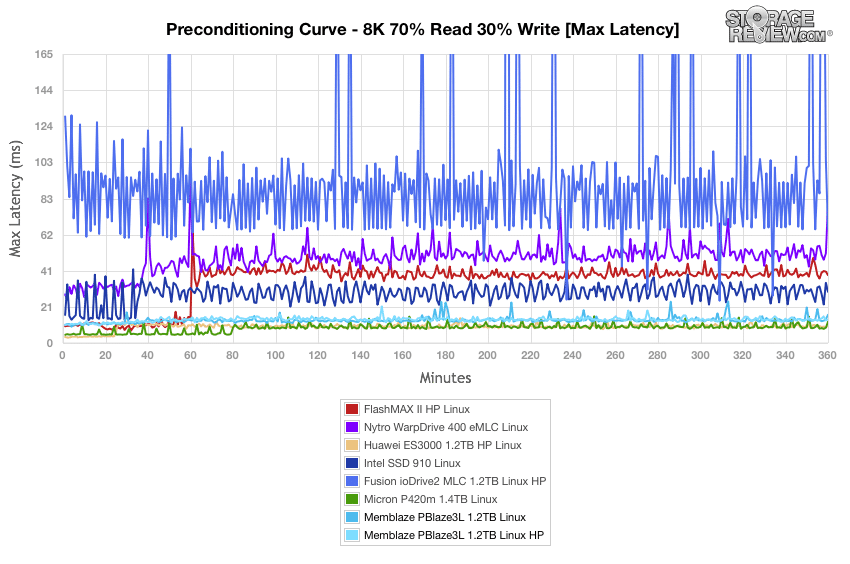
The 1.2TB PBlaze3L fared much better in terms of maximum latency during 8k 70/30 preconditioning in Linux with most spikes under 20ms with both standard and high performance overprovisioning.
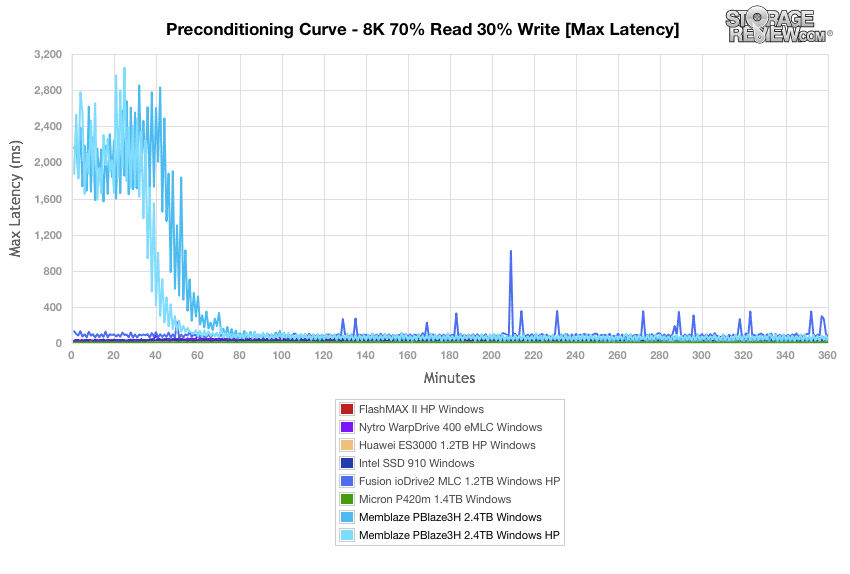
The 2.4TB PBlaze3H experienced large and erratic latencies during the burst period of 8k 70/30 preconditioning in Windows, throwing off the scale of our chart as some latencies exceed three seconds. As the PBlaze3H approached steady state, maximum latency values stabilized below 100ms for both the standard and high performance configurations.
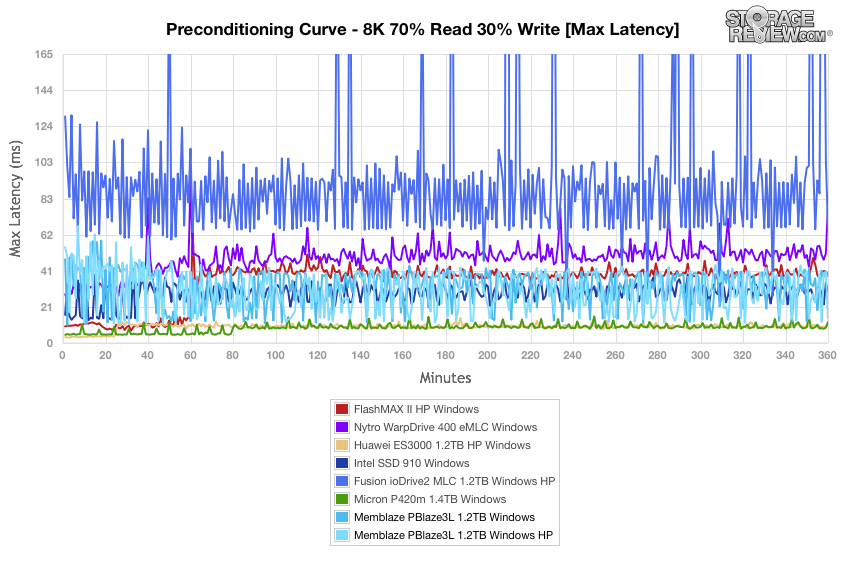
The 1.2TB PBlaze3L experienced much better maximum latencies in Windows during preconditioning for the 8k 70/30 benchmark.
Standard deviation calculations for the 2.4TB PBlaze3H during 8k 70/30 Linux preconditioning illustrate the relatively consistent latency performance of the PBlaze3H regardless of whether it utilizes standard overprovisioning or is overprovisioned for higher performance. By the end of the first hour of preconditioning the PBlaze3H emerges as the third-best performer among the comparables.
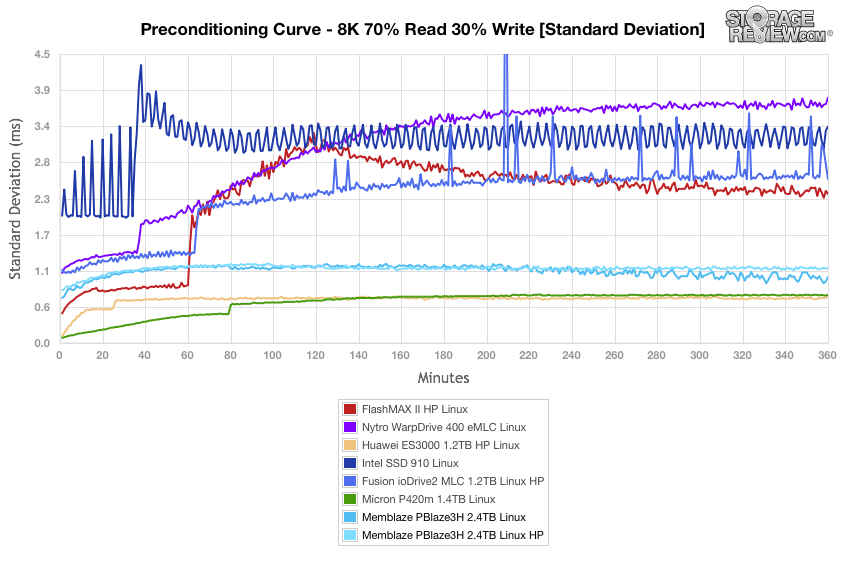
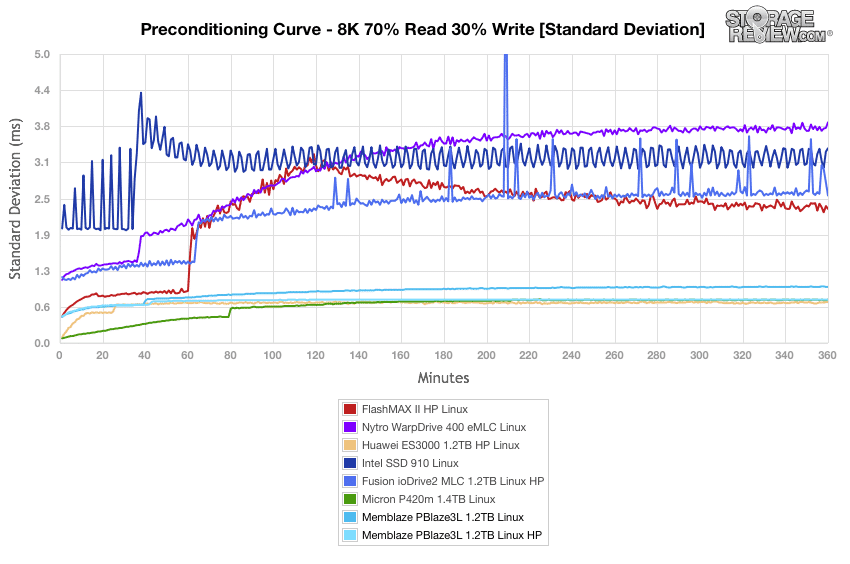
The 1.2TB PBlaze3L experiences even more consistent latency performance with the Linux testbed. With high performance overprovisioning, the PBlaze3L vies for top position with the Micron P420m and the Huawei ES3000.
Our plot of latency standard deviations during Windows 8k 70/30 preconditioning also highlights the performance problems that the 2.4TB PBlaze3H experiences during the burst period. Both PBlaze3H configurations experience standard deviation spikes above 8ms during this period.
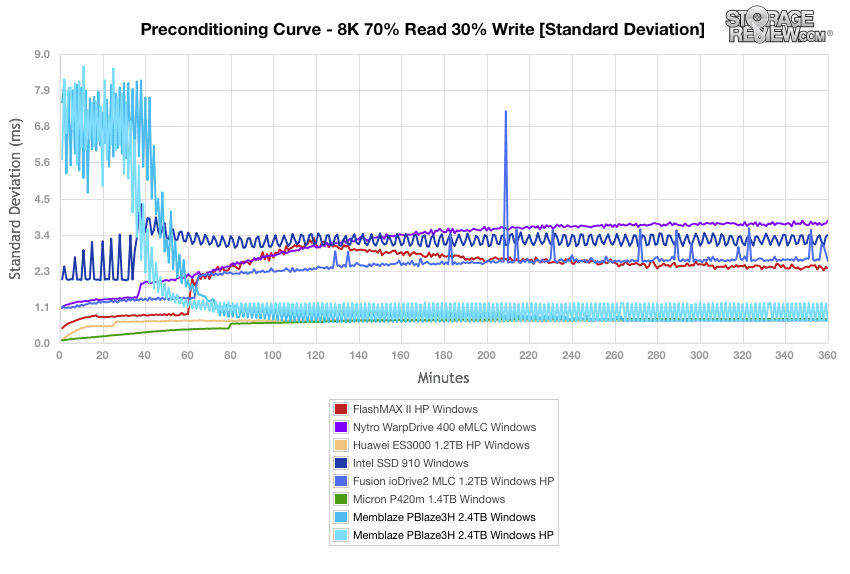
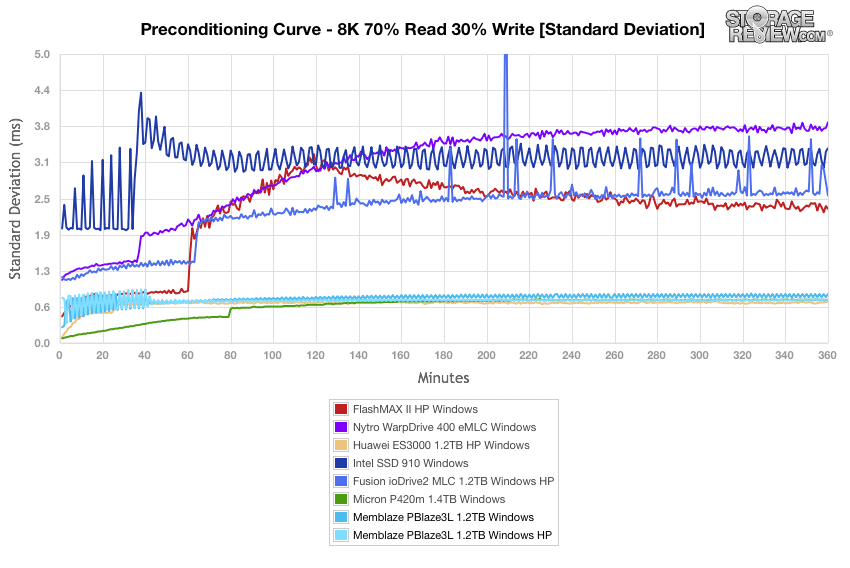
Standard deviation results for the 1.2TB PBlaze3L in Windows place it just behind the Huawei and Micron frontrunners during preconditioning for the 8k 70/30 benchmark.
With 8k 70/30 preconditioning complete on the Linux testbed, the 2.4TB PBlaze3H vies for top performance laurels with the Huawei ES3000 when the PBlaze3H is overprovisioned for high performance. The top performer varies by workload, with the PBlaze3H coming out on top with more than half of the workloads in this protocol.
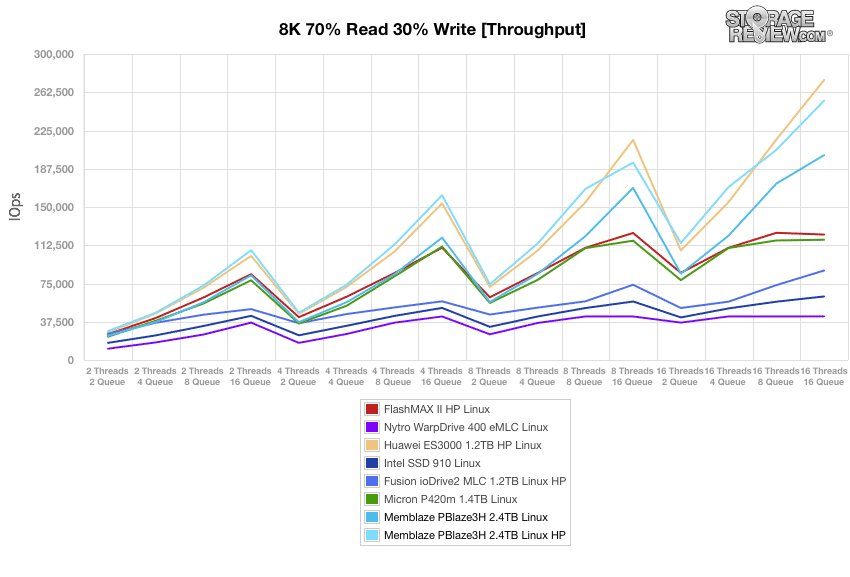
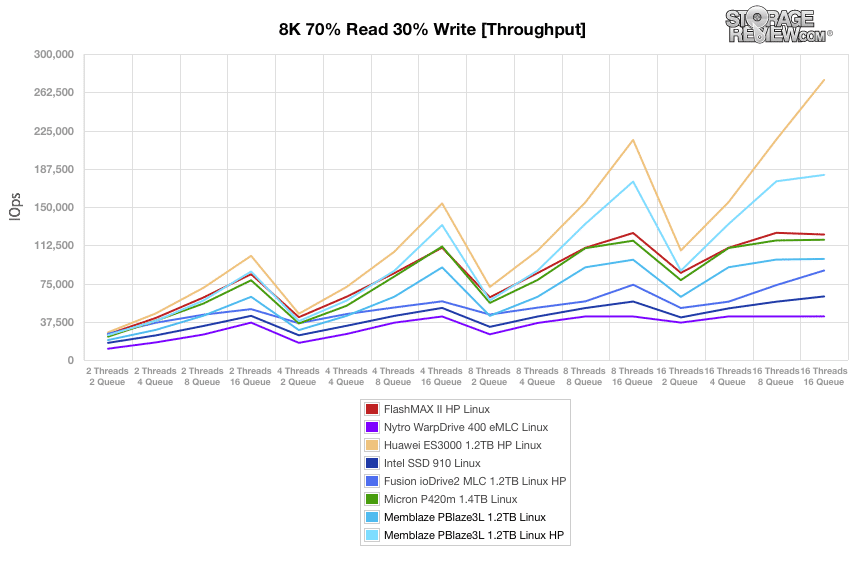
The 1.2TB PBlaze3L is not able to outpace the Huawei ES3000 in our Linux 8k 70/30 benchmark, but achieves a decisive second-place throughput result when tuned for high performance.
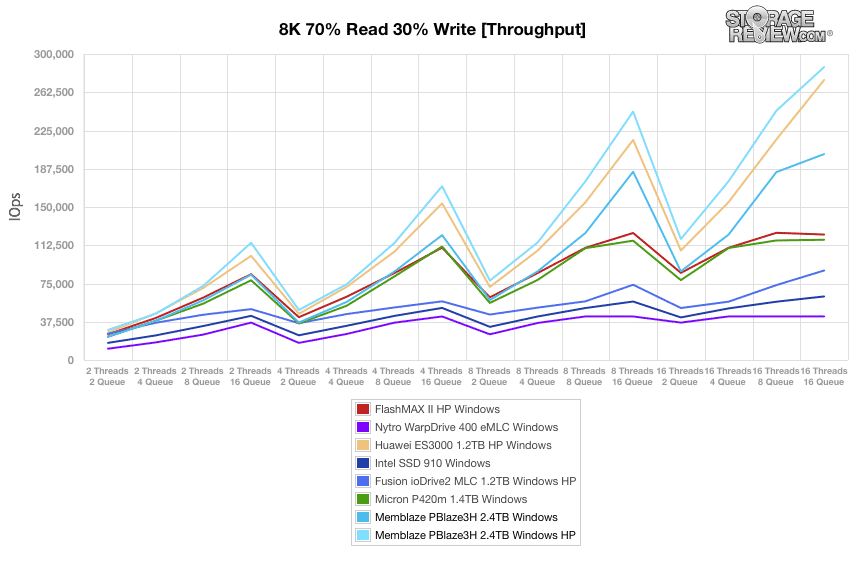
In terms of 8k 70/30 throughput in Windows, the 2.4TB PBlaze3H is able to take top position when configured for high performance, peaking at 254,325IOPS with 16 threads and a queue depth of 16. With standard overprovisioning the PBlaze3H peaks at 200,0853IOPS, falling behind only the Huawei ES3000.
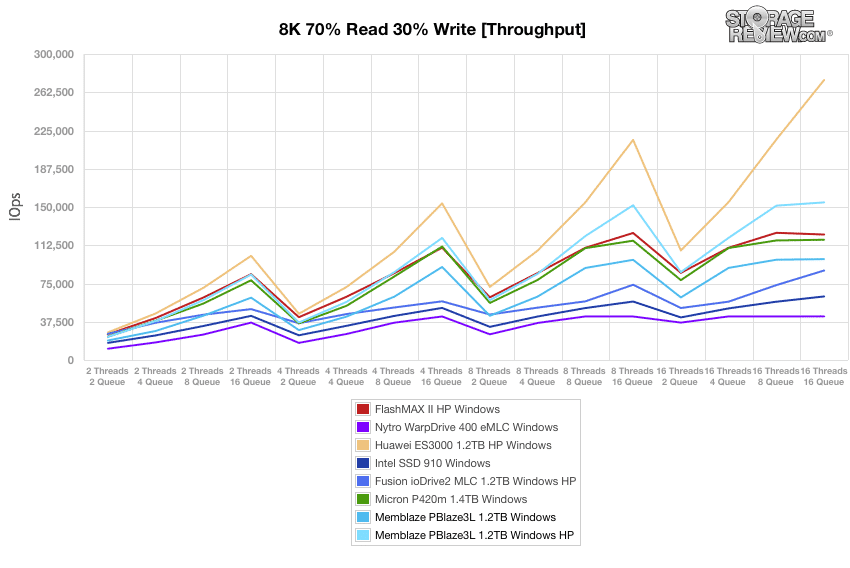
The 1.2TB PBlaze3L takes second-place overall to the Huawei ES3000 during the 8k 70/30 Windows benchmark when configured for high performance.
Average latency results in Linux for the 2.4TB PBLaze3H place it just above the Huawei ES3000 when overprovisioned for higher performance. With standard overprovisioning, the average latency profile of the PBlaze3H closely mirrors the Micron P420m and the FlashMAX II at workloads up to 8 threads with a queue depth of 8, when the PBlaze3H begins to outperform those comparables.
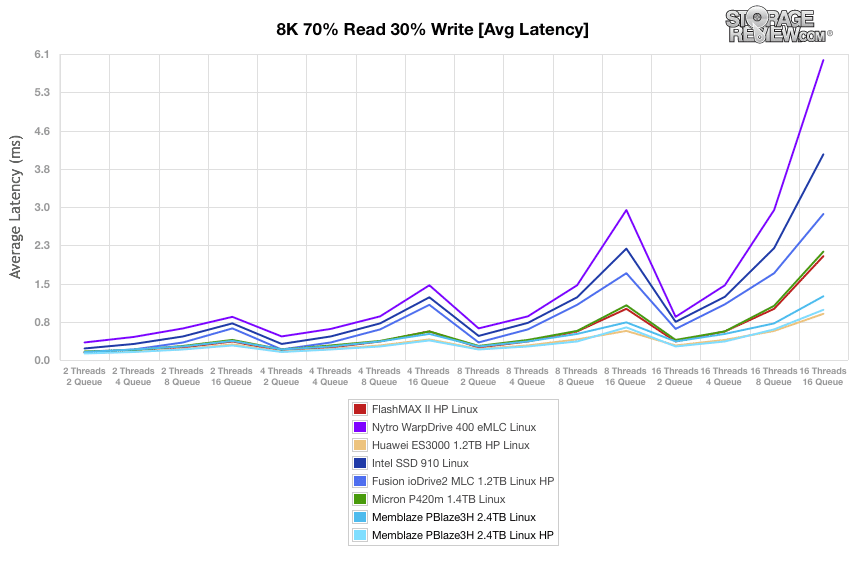
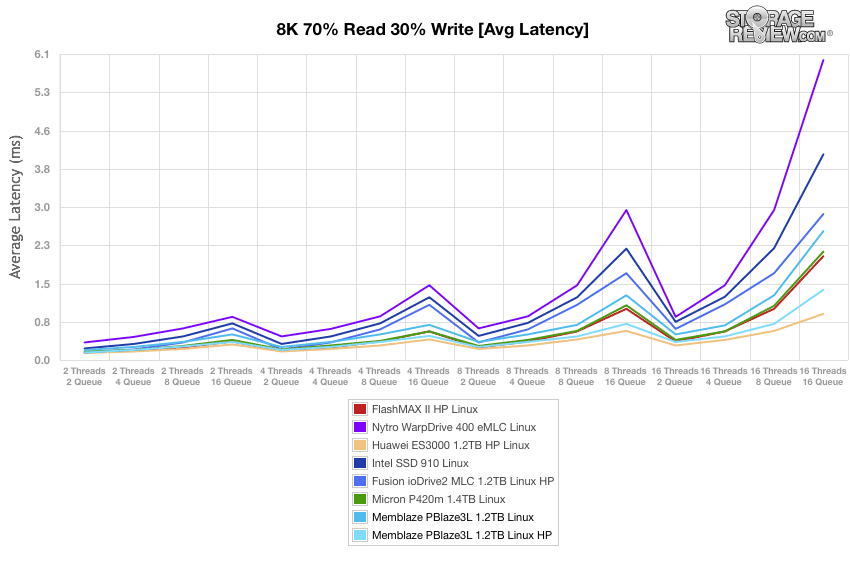
The 1.2TB PBlaze3L is also able to claim the second-best average latency results during the 8k 70/30 Linux benchmark when overprovisioned for greater performance. With standard overprovisioning, it performs at the middle of the pack.
These 2.4TB PBlaze3H maximum latency results give more insight into some of the erratic results captured in Windows during 8k preconditioning, which uses a heavy workload. Maximum latencies spike notably when the PBlaze3H is overprovisioned for high performance and tasked with the 8 thread/16 queue workload, when the PBlaze3H experienced a latency peak of nearly 78ms. The greatest latency measured on the 16 thread/16 queue workload while configured for high performance was 87.5ms. With standard overprovisioning, the PBlaze3H experienced smaller spikes with the 8 thread/16 queue workload and the 16 thread/16 queue workload.
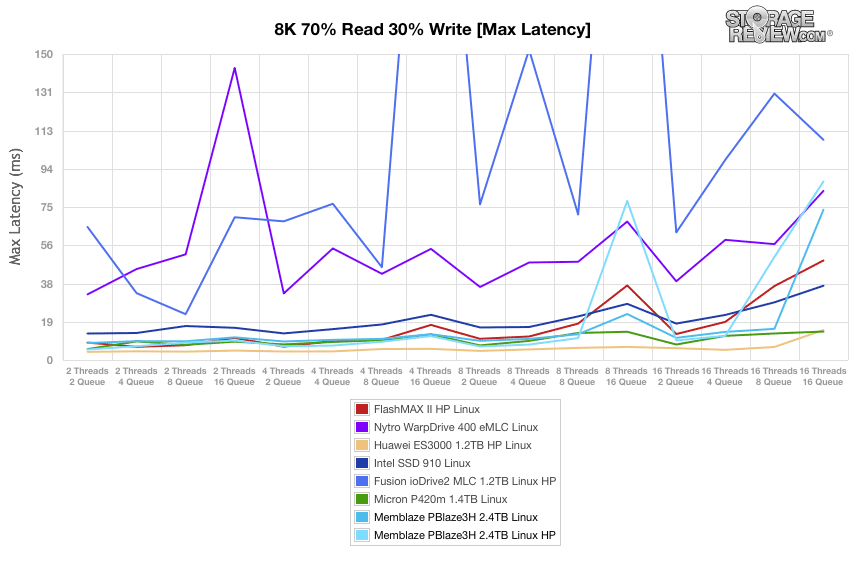
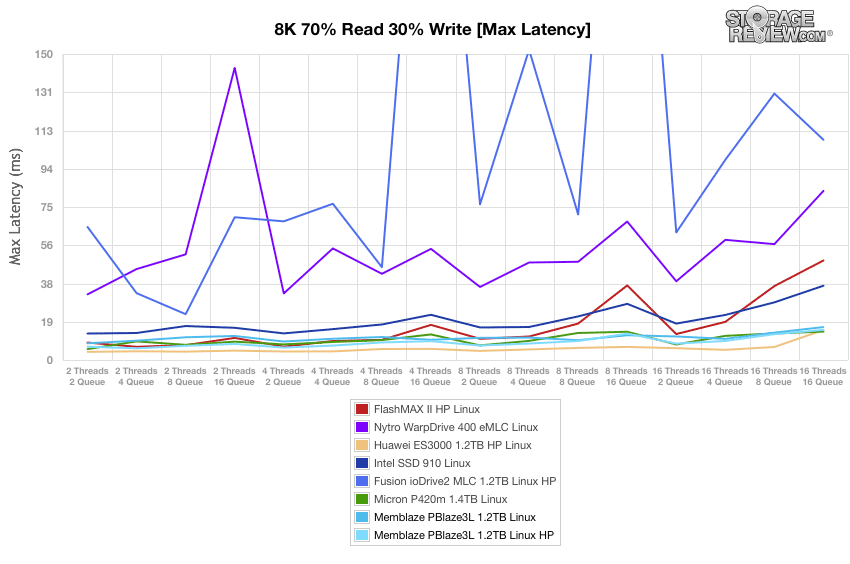
By contrast, the 1.2TB PBlaze3L keeps its maximum latencies in check during the 8k 70/30 benchmark in Linux. Overprovisioning for higher performance keeps maximum latencies slightly lower than the standard configuration with lighter workloads but does little to improve maximum latency performance beginning with the 8 thread/16 queue workload.
When we plotted the maximum latencies from our 8k 70/30 benchmark in Windows, the 2.4TB PBlaze3H was much better able to maintain low maximum latencies than in Linux. When overprovisioned for high performance, the PBlaze3H does spike to 121ms during the most intense phase of the benchmark however. This again hearkens back to the PBlaze3H's variations in performance with heavy workloads during preconditioning.
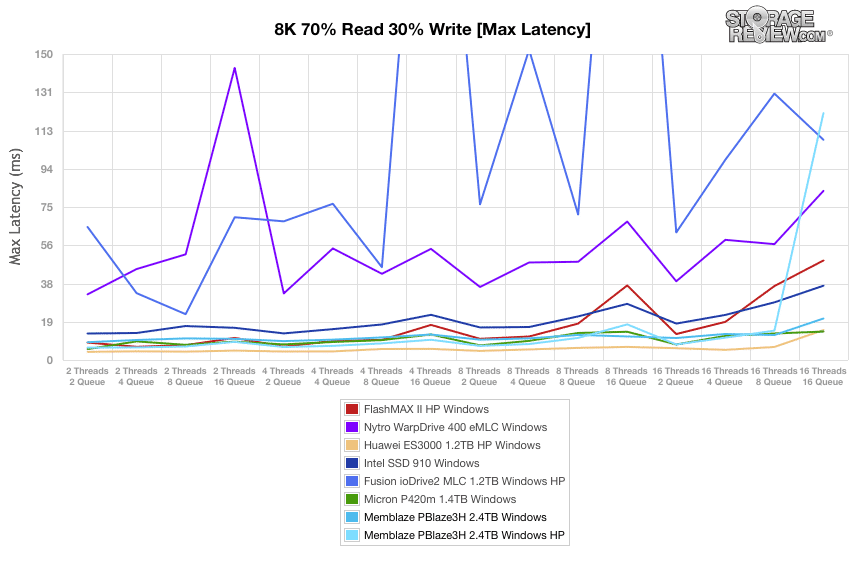
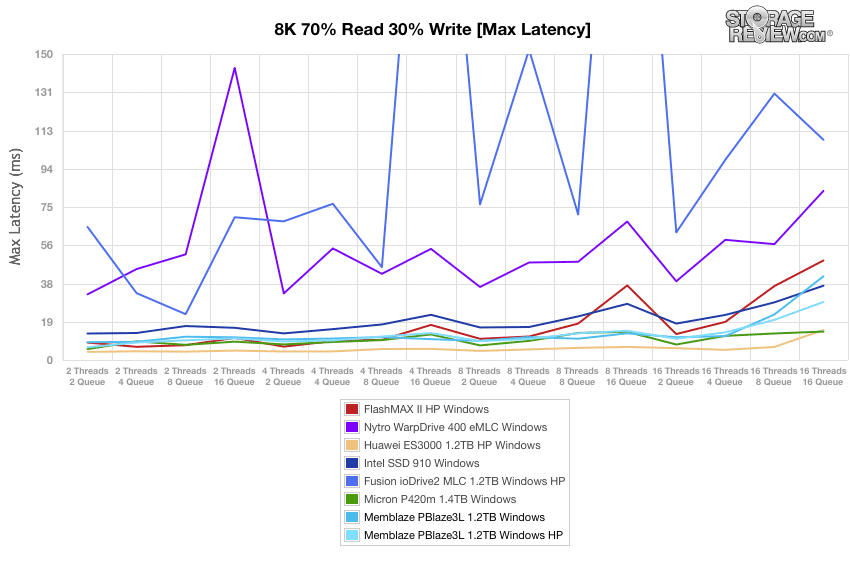
In Windows, the 1.2TB PBlaze3L remains in among the three lowest latencies for most of the 8k 70/30 protocol, although the PBlaze3L with standard overprovisioning slips behind the Intel SSD 910 with at 16 thread/16 queue workload.
Except for the three workloads where the 2.4TB PBlaze3H configured for high performance had trouble in Linux during the 8k 70/30 benchmark, its standard deviation results are as consistent as the best performers in this class. Standard overprovisioning only has relatively minor trouble maintaining consistent latency results during the 16 thread/16 queue workload, with a standard deviation of 0.99ms.
The 1.2TB PBlaze3L has maintains a very competitive third place in our standard deviation calculations for the Linux 8k 70/30 benchmark when it uses high performance overprovisioning.
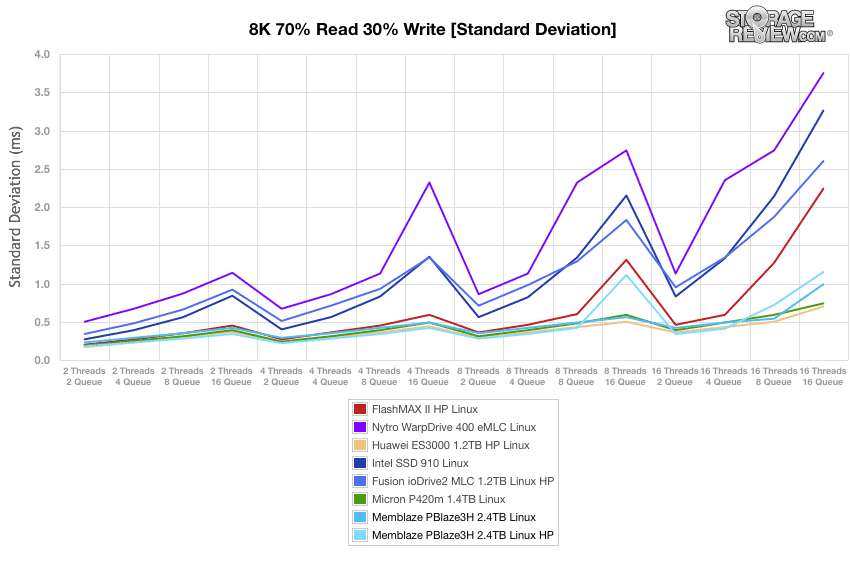
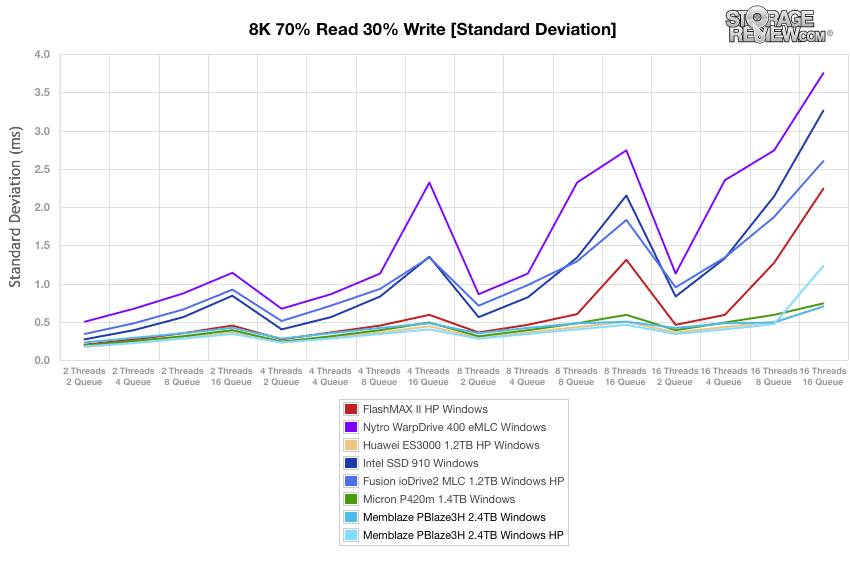
The 2.4TB PBlaze3H maintains a place among the top three comparables in Windows whether configured with standard overprovisioning or high performance overprovisioning. When configured for high performance, the standard deviation value with the 16 thread/16 queue workload spikes to 1.23ms.
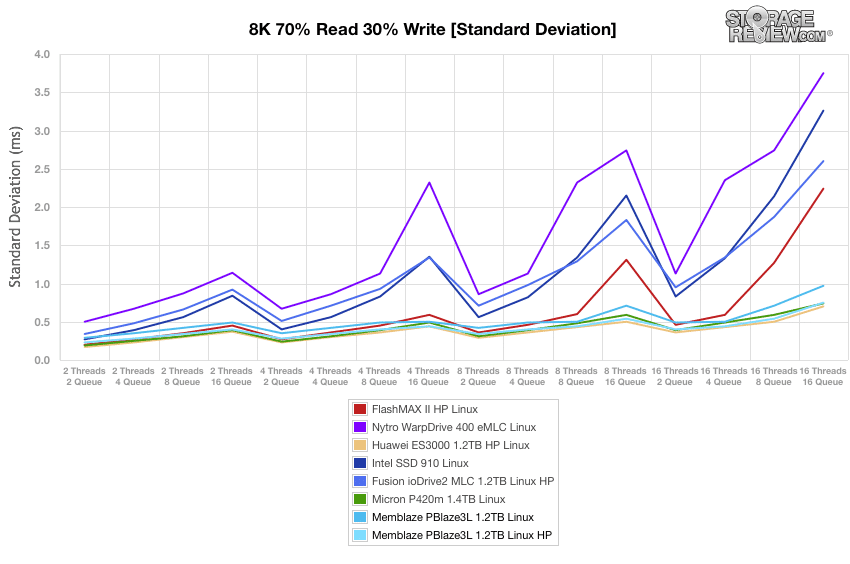
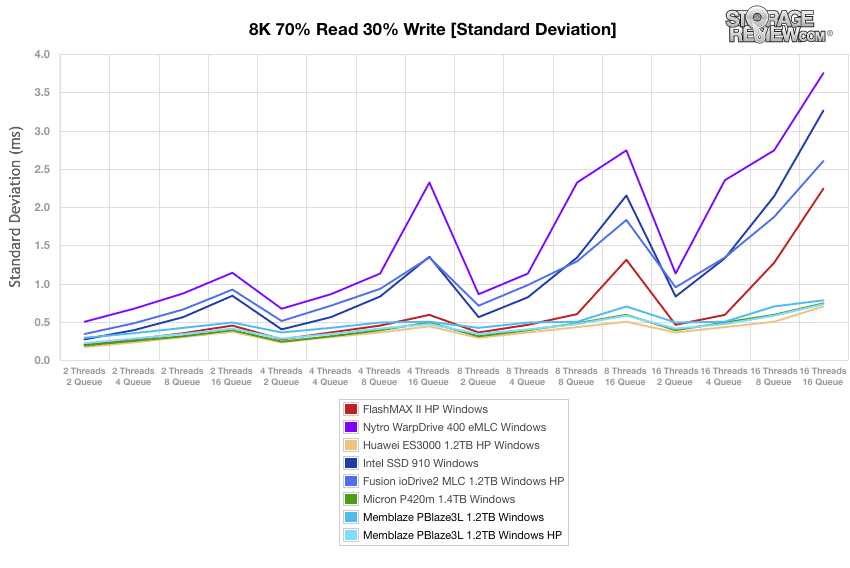
In Windows and overprovisioned for high performance, the 1.2TB PBlaze3L vies closely with the Micron P420m for the best standard deviation values calculated from latency results for 8k 70/30 operations. With standard overprovisioning, the PBLaze3L still does well, maintaining a third-best result.
Conclusion
The Memblaze PBlaze3 represents a new technology platform with a lot of promise, although it does have some rough spots to iron out with the PBlaze3H's performance under heavy synthetic workloads. In most regards, however, both the PBlaze3H and the PBlaze3L performed strongly against the best-in-class PCIe SSDs that have passed through the StorageReview Enterprise Testing Lab to date.
While the usual provisos apply for a technology which has not been time-tested in the field, the solid overall performance of the PBlaze3 platform suggest that Memblaze could become a player among the established names in the PCIe SSD marketplace. An unusually broad variety of capacity options via the Pianokey architecture may strike the perfect chord with some customers, but its performance and longevity that will make the PBlaze3 a contender. From what we have seen of its performance, the PBlaze3 family has a definite shot.
Pros
- Strong performance in application benchmarks
- Wide variety of available capacities
Cons
- The 2.4 TB PBlaze3H experiences some flutter under some heavy workloads
The Bottom Line
The Memblaze PBlaze3 platform has a few rough edges, but its performance suggests great possibilities for this new contender in the evolving enterprise PCIe SSD space.


 Amazon