

Along with the Samsung 860 PRO that was announced at CES 2018 for high-end users, the company has also released a new 860 EVO. The EVO line is aimed for more mainstream uses for notebooks and desktops. Making improvements on the 850 EVO, the 860 EVO has six times the sustained performance of the 850 and has quoted speeds of 550MB/s read and 520MB/s write, which is only a hair over the quoted speeds of the 850 EVO on read and the same on write.
Like its predecessor, the 860 EVO comes in capacities as high as 4TB, however the lower end now stops at 250GB. The new 860 EVO leverages the same 3bit MLC 3D V-NAND as the 850 but comes with an updated Samsung MJX controller. One area were it sets itself apart from the 850 EVO is that the new version comes in an M.2 form factor with up to 2TB of capacity. This makes for a nice capacity and performance upgrade to ultra-thin notebooks.
The Samsung 860 EVO comes with a 5-year limited warranty and has MSRP of $94.99, $169.99, $329.99, $649.99, and $1,399.99 for the 250GB, 500GB, 1TB, 2TB, and 4TB respectively. For our review, we will be looking at the 500GB model.
Samsung 860 EVO Specifications
| Form factor: | 2.5-inch |
| Interface: | SATA: 6 Gbps |
| NAND: | Samsung 3D V-NAND 3bit MLC |
| Capacities: | 4TB, 2TB, 1TB, 500GB, 250GB |
| Cache: | 4GB LPDDR4 (4TB) |
| 2GB LPDDR4 (2TB) | |
| 1GB LPDDR4 (1TB) | |
| 512MB LPDDR4 (250/500GB) | |
| Controller: | Samsung MJX Controller |
| Performance | |
| Seq.Read/Write Speed: | Up to 550/520MB/s |
| Ran.Read/Write Speed (QD32): | Max. 98K IOPS / 90K IOPS |
| Device Sleep: | 2.6 mW for 1TB (Up to 8mW for 4TB) |
| Management SW: | Magician Software for SSD management |
| TBW (Endurance): | 4TB: 2,400 TBW |
| 2TB: 1,200 TBW | |
| 1TB: 600 TBW | |
| 500GB: 300 TBW | |
| 250GB: 150 TBW | |
| Warranty: | 5 years or up to 2,400 TBW |
Design and Build
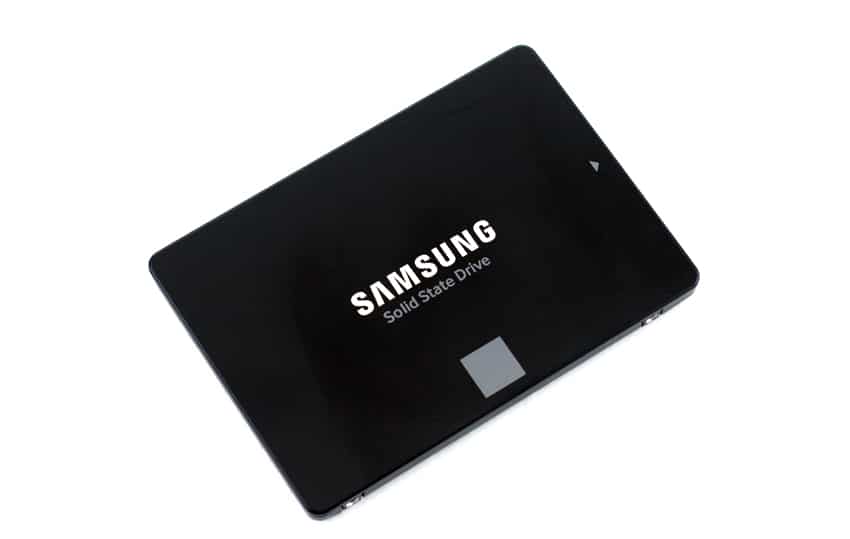
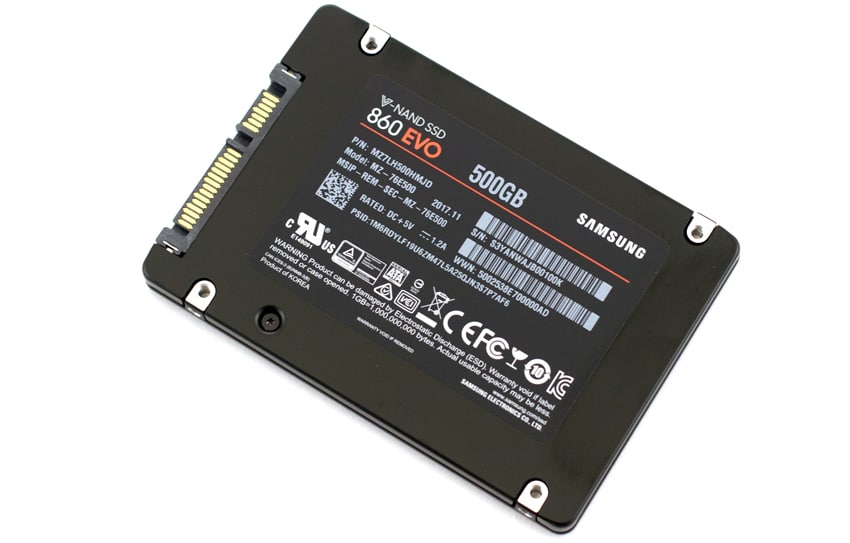
Samsung has kept the overall design of previous models of the EVO with a black case and a light gray square on top of the drive under the Samsung branding. A large sticker that tells important information such as model and serial number as well as capacity takes up the flip side.
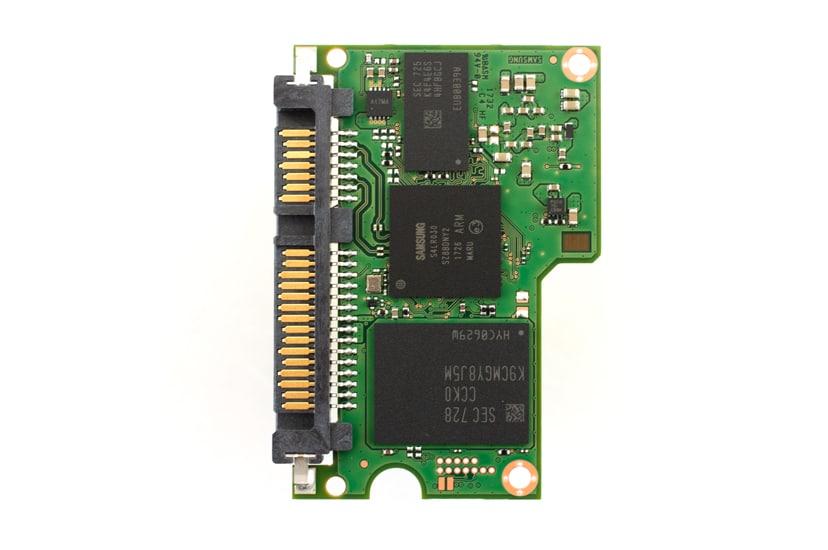
Opening up the drive one can see the new Samsung MJX controller, Samsung NAND pack, and DRAM on a stubby PCB.
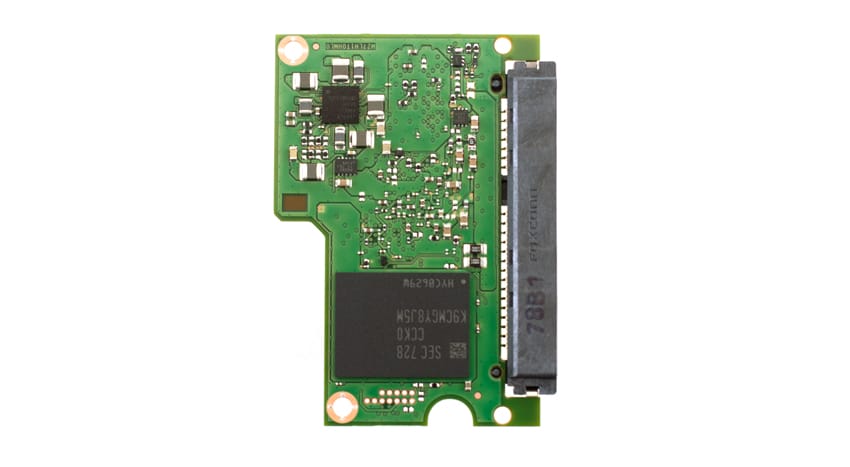
On other side of the PCB has the remaining NAND pack.
Performance
Testbed
The test platform leveraged in these tests is a Dell PowerEdge R740xd server. We measure performance through a Dell H730P RAID card inside this server, although we set the card in HBA mode only to disable the impact of RAID card cache. The methodology used better reflects end-user workflow with the consistency, scalability and flexibility testing within virtualized server offers. A large focus is put on drive latency across the entire load range of the drive, not just at the smallest QD1 (Queue-Depth 1) levels. We do this because many of the common consumer benchmarks don’t adequately capture end-user workload profiles.
SQL Server Performance
We use a lightweight virtualized SQL Server instance to appropriately represent what an application developer would use on a local workstation. The test is similar to what we run on storage arrays and enterprise drives, just scaled back to be a better approximation for behaviors employed by the end user. The workload employs the current draft of the Transaction Processing Performance Council’s Benchmark C (TPC-C), an online transaction processing benchmark that simulates the activities found in complex application environments.
The lightweight SQL Server VM is configured with three vDisks: 100GB volume for boot, a 350GB volume for the database and log files, and a 150GB volume used for the database backup we recover after each run. From a system resource perspective, we configure each VM with 16 vCPUs, 32GB of DRAM and leverage the LSI Logic SAS SCSI controller. This test uses SQL Server 2014 running on Windows Server 2012 R2 guest VMs, and is stressed by Dell’s Benchmark Factory for Databases.
SQL Server Testing Configuration (per VM)
- Windows Server 2012 R2
- Storage Footprint: 600GB allocated, 500GB used
- SQL Server 2014
- Database Size: 1,500 scale
- Virtual Client Load: 15,000
- RAM Buffer: 24GB
- Test Length: 3 hours
- 2.5 hours preconditioning
- 30 minutes sample period
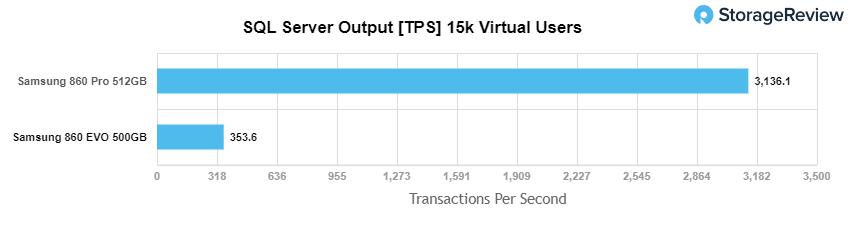
When looking at SQL Server Output, the new Samsung 860 EVO had a very poor showing on our transactional benchmark with only 353.6 TPS, where as the pro version hit 3,136.1 TPS.
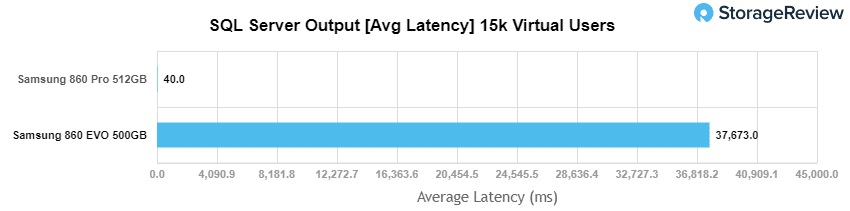
This poor SQL performance carried on in our average latency test with the EVO has an average latency of 37,673ms compared to the PRO’s 40ms.
VDBench Workload Analysis
StorageReview has rolled out an updated assortment of tests for end-user SSDs, which are designed to look more at IOPS or throughput in relationship to latency. These benchmarks have been honed at a much larger scale for enterprise drives; for client SSDs, we decrease the loads to more common workload sizes. Testing is done within VMware ESXi 6.5 with a 20GB test footprint, comprised of two 10GB vdisks that are placed onto a datastore presented off the SSD under load. The test platform leveraged in these tests is a Dell PowerEdge R740xd server. We measure performance through a Dell H730P RAID card inside this server, although with the card set in HBA mode only to disable the impact of RAID card cache. The methodology used better reflects end-user workflow with the consistency, scalability and flexibility testing within virtualized server offers.
While not a perfect representation of actual workloads, synthetic tests do help to baseline storage devices with a repeatability factor that makes it easy to do apples-to-apples comparison between competing solutions. These workloads offer a range of different testing profiles of common transfer sizes. We’ve also included new VDI workload profiles. With local hypervisors installed such as VMware Fusion, Parallels or even ESXi, many end users are starting to see I/O workflows similar to a multi-tenant environment. This is especially true for heavy users that run several apps and browser tabs simultaneously.
All of these tests leverage the common VDBench workload generator, with a scripting engine to automate and capture results over a large compute testing cluster. This allows us to repeat the same workloads across a wide range of storage devices.
Profiles:
- 4K Random Read: 100% Read, 128 threads, 0-120% iorate
- 4K Random Write: 100% Write, 64 threads, 0-120% iorate
- 64K Sequential Read: 100% Read, 16 threads, 0-120% iorate
- 64K Sequential Write: 100% Write, 8 threads, 0-120% iorate
- VDI Traces
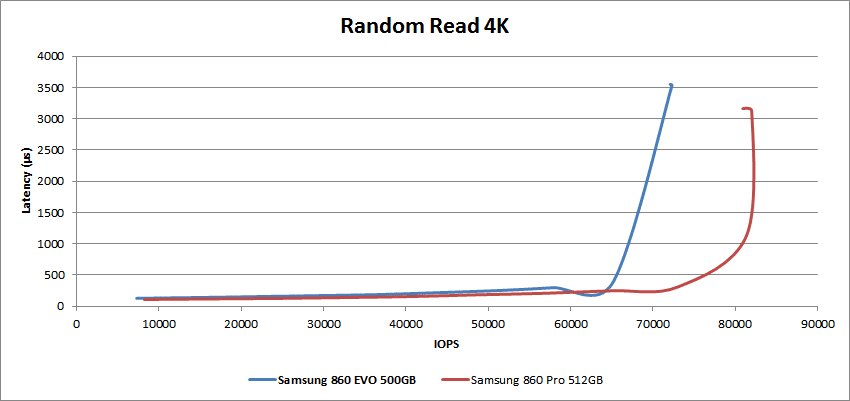
For our VDBench tests we will be comparing the Samsung 860 EVO 500GB to the Samsung 860 PRO 512GB. Looking at peak read performance, the EVO had sub-millisecond latency performance up to just over 65K IOPS and peaked at 72,329 IOPS with a latency of 3.53ms. The PRO on the other hand had sub-millisecond performance past the EVO’s peak.
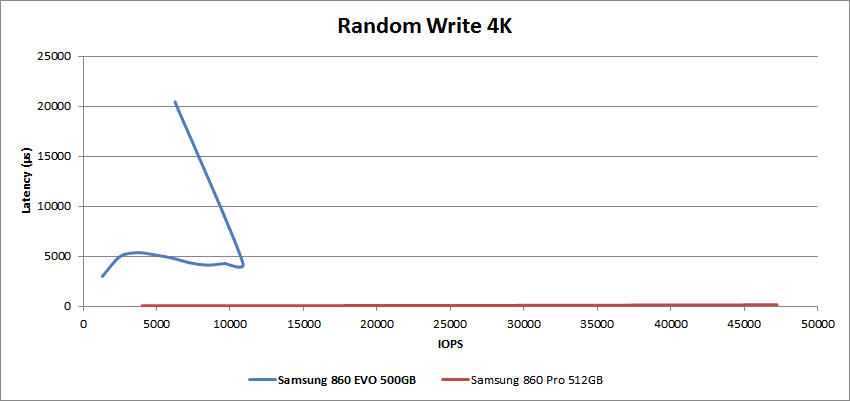
For peak 4k write performance the EVO showed a much different performance profile than the 860 PRO. The drive started above 1ms (1.3ms) went to 10,876 IOPS at 4.3ms latency and then the drive shot up to 20.4ms in latency and dropped to 6,252 IOPS. The PRO on the other hand, had sub-millisecond performance throughput peaking at 47,241 IOPS and a latency of 161μs.
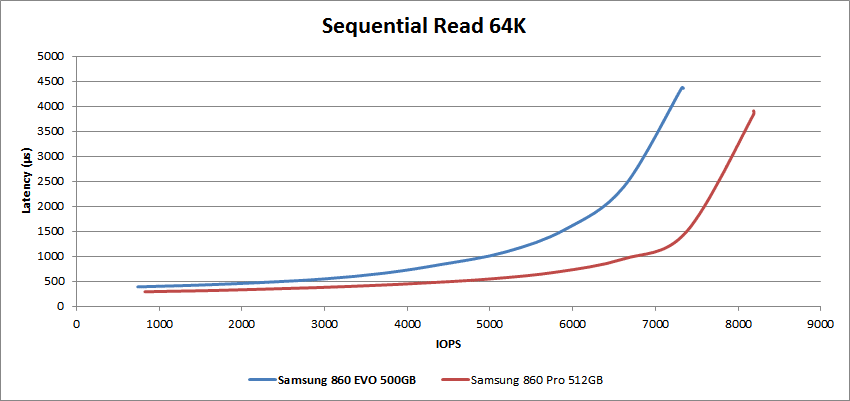
For sequential 64k read performance, the EVO had sub-millisecond performance until about 5,000 IOPS or about 320MB/s and peaked at 7,319 IOPS with a latency of 4.4ms and a bandwidth of 447MB/s. The PRO broke above sub-millisecond latency around 6,700 IOPS or around 415MB/s and peaked at 8,187 IOPS with 3.9ms latency and a bandwidth of 511.67MB/s.
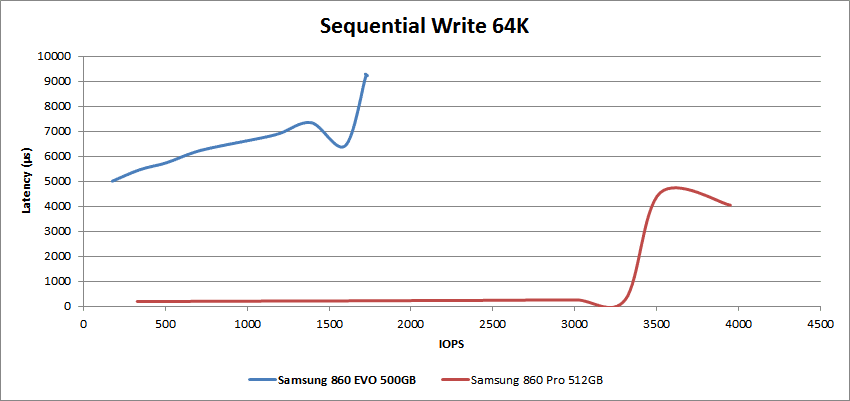
Sequential 64K write gave another weak performance by the 860 EVO. Starting at 5ms with a performance of only 178 IOPS or 11.1MB/s the drive peaked at 1,723 IOPS or 107.72MB/s with a latency of 9.19ms. For comparison the 860 PRO had sub-millisecond latency performance until around 3,300 IOPS or 210MB/s and peaked at 3,947 IOPS or 246.72MB/s with a latency of 4.05ms.
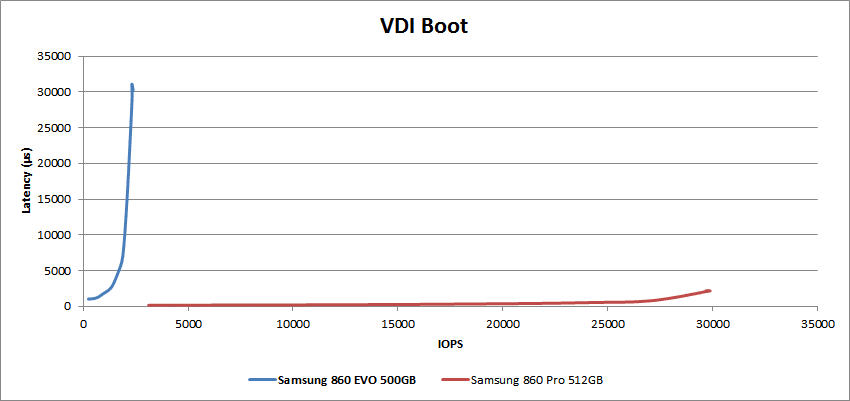
Next we looked at our VDI benchmarks that tax the drives a bit more; these tests include Boot, Initial Login, and Monday Login. For the Boot test, the Samsung 860 EVO again showed performance well below expectations. The EVO started above sub-millisecond latency performance and quickly peaked at 2,316 IOPS with a latency of 3.11ms. The 860 PRO ran below 1ms latency until 27K IOPS and peaked at 29,869 IOPS with a latency of 2.17ms.
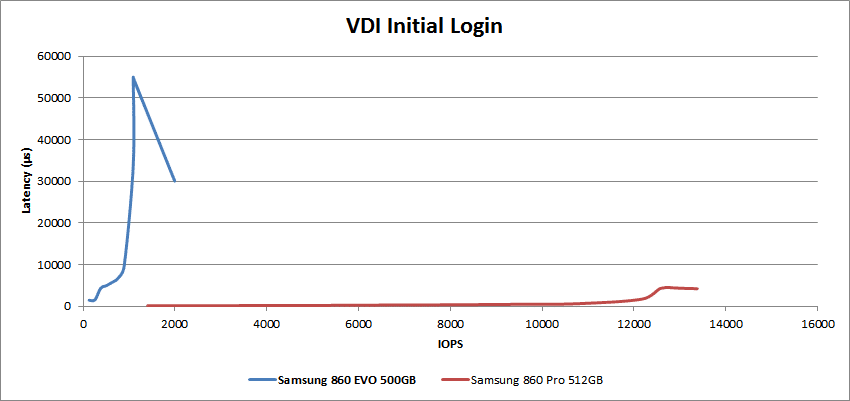
VDI Initial Login showed a start for the EVO above 1ms and a large latency spike before dropping down to 1,993 IOPS with a latency of 30ms. The 860 PRO had sub-millisecond performance until about 11K IOPS and peaked at 13,376 IOPS with a latency of 4.2ms.
VDI Monday Login once again saw a big spike in latency before the EVO peaked at 1,000 IOPS and a latency of 2.1ms. The PRO version on the other had made it to nearly 12K IOPS before going over 1ms and peaked at 13,267 IOPS and a latency of 2.4ms.

Conclusion
Samsung has updated its EVO line of mainstream SATA SSDs with the 860. The new SSD sees a very slight bump in performance and better endurance. The drive has a new controller and leverages intelligent TurboWrite technology to squeeze out quoted speeds of 550MB/s read and 520MB/s write. The 860 EVO comes in capacities ranging from 250GB to 4TB with the upper end model coming out at $100 USD less MSRP than the 850 EVO did a year ago.
Looking at performance, we see a rare misstep for Samsung. Generally speaking Samsung is a performance trend-setter in end-user computing, which has been the case with many of their SSDs. With the 860 EVO, although perhaps harder hit with the lower capacity version, the drive falls flat under performance-heavy workloads. In our test/dev SQL server benchmark the EVO only had 353.6 TPS and an average latency of 37,673ms. On our VDBench test the EVO had good performance in our 4k random read (sub-millisecond performance until 65K IOPS with a 72K IOPS peak and 3.53ms of latency) and 64k sequential read (sub-millisecond performance until 320MB/s with a peak of 447MB/s with a 4.4ms latency). The rest of the VDBench saw poor results often with spiking latency and unimpressive peak performance.
While our charts may be alarming at first glance, the 860 EVO will most likely be more than adequate for most typical desktop use cases with shallow queue depths. The bigger issue for potential buyers is whether they feel that the 860 EVO is worth opting for, or paying a premium for the 860 PRO that’s able to better handle itself under more demanding conditions.
A quick glance over the specs can show potential buyers that there isn’t much new here. The price for the 860 EVO is about even with the 850 EVO after a year, so going with the new model doesn’t take any more out of pocket. The lack of innovation here may have less to do with Samsung and its NAND and more to do with the SATA interface. This interface has been standard for some time now and has seen many innovations for it in terms of speed and capacity, but it is nearing the end of the road as to what can be done to improve the performance it can push. It wouldn’t be much of a surprise to start seeing 6TB or 8TB SATA SSDs in the near future but the speeds probably won’t improve too much.
The Bottom Line
The 500GB Samsung 860 EVO SSD fails to deliver in performance and comes at a premium price. For light users though, the EVO will probably get the job done and may be an option when pricing is more aggressive.


 Amazon