

The Seagate Enterprise Performance 15k HDD is the fifth generation of Seagate’s Enterprise Performance line. The drive is a 2.5” form factor, 15K SAS 12Gb/s HDD coupled with the “TurboBoost” of 32GB of eMLC flash for faster read and write performance as well as 128MB multisegmented cache. The drive comes with a maximum capacity of 600GB, twice the capacity of the previous generation. For buyers with data security in mind, there is also a secure model available with instant secure erase.
As the name implies, the drives are aimed at delivering performance in mission-critical situations. The 2.5” form factor allows for greater density and power savings over 3.5” legacy drives. TurboBoost functionality allows for accelerated I/O operations, optimized response times, hot data performance improvements, all while delivering predictable performance. The Seagate Enterprise Performance 15k HDD is ideal for Tier 1 enterprise servers, blade, rack, and tower servers hosting transaction-based applications, data centers where power and space are constrained, and compliance and data security are required.
The Enterprise Performance ships in 300GB and 600GB capacities, comes with a 5-year warranty, and has a starting street price of $319.99 (for the 300GB model). Our review set is comprised of sixteen 600GB non-secure drives in a Dot Hill AssuredSAN 4824 array.
Enterprise Performance 15K HDD Specs:
- Capacities (standard | secure | secure FIPS 140-2)
- 512e:
- 600GB (ST600MX0052 | ST600MX0062 | ST600MX0072)
- 300GB (ST300MX0012 | ST300MX0022 | n/a)
- 4k Native:
- 600GB (ST600MP008 | ST600MX0092 | ST600MX0102)
- 300GB (ST300MX0032 | ST300MX0042 | n/a)
- Form factor: 2.5″
- Interface: SAS 12Gb/s
- Encryption: None, Standard Encryption, or FIPS
- NAND Flash type: eMLC
- NAND Flash size: 32GB
- RPM: 15,000K
- MTBF/ARF: 2-million/0.44%
- Power:
- Typical operating (A) +5V/+12V:
- 600GB: 0.44/0.54
- 300GB: 0.46/0.51
- Average Idle Power (W):
- 600GB: 5.3
- 300GB: 4.8
- Average Operating Power (W)
- 600GB: 8.7
- 300GB: 8.4
- Typical operating (A) +5V/+12V:
- Environmental:
- Ambient Temperature, Operating (C°): 5 to 55
- Ambient Temperature, Non-operating (C°): -40 to 70
- Temperature Change Rate/Hr, Max (°C): 20
- Relative Humidity, Noncondensing (max gradient 20%/hour): 5% to 95%
- Shock, Max Operating: 11ms (Gs): 40
- Shock, Max Non-operating: 2ms (Gs): 400
- Vibration, Operating: <400Hz (Gs): 0.5
- Vibration, Non-operating: <500Hz (Gs): 2.4
- Warranty: 5-year limited
Design and Build
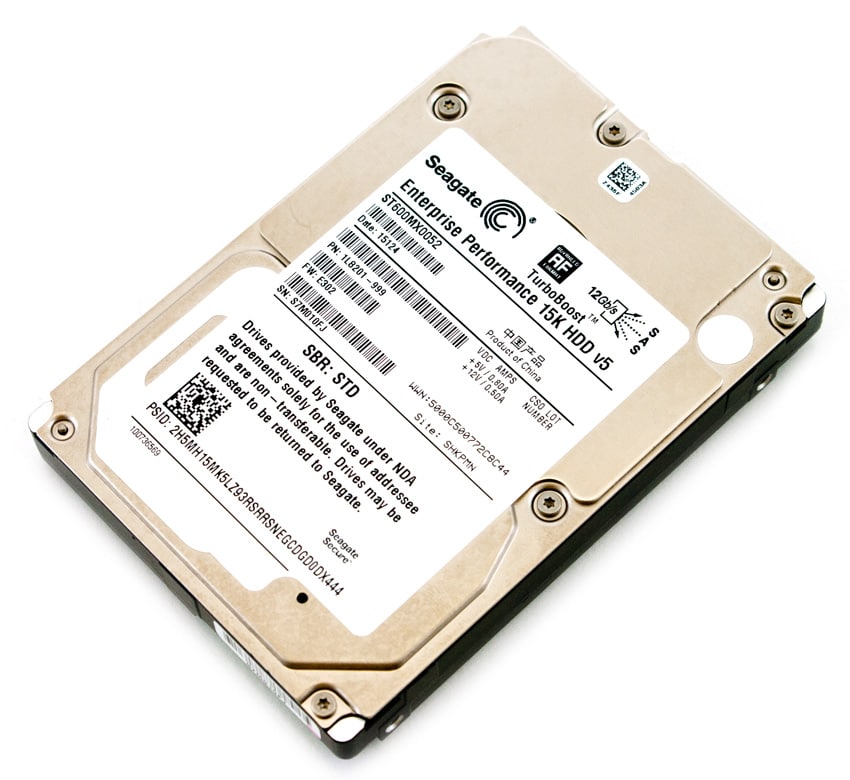
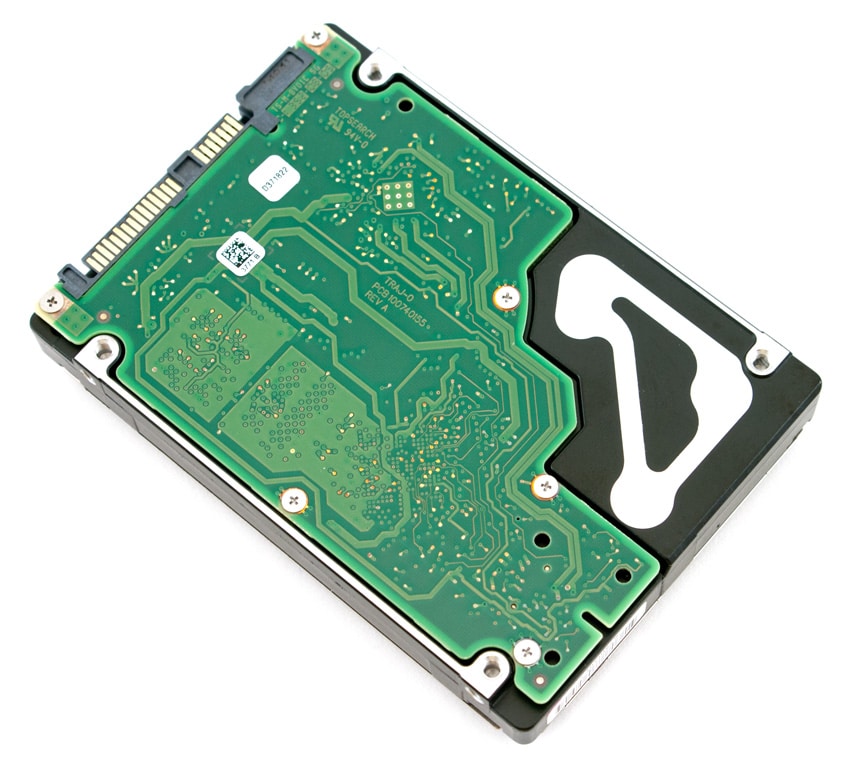
The Seagate Enterprise Performance 15k HDD is a 2.5″ form factor drive with a height of 15mm. The drive’s design continues in the footsteps of its predecessors offering a near-identical appearance to the Seagate SSHD. The top features the product information label with the related specs such as capacity and interface. The sides of the drive provide four screw holes for simple mounting. The bottom of the drive is mostly black with the circuit board exposed.
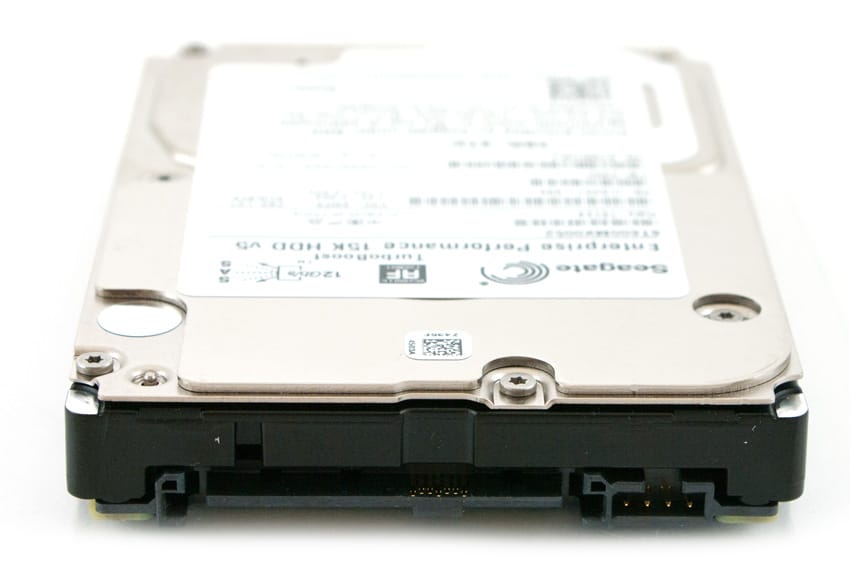
The front of the drive features a traditional SAS interface.
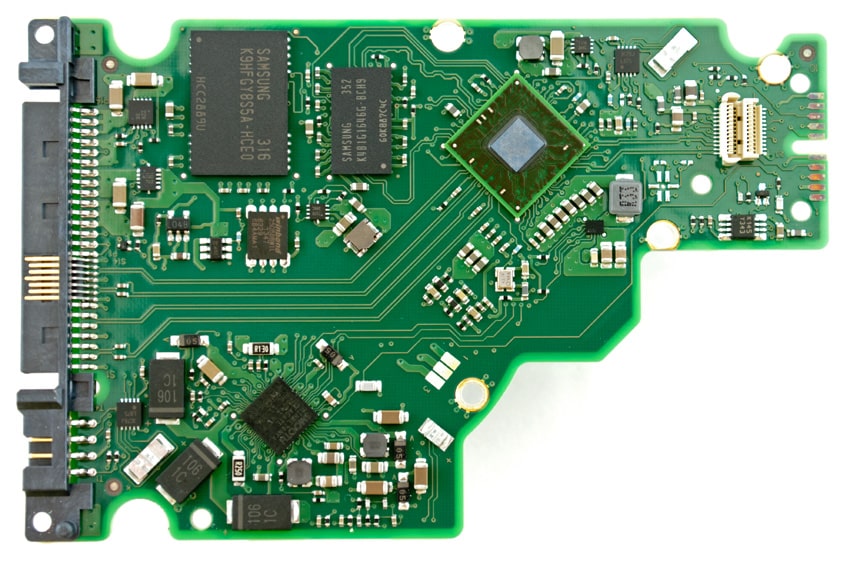
Inside the Seagate 15k with TurboBoost, the primary controller is a Marvell-chipset with the large 32GB Samsung eMLC NAND package visible.
Testing Background and Comparables
SAS Enterprise HDD comparables for this review:
We are testing the drives on the Dot Hill AssuredSAN 4824.
Application Performance Analysis
In the enterprise market, there is a huge difference between how products claim to perform on paper and how they perform in a live production environment. We understand the importance of evaluating storage as a component of larger systems, most importantly how responsive storage is when interacting with key enterprise applications. To this end, we’ve rolled out application tests including our proprietary MySQL performance via SysBench, SQL Server performance via Benchmark Factory as well as VMmark virtualization performance by VMware.
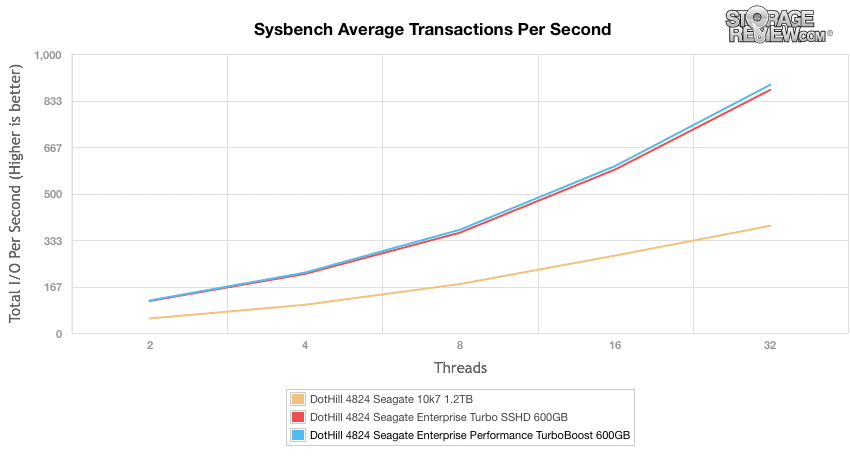
The Percona MySQL database test via SysBench application test measures the performance of OLTP activity. In this testing configuration, we use a group of Lenovo ThinkServer RD630s and load a database environment onto a single SATA, SAS or PCIe drive or a group of HDDs using an LSI 9286-8e RAID card. This test measures average TPS (Transactions Per Second), average latency, as well as average 99th percentile latency over a range of 2 to 32 threads. Percona and MariaDB are using the Fusion-io flash-aware application APIs in the most recent releases of their databases, although for the purposes of this comparison we test each device in their “legacy” block-storage modes.
In our average transactions per second benchmark, the Seagate Enterprise Performance 15k HDD started out in the top spot and managed to maintain its lead throughout finishing with 890.01 TPS. It narrowly beat out its SSHD cousin throughout the entirety of the test.
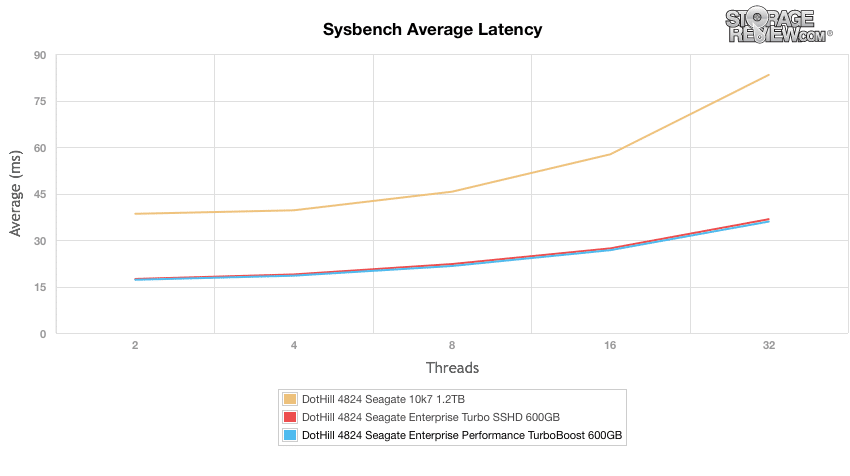
Measuring average latency in our Sysbench MySQL test told a similar story, with the 15k with TurboBoost narrowly beating out the SSHD every step of the way to come out on top again.
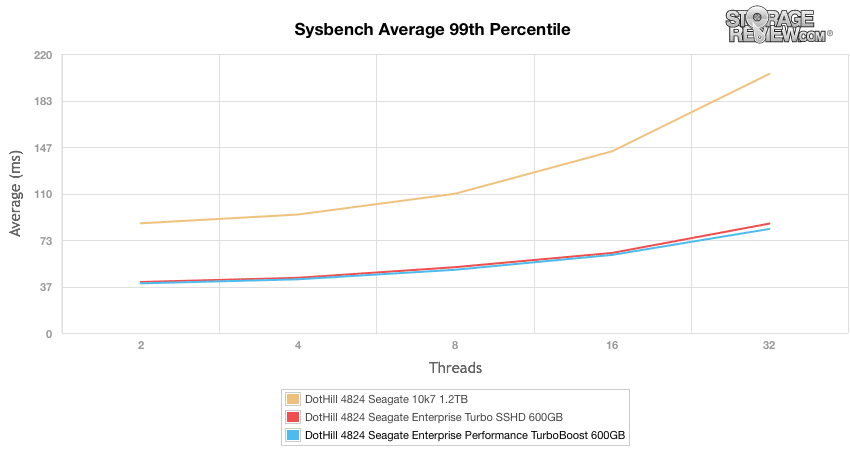
In terms of our worst-case MySQL latency scenario (99th percentile latency), the 15k with TurboBoost repeated its performance by beating the SSHD by a hair every step of the way.
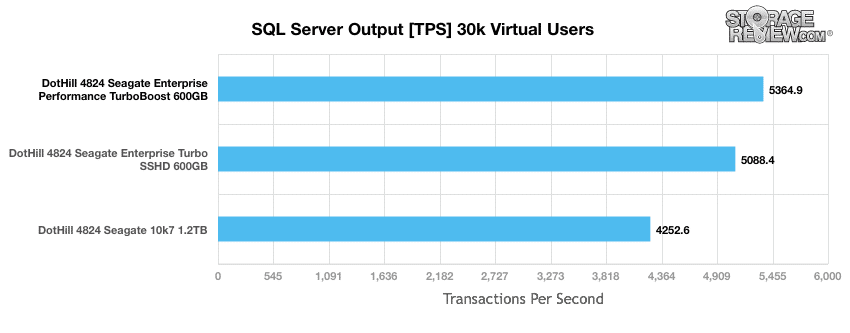
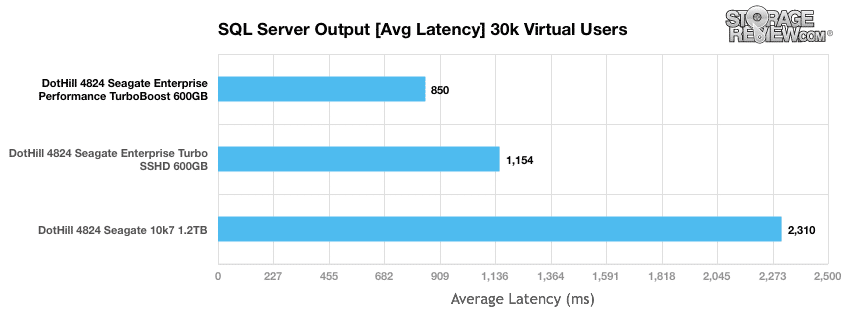
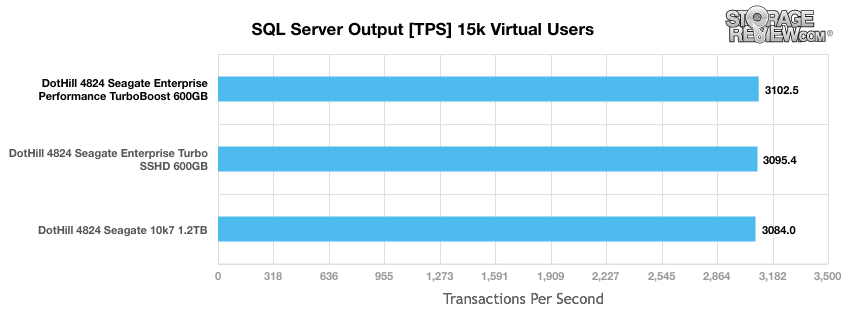
Our next database test covers performance in Microsoft’s SQL Server environment that leverages a 685GB (3,000 scale) SQL Server database and measures the transactional performance and latency with a 30,000 VU Load. We also include results from a smaller 333GB (1,500 scale) SQL Server database to better size the cache to the workload.
As with the Sysbench test, the results were very similar as far as placement in performance. The 15k with TurboBoost came out in top place in transactions per second with a score of 5364.9 TPS about 300 TPS better than the SSHD.
Looking at latency, the 15k with TurboBoost had the overall lowest latency at 850ms.
Moving to a smaller database size the results overall are much closer. Though the results were all within 20 TPS of each other the 15k with TurboBoost again came out on top with 3,102.4 TPS just about 7 TPS higher than the SSHD.
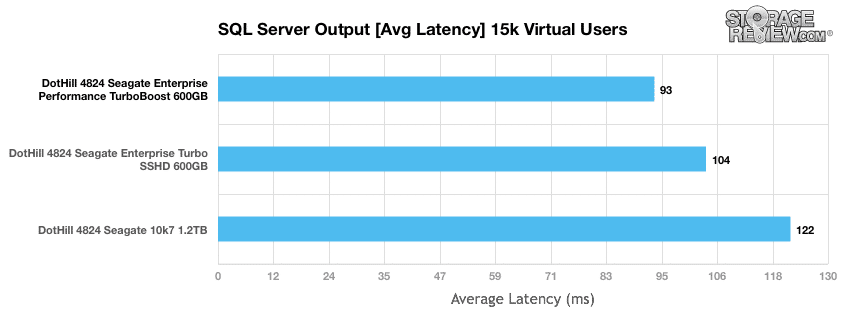
The latency was also close, within 30ms of each other, but it is a little more clear here that the 15k with TurboBoost was the top performer at 93ms.
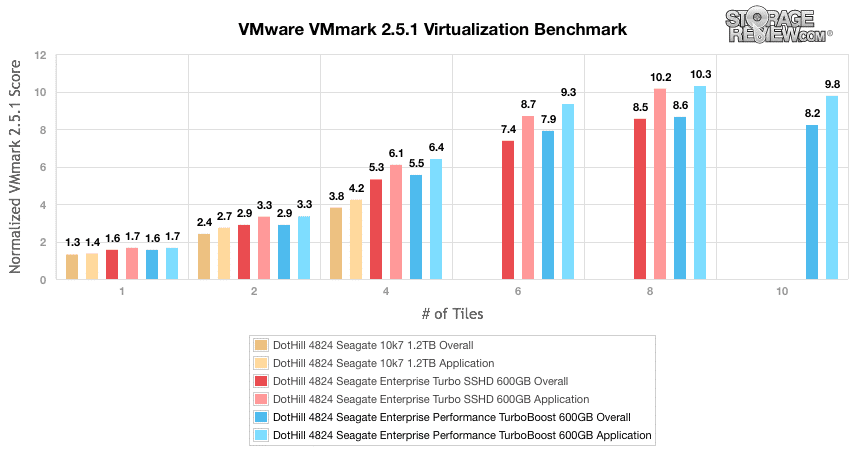
Our VMmark protocol utilizes an array of sub-tests based on common virtualization workloads and administrative tasks with results measured using a tile-based unit that corresponds to the ability of the system to perform a variety of virtual workloads such as cloning and deploying of VMs, automatic VM load balancing across a datacenter, VM live migration (vMotion) and dynamic datastore relocation (storage vMotion).
Comparing the normalized VMmark 2.5.1 performance, the Seagate 15k with TurboBoost was able to extend up to a load of 10-tiles, whereas the Seagate Savvio 10K.7’s topped out at 2-tiles and the Seagate SSHD topped out at 4-tiles. From the loads ran, the 15k with TurboBoost had an edge in performance.
Enterprise Synthetic Workload Analysis
Prior to initiating each of the fio synthetic benchmarks, our lab preconditions the device into steady-state under a heavy load of 16 threads with an outstanding queue of 16 per thread. Then the storage is tested in set intervals with multiple thread/queue depth profiles to show performance under light and heavy usage.Preconditioning and Primary Steady-State Tests:
- Throughput (Read+Write IOPS Aggregate)
- Average Latency (Read+Write Latency Averaged Together)
- Max Latency (Peak Read or Write Latency)
- Latency Standard Deviation (Read+Write Standard Deviation Averaged Together)
Our condensed Enterprise Synthetic Workload Analysis includes one profiles designed to show peak random I/O from each device. This profile is designed to be used as a baseline comparable to cross-reference manufacturer claims of random transfer speeds.
- 4k
- 100% Read or 100% Write
- 100% 4k
- 8k (Sequential)
- 100% Read or 100% Write
- 100% 8k
- 8K 70/30
- 70% Read, 30% Write
- 100% 8K
- 128K (Sequential)
- 100% Read or 100% Write
- 100% 128K
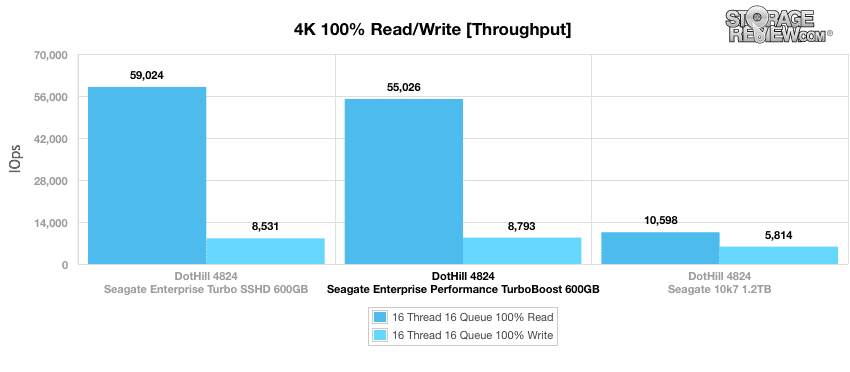
In our 100% 4K random read and write test, measuring the performance across the full LBA spectrum of the Seagate 15k with TurboBoost fell slightly behind the SSHD in read performance. The 15k with TurboBoost had a read performance of 55,026 IOPS whereas the SSHD had a read performance of 59,024 IOPS. However the 15k with TurboBoost took the top spot in write performance with 8,793 IOPS just edging out the SSHD.
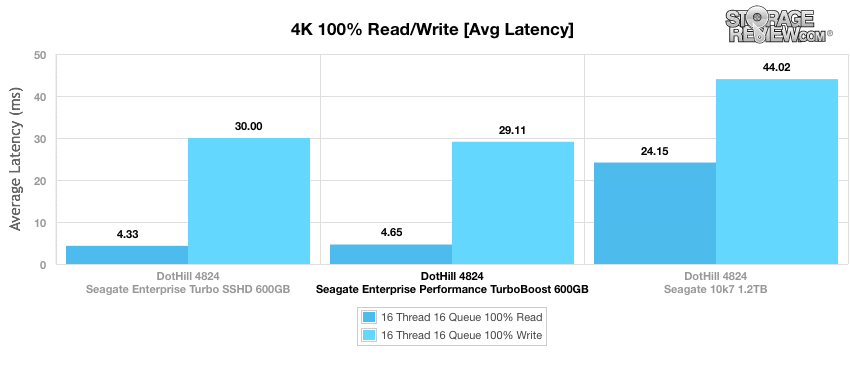
Looking at average latency we see similar results to the above, the SSHD again had the best read speed at 4.33ms to the 15k’s 4.65ms, and the 15k with TurboBoost had the best write speed at 29.11ms to the SSHD’s 30ms.
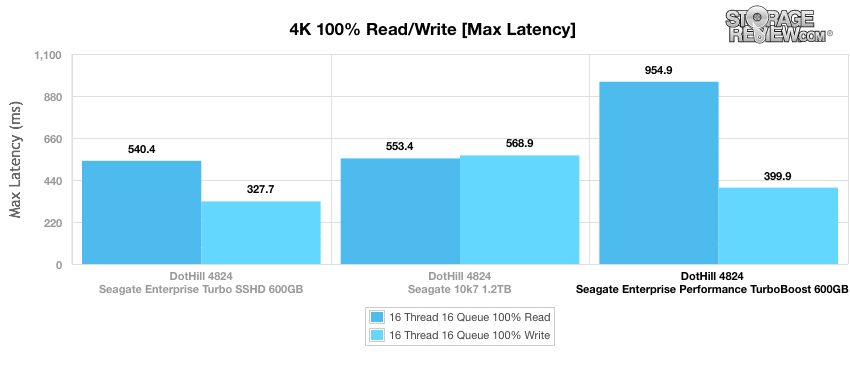
With max latency, this is the first time we ever see the 15k with TurboBoost fall to the bottom of the pack with a read speed of 954.9ms, and it came in behind the SSHD in write speeds with a latency of 399.9ms.
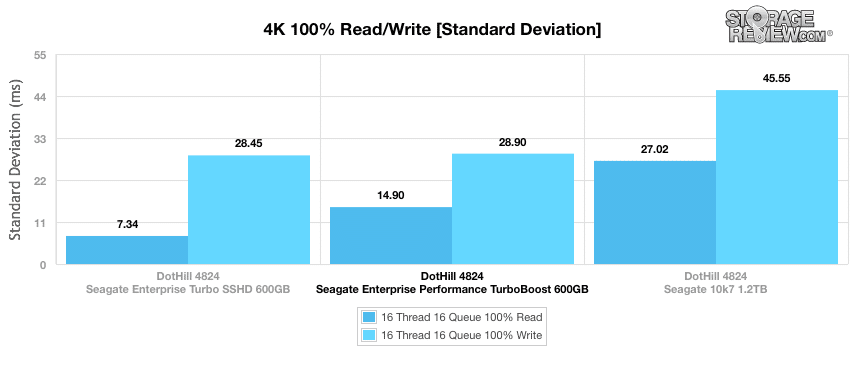
Standard deviation showed better performance for the 15k with TurboBoost where it landing in the middle of the Seagate drives with a read speed of 14.9ms and a write speed of 28.9ms. The SSHD came out on top once again.
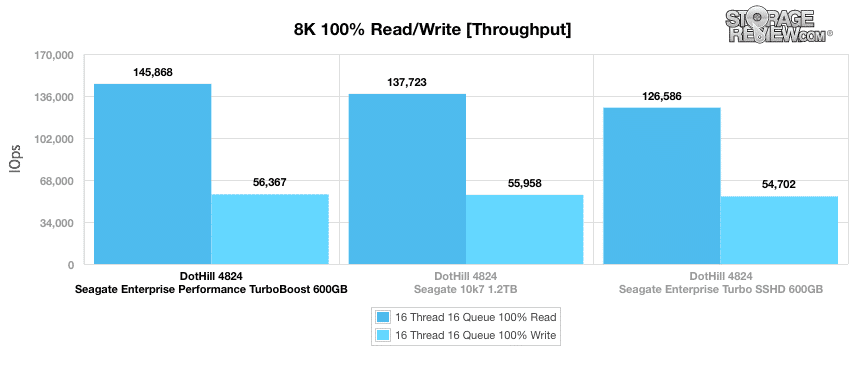
The next test again puts the drives under 100% read/write activity, this time at 8K sequential throughput. The 15k with TurboBoost once again took the top spot with a read performance of 145,868 IOPS and a write performance of 56,367 IOPS, though write performance throughout was fairly close.
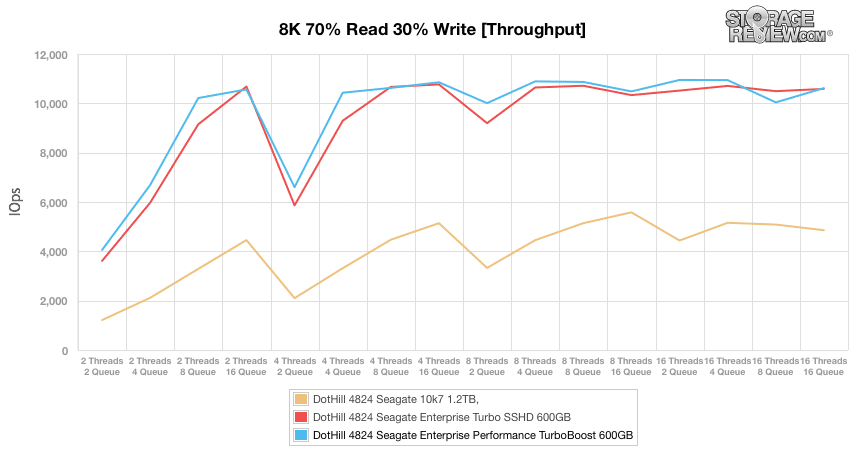
Compared to the fixed 16 thread, 16 queue max workload we performed in the 100% 4k write test, our mixed workload profiles scale the performance across a wide range of thread/queue combinations. In these tests, we span workload intensity from 2 threads and 2 queue up to 16 threads and 16 queue. In throughput, the 15k with TurboBoost and the SSHD run fairly close but the 15k with TurboBoost managed to take the lead for a majority of the test and peaked at 10,948 IOPS.
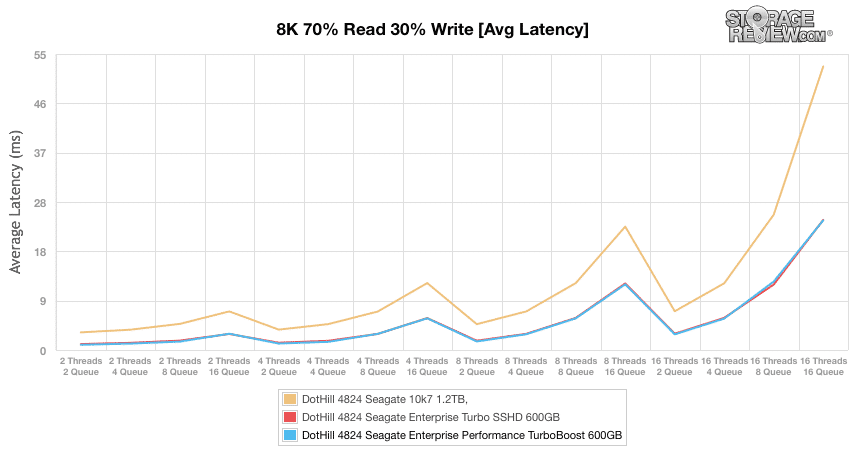
In our average latency benchmark, we once again see the SSHD and the 15k with urbo slugging it out for the top spot only this time they run much closer throughout the entirety of the test. However, the 15k with TurboBoost did maintain a very slight lead for most of the test.
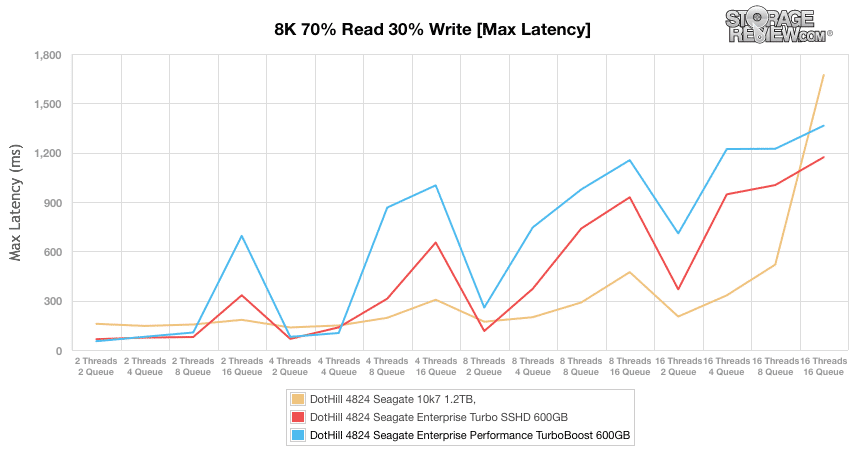
Looking at max latency, the 15k with TurboBoost falls to the bottom of the pack once again. Both of the hybrid drives showed a fairly inconsistent performance. The 10k7 drive performed at the lowest latency before spiking up in the terminal queue.
Standard deviation again showed the 15k with TurboBoost to have the weakest performance however it was not as inconsistent as the max latency.

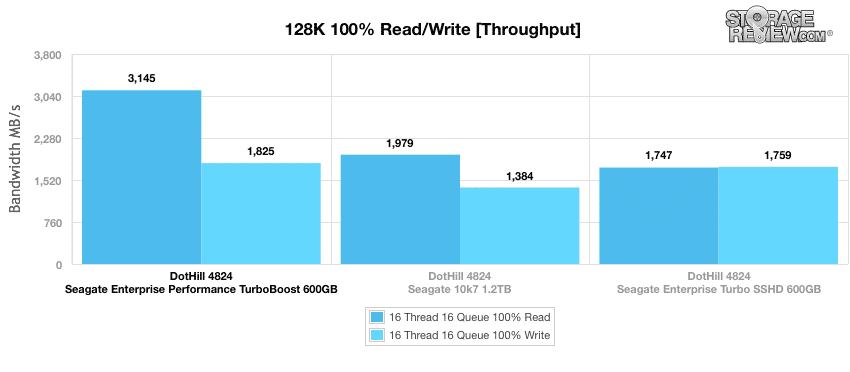
Our Enterprise Synthetic Workload 128K test is a large block sequential test that shows the highest sequential transfer speed for a platter drive. When looking at 128K performance of 100% write and 100% read activity, the 15k with TurboBoost showed the overall best performance once again with read speeds of 3.15GB/s and write speeds of 1.83GB/s.
Conclusion
The Seagate Enterprise Performance 15k HDD is a 2.5” 15K HDD with a 12Gb/s SAS interface. The drive comes with Seagate’s TurboBoost, which adds 32GB of eMLC NAND as well as a 128MB cache to increase performance. The drives are aimed at high-performance applications such as servers that host hot data and creating blade, rack, and tower servers to host transaction-based applications. The drives come in 300GB and 600GB capacities and have a 5-year warranty.
Looking at performance, the Seagate Enterprise Performance 15k HDD performed pretty well compared to its Seagate brothers, including outperforming its older hybrid counterpart, the turbo SSHD. The 15k with TurboBoost did extremely well in the application tests coming out on top in every test, though the SSHD was right on its heels. It also was about to load up to 10-tiles in our VMmark test, where the other drives topped out at 4-tiles and 2-tiles.
In our synthetic workloads, the Seagate Enterprise Performance 15k HDD performed really well coming out in the top spot in many tests. In our 4k benchmarks, the 15k with TurboBoost took the top spot in write performance in throughput with 8,793 IOPS and top write average latency with 29.11ms. In 8k 100% read/write throughput, the drive took the top spot in both read and write with throughput performances of 145,868 IOPS read and 56,367 IOPS write. And it showed us speeds of 3.15GB/s read and 1.83GB/s write in out large block sequential test.
Seagate has done a good job of bridging the gap with these latest flash-cache-enabled drives. While certainly not as fast as SSDs in aggregate, TurboBoost does provide a very noticeable performance boost over standard HDDs and the SAS interface makes it more capable than the low-cost SATA SSDs that compete on dollar/GB. Granted, it’s a matter of time before flash takes over the high-performance segment these drives address, but in the interim, Seagate has another product that performs well for markets that still want the cost or benefits of a hard drive or need to rely on disks for other reasons.
Pros
- Double the capacity of previous generations
- Top performer in most tests
- Small 2.5” form factor with SAS interface
Cons
- Has double the capacity of previous generations, but still is only 600GB
The Bottom Line
The Seagate Enterprise Performance 15k HDD delivers higher performance than Seagate’s previous hybrid drives. This performance makes it a good fit in Tier-1 deployments who benefit from the drive’s capabilities and economics.
Seagate ST600MX0052 at AmazonDiscuss this review


 Amazon