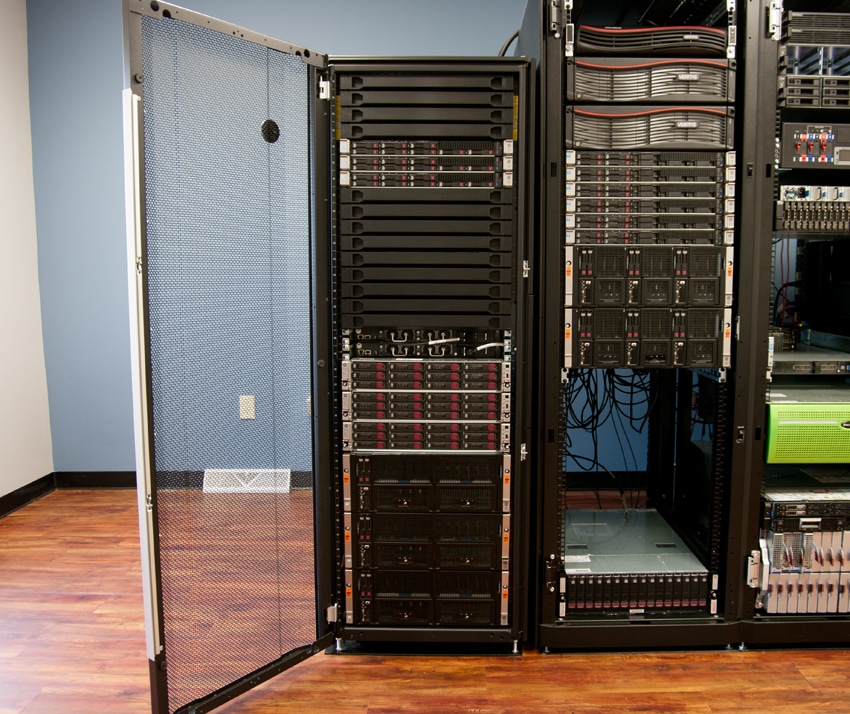
SUSE Enterprise Storage is a software-defined storage solution powered by Ceph designed to help enterprises manage the ever-growing data sets. Further, SUSE aims to help by taking advantage of favorable storage economics as hard drives continue to get larger and flash prices continue to fall. While typically configured as a hybrid, Ceph is ultimately as flexible as the customer's demand it to be. While much of the software-defined gusto these days is focused on primary storage and hyperconverged offerings, Ceph is helping to fuel significant hardware development as well. HP, Dell, Supermicro and others have all invested heavily in dense 3.5" chassis with multiple compute nodes in an effort to provide the underlying hardware platforms Ceph requires. In the case of this particular review, we leveraged HPE gear including ProLiant servers and Apollo chassis, but SUSE Enterprise Storage can be deployed on just about anything.
While it's beyond the scope of this review to do a deep dive into Ceph, it's important to have a basic understanding on what Ceph is. Ceph is a software storage platform that is unique in its ability to deliver object, block, and file storage in one unified system. Another attractive feature of Ceph is that it is highly scalable, and by highly, up to exabytes of data. It can run on commodity hardware (meaning nothing special is needed). Ceph is designed to avoid single points of failure. And something that is of interesting to everyone, Ceph is freely available.
Users can set up a Ceph node on commodity hardware that uses several intelligent daemons, four in particular: Cluster monitors (ceph-mon), Metadata servers (ceph-mds), Object storage devices (ceph-osd), and Representational state transfer (RESTful) gateways (ceph-rgw). To better protect user data and make it fault-tolerant, Ceph replicates data and stripes it across multiple nodes for higher throughput.
SUSE Enterprise Storage is using Ceph as very large, cost-effective bulk storage for multiple kinds of data. Data is only going to grow and Big Data is highly valuable but takes up massive amounts of capacity. Big Data can give companies insights that can be tremendously valuable to their bottom line, but in order to analyze this data they need somewhere to store it in the meantime. Aside from being able to store massive amounts of data in a cost-effective manner, SUSE Enterprise Storage is also highly adaptable. Being self-managing and self-healing, the software is ideal to quickly adapt to changes in demands. Meaning, admins can quickly adjust performance and provision additional storage without disruption. The adaptability helps give flexibility to commodity hardware that is used with SUSE Enterprise Storage.
SUSE Enterprise Storage Features
- Cache tiering
- Thin provisioning
- Copy-on-write clones
- Erasure coding
- Heterogeneous OS block access (iSCSI)
- Unified object, block and file system access (technical preview)
- APIs for programmatic access
- OpenStack integration
- Online scalability of nodes or capacity
- Online software updates
- Data-at-rest encryption
SUSE Enterprise Storage Hardware Configuration
Monitor nodes keep track of cluster state, but do not sit in the data path. In our case the three monitor nodes are the 1U HPE ProLiant DL360 servers. For most SUSE Enterprise Storage clusters, a trio of monitoring nodes is sufficient, though an enterprise may deploy five or more if there are a very large number of storage nodes.
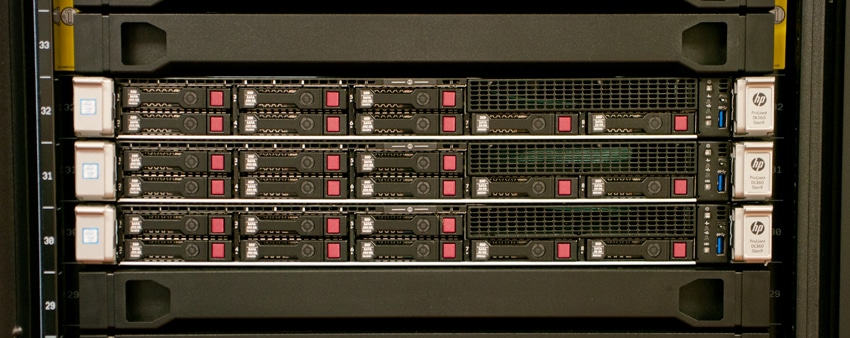
SUSE storage nodes scale horizontally and are comprised of three HPE Apollo 4200 nodes and three HPE Apollo 4510 nodes. Data is being written in triplicate across the storage nodes in our configuration, of course this can be altered based on need. Protection levels are definable at a pool level.
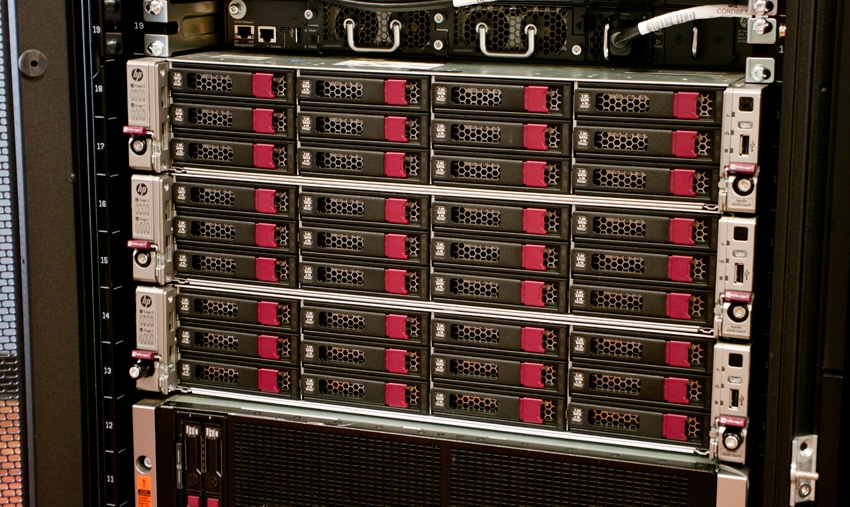
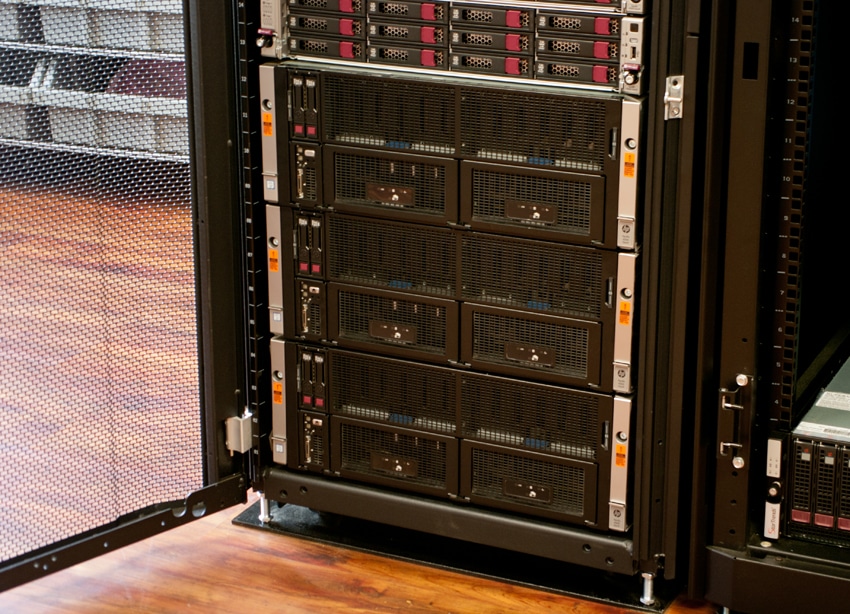
- 3x HPE Apollo 4200 nodes
- 2x Intel E5-2680 v3 processors
- 320GB RAM
- M.2 boot kit
- 4x 480GB SSD
- 24x 6TB SATA 7.2k drives
- 1x 40Gb Dual port adapter
- 3x HPE Apollo 4510 nodes
- 2x e5-2690 v3 processors
- 320GB RAM
- M.2 boot kit
- 4x 480GB SSD
- 24x 6TB SATA 7.2k drives
- 1x 40Gb Dual port adapter
- 3x HPE ProLiant DL360 nodes
- 1 E5-2660v3
- 64GB RAM
- 2x 80GB SSD
- 6x 480GB SSD
- 1x 40Gb Dual port adapter
- 2x HP FlexFabric 5930-32QSFP+ switch
- Server configuration
- SUSE Linux Enterprise Server 12 SP1 with SUSE Enterprise Storage
- OSDs deployed with a 6:1 ratio of HDD to SSD for journal devices
- The HPE Apollo 4200s and 4510s participate together in a single storage cluster for a total of 144 storage devices
- The DL360s act in the admin, monitor and Romana GUI roles
- iSCSI gateway services are deployed on all 6 storage nodes
SUSE Enterprise Storage Management
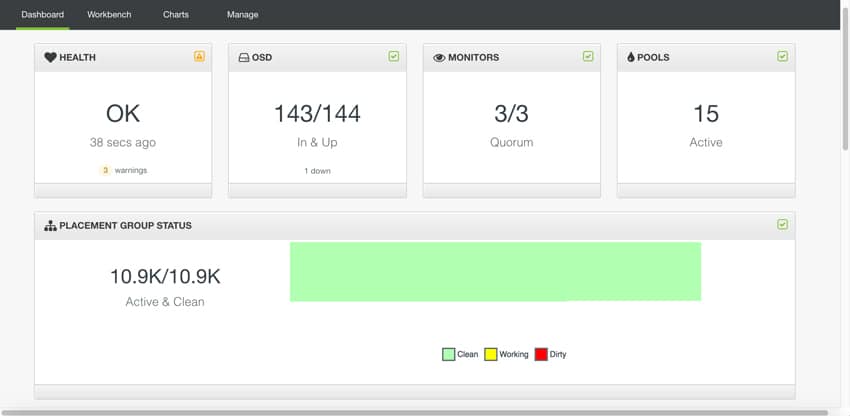
Most of the SUSE enterprise storage is managed through CLI though there is also a web-based GUI. Currently SUSE is using Calamari for its GUI, though that may change going forward. Once users have setup Calamari and open they get a look into what one normally expects from a GUI. The main page has four main tabs that run across the top including: Dashboard, Workbench, Charts, and Manage. The Dashboard tab (the one the default opens) shows the health of the system along with any currently active warnings. The total number of OSDs in the cluster is shown with the total amount up and down also indicated. The number of monitor (total/and what is running) is shown. And the total amount of pools is indicated. Beneath these are the placement group status including the active and clean numbers as well as a color code system showing users which are clean (green), working (yellow), and dirty (red).
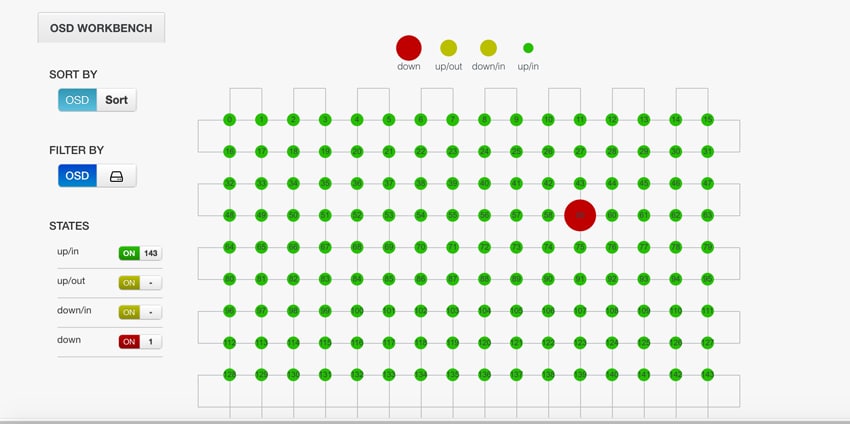
The Workbench tab gives users a graphic representation of the amount of OSDs and which are running properly and which are down. From the graphic one can see that while most are running correctly indicated by a green color there is one down that is highlighted in red and is slightly larger. On the left hand side users can sort and filter by OSD.
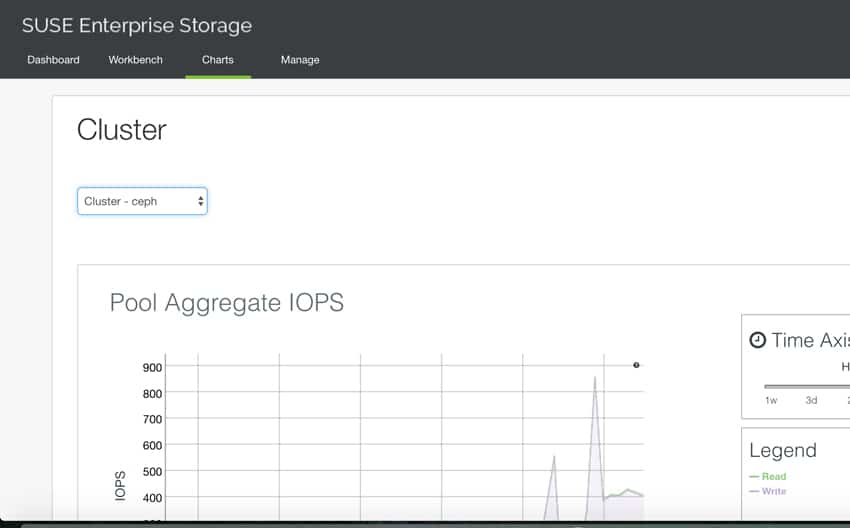
Through the Workbench tab users can also get a graphical representation of the performance of their storage. In the example below, users can see their read + write IOPS, the utilization of their storage, and the number of hosts reporting.

With the Charts tab, users can select a cluster and get a broken line graph that shows that clusters performance, showing both read and write.
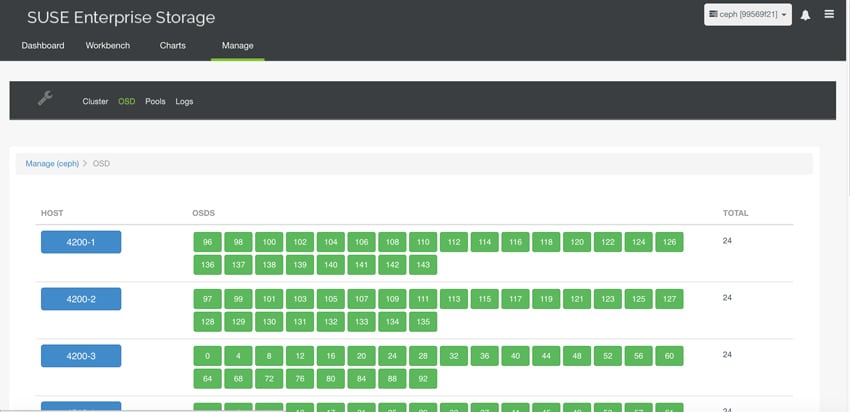
The Manage tab allows users to edit Clusters, OSD, Pools, and view Logs. Under the OSD sub tab users can see the hosts listed down the left hand side and what OSDs are in each host. Users can move the OSD to balance out the load.
Enterprise Synthetic Workload Analysis
Storage performance varies as the array becomes conditioned to its workload, meaning that storage devices must be preconditioned before each of the fio synthetic benchmarks in order to ensure that the benchmarks are accurate. In each test we precondition the group with the same workload applied in the primary test. For testing, we ran SUSE Enterprise with a stock, un-tuned configuration. In the future SUSE testing may be ran with specific OS and Ceph tuning.
Preconditioning and Primary Steady-State Tests:
- Throughput (Read+Write IOPS Aggregate)
- Average Latency (Read+Write Latency Averaged Together)
- Max Latency (Peak Read or Write Latency)
- Latency Standard Deviation (Read+Write Standard Deviation Averaged Together)
Dell PowerEdge LoadGen Specifications
- Dell PowerEdge R730 Servers (2-4)
- CPUs: Dual Intel Xeon E5-2690 v3 2.6GHz (12C/28T)
- Memory: 128GB DDR4 RDIMM Each
- Networking: Mellanox ConnectX-3 40GbE
With the SUSE Enterprise Storage cluster being geared towards large sequential transfers, we included one random workload test, while focusing three sequential transfer tests on the cluster in ever-increasing transfer sizes. Each workload was applied with 10 threads and an outstanding queue depth of 16. Random workloads were applied with 2 clients, with results combined for an aggregate score, while sequential results were measured with 2 and 4 clients. Each client linked to block devices in the CEPH cluster through the RBD (RADOS Block Devices) protocol.
Workload Profiles
- 4k Random
- 100% Read and 100% Write
- 8k Sequential
- 100% Read and 100% Write
- 128k Sequential
- 100% Read and 100% Write
- 1024k Sequential
- 100% Read and 100% Write
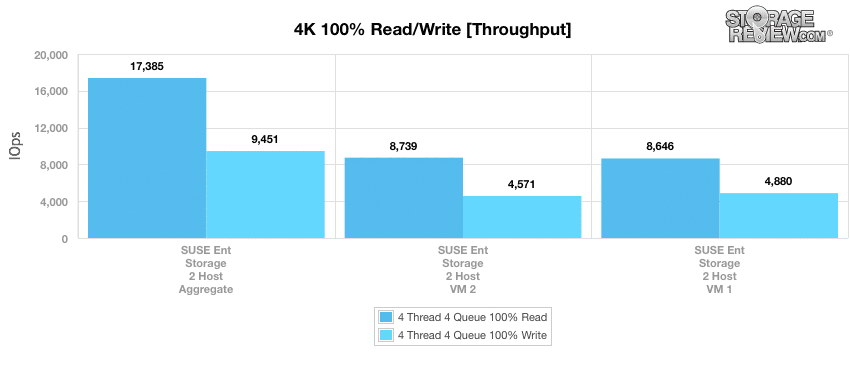
In our random 4k synthetic benchmark, the SUSE Enterprise Storage (referred to as SUSE for brevity from here on out) was able to hit read throughput of 8,739 and 8,646 IOPS with individual hosts with an aggregate read score of 17,385 IOPS. On the write throughput, individual hosts hit 4,571 and 4,880 IOPS with an aggregate score of 9,451 IOPS.
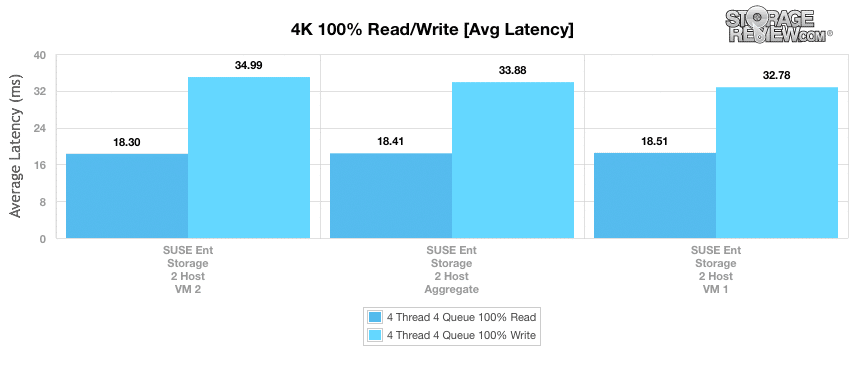
Looking at average latency, both hosts, and thus the average between them, were very close in both read and write. On the read side the individual hosts had latencies of 18.3ms and 18.51ms with an aggregate of 18.41ms. With writes the individual hosts had 34.99ms and 32.78ms with an aggregate 33.88ms.
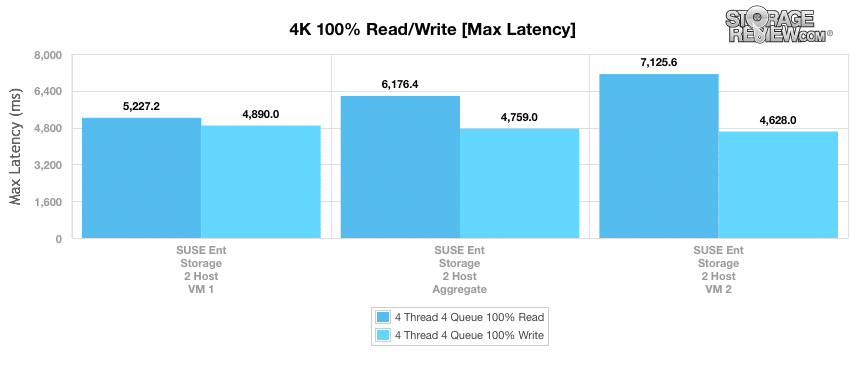
Max latency showed fairly consistent score in write with 4,890ms and 4,628ms for individual hosts and an aggregate of 4,759ms. With read latency there was a much larger discrepancy between the individual hosts with latencies ranging from 5,227.2ms to 7,125.6ms giving us an aggregate score of 6,176.4ms.
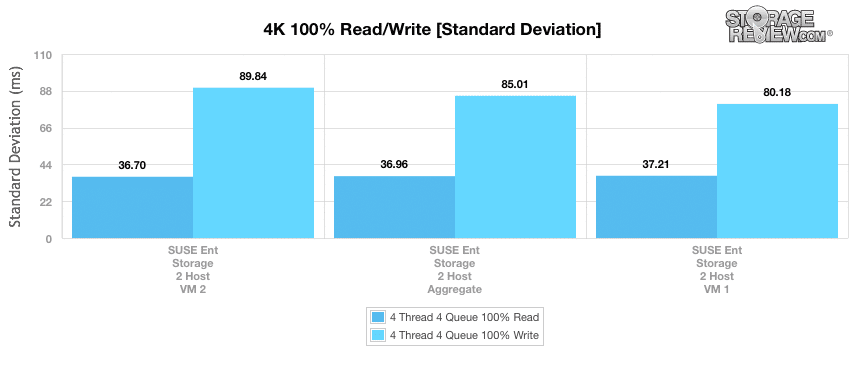
Standard deviation once again saw latency pull in much closer once again. The individual hosts gave read latencies of 36.7ms and 37.21ms with an aggregate of 36.96ms. Write latencies ran from 80.18ms to 89.84ms with an aggregate score of 85.01ms.
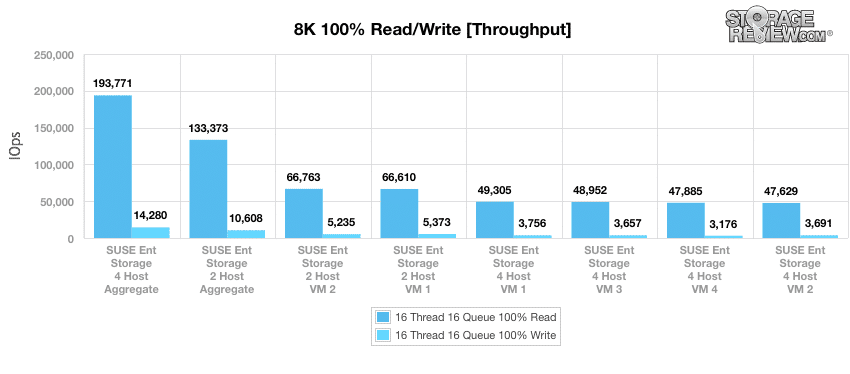
From here we switch over to sequential tests, the first being our 8k. Here we look at two sets of tests (SUSE 2 and SUSE 4) with two hosts in SUSE 2 and four hosts in SUSE 4 with aggregate scores for each set. SUSE 2 gave us read throughputs of 66,610 and 66,763 IOPS and write throughputs of 5,235 and 5,375 IOPS. For the SUSE with two hosts we have aggregate scores of 133,373 IOPS read and 10,608 IOPS write. The SUSE with 4 hosts gave us read throughputs ranging from 47,629 to 49,305 IOPS and write throughputs ranging from 3,176 to 3,756 IOPS with aggregate scores of 193,771 IOPS read and 14,280 IOPS write.
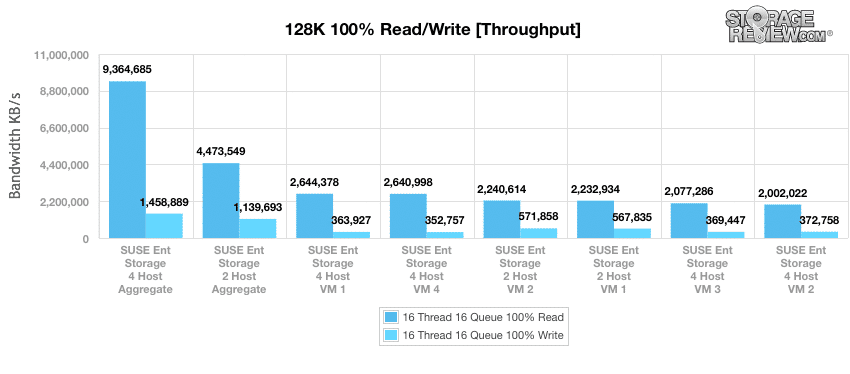
Switching to a large block 128k sequential test, the SUSE with two hosts gave us read throughputs of 2.32GB/s and 2.34GB/s with a read aggregate score of 4.47GB/s. The two host system gave us write throughputs of 568MB/s and 572MB/s with a write aggregate score of 1.459GB/s. The SUSE with four hosts gave us read throughputs ranging from 2GB/s to 2.644GB/s with a read aggregate score of 9.365GB/s. Looking at write throughputs, the SUSE with 4 hosts gave us throughputs ranging from 353MB/s to 373MB/s with a write aggregate score of 1.46GB/s
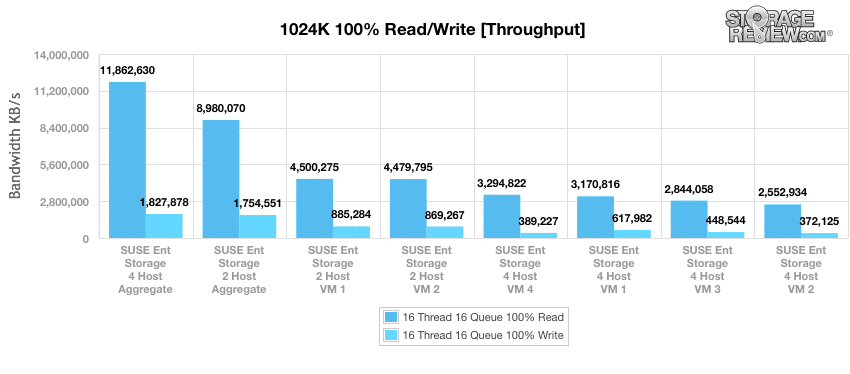
Switching to an even larger block 1,024k sequential test, the SUSE with two hosts gave us read throughputs of 4.48GB/s and 4.5GB/s with an aggregate of 8.98GB/s. With write throughputs, the SUSE with two hosts gave us throughputs of 869MB/s and 885MB/s with a write throughput aggregate of 1.755GB/s. The four hosts system gave us read throughputs ranging 2.553GB/s to 3.295GB/s with a read aggregate throughput of 11.863GB/s. With write throughputs, the four hosts SUSE gave us throughputs ranging from 372MB/s to 618MB/s with a write aggregate score of 1.828GB/s.
Conclusion
SUSE Enterprise Storage is a Ceph powered SDS Solution designed the to help companies that are struggling with the ever growing data sets. SUSE uses Ceph as bulk storage for all types of data, which is beneficial as Big Data gets generated in multiple forms. The flexibility of Ceph is also a plus as it can be deployed on more or less anything, meaning companies can leverage SUSE Enterprise Storage with Ceph on existing investments (for our review we used HPE ProLiant servers and Apollo chassis). Flexibility is a selling point, but SUSE Enterprise Storage is also highly adaptable, self-managing, and self-healing. In other words, admins using SUSE Enterprise Storage will be able to quickly make changes to performance and provision more storage without disruption.
On the performance side of things, we ran a stock or un-tuned configuration. With Ceph there are tons of variations that can be configured. Instead of tuning the OS or Ceph, the results we see are stock helping to set a baseline on performance. SUSE Enterprise Storage is geared more for large sequential transfers so more of our tests lean this way. If a user has a SUSE Enterprise Storage cluster they will more than likely being using it for large sequential and thus will be more interested in those results. That being said, we did still run 4k random tests to give an overall idea how the system runs even when it is presented with something it is not necessarily geared for.
In our 4k random tests, we ran two clients, referred to as Host 1 and Host 2 in the charts. We looked at the scores of each as well as the combined or aggregate score. For throughput the SUSE Enterprise Storage gave us an aggregate read score of 17,385 IOPS and an aggregate write score of 9,451 IOPS. With 4k latencies, the SUSE Enterprise Storage gave us an aggregate average latencies of 18.41ms read and 33.88ms write, aggregate max latencies of 6,176.4ms read and 4,759ms write, and aggregate standard deviation of 36.96ms read and 85.01ms write.
Larger sequential tests were done with 4 hosts with either 2 or 4 clients as well as the aggregate scores for each of the 2 and 4 clients. We tested sequential performance using 8k, 128k, and 1024k. Unsurprisingly in each test the aggregate 4 client host of the overall best performer. In 8k the SUSE Enterprise Storage gave us high aggregate scores of 193,771 IOPS read and 14,280 IOPS write. In our 128k benchmark the high aggregate score was 9.365GB/s read and 1.459BG/s write. And in our final large block sequential benchmark of 1024k, the SUSE Enterprise Storage gave us a high aggregate score of 11.863GB/s read and 1.828GB/s write.
Pros
- Highly scalable solution for expanding data sets
- Software-defined means flexibility in deployment
- Offers traditional connectivity support such as iSCSI
- Can be tuned for specific workloads and exact needs
Cons
- Radom IO support could be improved to broaden usecases
- Requires strong Linux-based skill set for deployment and management
Bottom Line
SUSE Enterprise Storage provides ample scale, flexibility, and a high level of adaptability for companies looking to store and leverage Big Data.


 Amazon