

After looking at the performance levels of the VMware VSAN cluster with a traditional Sysbench OLTP workload, we wanted to find out how well the platform responds with an increased workload for more demanding use cases. The initial deployment was four Sysbench VMs, 1 per node, but that workload didn't bring the disk I/O to a high enough range where we felt resources were being fully utilized. This is similar to a customer running a POC, testing it under a subset of their current workload, but not measuring how well the platform responds as workloads grow over time or as more application data is migrated over. To better understand how this VSAN cluster responds under ever-increasing MySQL workloads, we scaled the four Sysbench VM (1 per node) benchmark up to 8 and 12 total VMs.
Dell PowerEdge R730xd VMware VSAN Specifications
- Dell PowerEdge R730xd Servers (x4)
- CPUs: Eight Intel Xeon E5-2697 v3 2.6GHz (14C/28T)
- Memory: 64 x 16GB DDR4 RDIMM
- SSD: 16 x 800GB Solid State Drive SAS Mix Use MLC 12Gbps
- HDD: 80 x 1.2TB 10K RPM SAS 6Gbps
- Networking: 4 x Intel X520 DP 10Gb DA/SFP+, + I350 DP 1Gb Ethernet
- Storage Capacity: 86.46TB
Sysbench Performance
Each Sysbench VM is configured with three vDisks, one for boot (~92GB), one with the pre-built database (~447GB) and the third for the database under test (400GB). From a system resource perspective, we configured each VM with 16 vCPUs, 64GB of DRAM and leveraged the LSI Logic SAS SCSI controller.
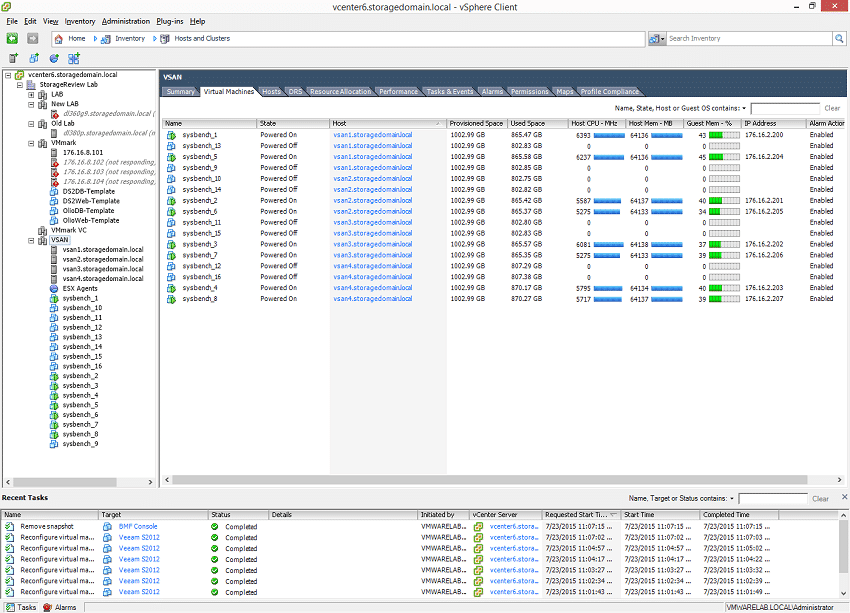
With a load of 8 VMs, we saw Sysbench VMs consume between 5,200-6,300MHz each, with total host resources indicating that about 18,000MHz was utilized. This left over a great deal of CPU resources with only 22% used per host, although at a workload of 8 Sysbench VMs we were using nearly all the available SSD cache. For storage impact we loaded 16 Sysbench VMs to enlarge the overall footprint, consuming about 14TB of the 86.46TB total VSAN storage capacity. At the time of the 8 VM workload, only 7TB of that 14TB was active however. This compares to 3.5TB in the 4 VM workload.
Sysbench Testing Configuration (per VM)
- CentOS 6.3 64-bit
- Storage Footprint: 1TB, 800GB used
- Percona XtraDB 5.5.30-rel30.1
- Database Tables: 100
- Database Size: 10,000,000
- Database Threads: 32
- RAM Buffer: 24GB
- Test Length: 12 hours
- 6 hours preconditioning 32 threads
- 1 hour 32 threads
- 1 hour 16 threads
- 1 hour 8 threads
- 1 hour 4 threads
- 1 hour 2 threads
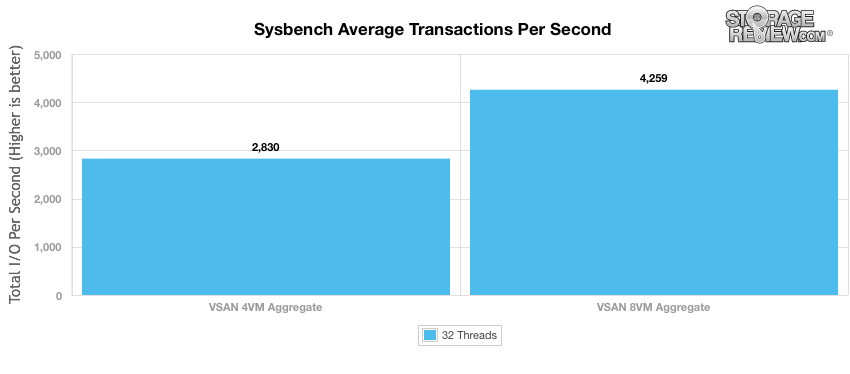
As we scaled the Sysbench OLTP workload, we measured a performance increase from 2,830 TPS in aggregate with 4 VMs, to 4,259 TPS with 8 VMs. This works out to a 50% jump in performance with the workload footprint doubling.
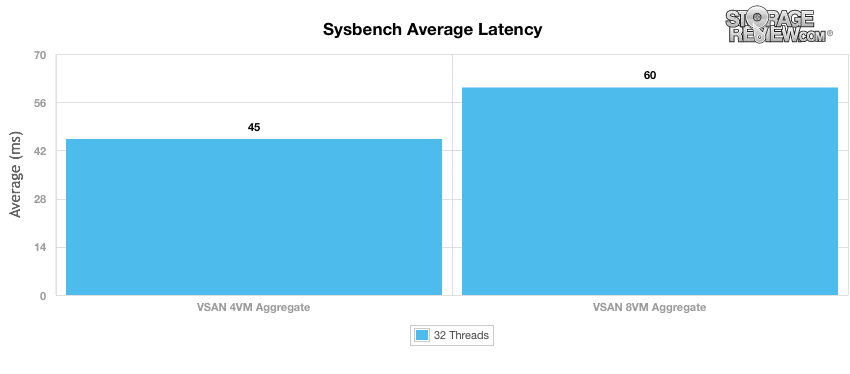
With the increased aggregate transactional performance, we measured average latency increase from 45ms to 60ms on a per-VM basis. This is about a 33% jump over the smaller workload.
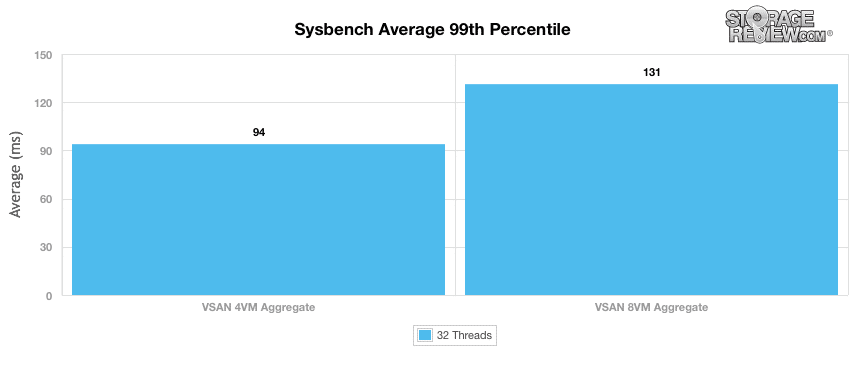
Average 99th percentile latency also increased from 94ms to 131ms as the I/O demands picked up.
While the benchmark was operating, we captured CPU, disk and networking stats from vCenter. During the 8 VM test we saw a VM-CPU spread of 5,275MHz up to 6,393MHz across the VMs.
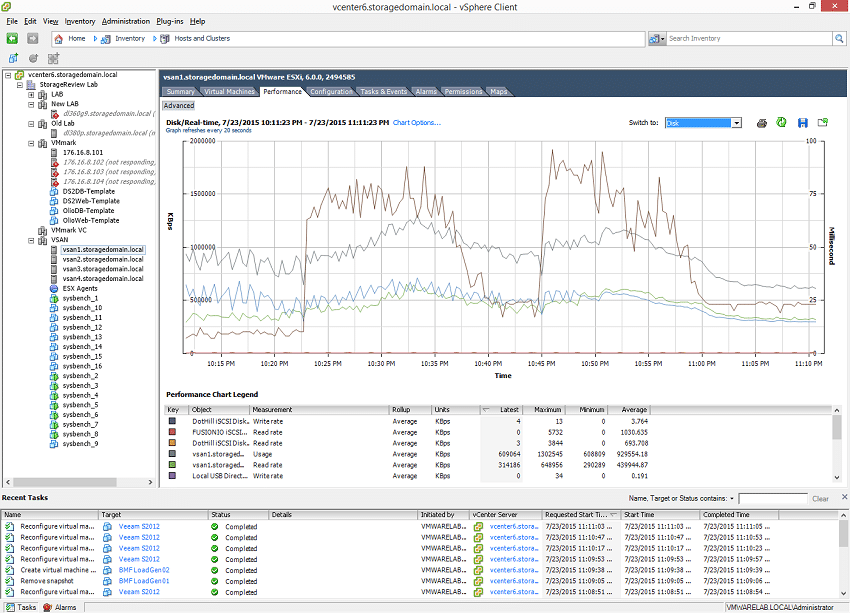
With 2 VMs active per node we saw mixed disk activity measuring a total of 609MB/s after the workload had started. The larger peaks were measured while the pre-built database was copying itself inside each VM at the start of the test.
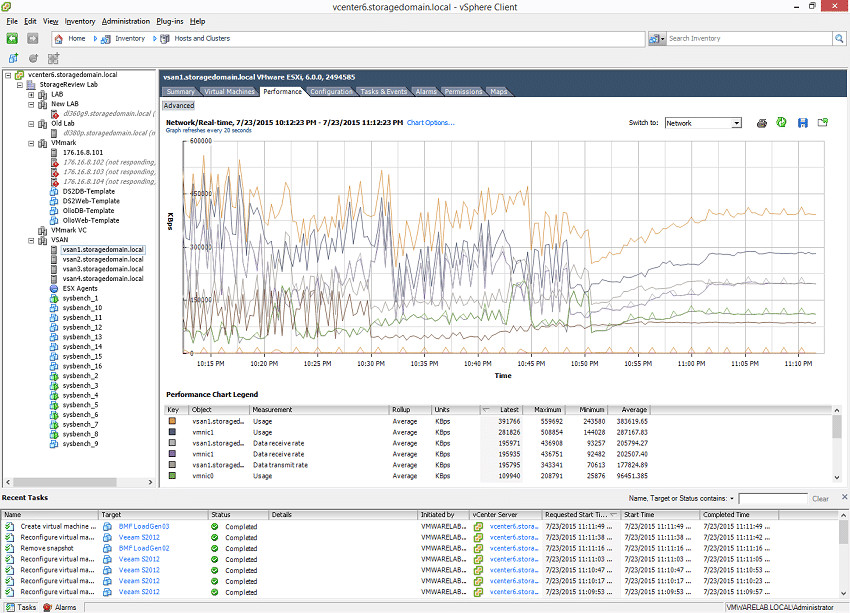
Networking traffic from one host during the 8 VM Sysbench test measured a mixed 391MB/s after the test had leveled off.
Since the purpose of this test is to show how VSAN responds to an ever-increasing workload, we did push the platform to 12 VMs total after the 8 VM run. This was the breaking point where some of the workload pushed outside the SSD cache. We didn't plot this performance because most of the workloads didn't complete or get proper scores. For the VMs that did finish, we would have seen aggregate transaction performance as low as 1000-1500TPS across the cluster. The performance drop-off we measured can of course be mitigated with larger flash devices, such as 1.6TB SSDs instead of 800GB, or moving to an all-flash VSAN model where spilling into your read-tier doesn't have as large of an I/O drop. The underscores the need to properly size the flash component of the VSAN environment, admins or their reseller partners should have good knowledge of the working data set. This is one of the key strengths for the VSAN platform; allowing customers to tailor configurations to best suit the needs of current and future workloads or inexpensively swap/add SSDs as needed.
Knowing where the breaking points of your platform are is very important. The workloads deployed initially will usually grow as time goes on, both in number of VMs and in storage capacity. Every storage platform has a choke point (even all-flash arrays), which leads us into how this four-node VSAN cluster stacks up. Currently we have only had one storage platform successfully run 12 and 16 Sysbench VMs, which was an all-flash array with an MSRP of $575,000. Future testing of this VSAN cluster will include all-flash configurations however, to attempt to reach similar performance objectives.
VMware Virtual SAN Review: Overview and Configuration
VMware Virtual SAN Review: VMmark Performance
VMware Virtual SAN Review: Sysbench OLTP Performance
VMware Virtual SAN Review: SQL Server Performance
VMware Virtual SAN Review: Scaled Sysbench OLTP Performance
VMware Virtual SAN Review: HCIbench Synthetic Performance


 Amazon