

X-IO made their name in enterprise SAN storage by figuring out a way to ensure hard drives and in the case of hybrid configurations, SSDs, never needed to be serviced in the warrantied five-year window. To help achieve this goal, X-IO uses twin DataPacs that are inserted and locked into the fully redundant chassis, delivering a "set it and forget it" style of storage. In March of this year X-IO added to the family of hard drive and hybrid arrays, with a new series of all flash configurations and an updated third generation architecture (G3). The ISE 800 G3 series of all flash arrays includes three models ranging from 6.4TB to 51.2TB of raw capacity. Each brings with it the promise of dramatically reducing the frequency of service calls, along with performance of up to 400,000 IOPS, 5GB/s bandwidth and one of the more robust QoS engines.
X-IO has been around long enough at this point that they have many customers reaching the five-year warranty window, validating, at least to some extent, the key message of simplicity in management. With all-flash configurations the challenges are a little different though. X-IO has mitigated concerns around endurance by introducing the concept of wear leveling at the array level. This essentially manages the health of each SSD at the system level, ensuring that drives are written to in a relatively equal way. The end user needs not worry about the individual drives, as the system will manage the wear. In fact, X-IO doesn't even expose the drives through their GUI; users just manage volumes carved out of the available pool.
X-IO is one of the few in the all flash array space to offer QoS. Within the ISE Manager, admins can specify minimum, maximum and burst IOPS capabilities for each LUN. The process is a few clicks and the rules are applied automatically. This lets business critical volumes have guaranteed performance without having to worry about a noisy neighbor. Additionally the ISE 800 Series support thin provisioning, and integration with VMware VASA, vSphere Web Client, vCOPs, and OpenStack via Cinder driver.
This review centers on the ISE 860 G3, with a limited subset of data also collected using the 820 DataPacs in the same chassis. The ISE 800 Series G3 all flash arrays are shipping now, with a list price of $124,900 for the ISE 820, $320,500 for the ISE 850 and $575,000 for the ISE 860.
X-IO Technologies ISE 800 Series G3 Specifications
- Capacity
- ISE 820 G3
- Before RAID: 6.4TB (20x200GB SSDs per DataPac)
- RAID 10 Capacity: 2.7TB
- RAID 5 Capacity: 4.3TB
- ISE 850 G3 (10×1.6TB SSDs per DataPac)
- Before RAID: 25.6TB
- RAID 10 Capacity: 11.4TB
- RAID 5 Capacity: 18.3TB
- ISE 860 G3 (20×1.6TB SSDs per DataPac)
- Before RAID: 51.2TB
- RAID 10 Capacity: 22.9TB
- RAID 5 Capacity: 36.6TB
- ISE 820 G3
- 2.2 GHz, 6-Core Intel CPU, 16GB DRAM per controller
- Performance at full capacity
- Up to 400,000 IOPS
- Up to 5GB/s bandwidth
- ISE Intelligent caching algorithms will optimize I/O sizes between 512B and 1MB
- Host Connectivity
- 8Gb Fibre Channel – 8 SFP ports (supports both SAN and DAS attach)
- 1GbE Management Port with Wake-on-LAN
- Features
- Active-Active Synchronous Mirroring
- Thin Provisioning
- QoS
- ReST Web Services API
- Power
- 600 Watts typical, 700W max
- Voltage 100-240 VAC, 47-63 Hz
- Current 6.6A at 110V, 3.6A at 208V
- Heat dissipation (max) 2400BTU/hr
- Physical Stats
- 5.2” (13.2cm) Height x 17.5” (44.45cm) Width x 28.5” (72.8cm) Depth
- 72 pounds (32.9kg) without DataPacs
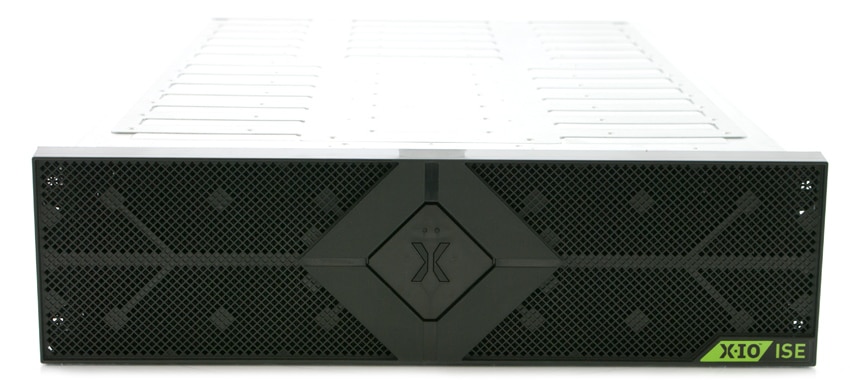
X-IO Technologies ISE 860 G3 Design and Build
Like the previous versions of the ISE, the design is highlighted by the twin front-loaded DataPacs that are inserted then locked into place when the unit is powered on. Each of the 800 Series models uses the same chassis and controllers; the differentiator is simply the capacity of the DataPacs and SSDs that reside inside them. The front of the unit also has two supercapacitor packs that are designed to hold up long enough to flush in-transit writes to non-volatile storage in the event of an unexpected power loss. When power comes back online this data is written to the primary storage pool. The SAS backplane in the 860 has been enhanced, to better take advantage of the IO capabilities of the all-flash configuration.
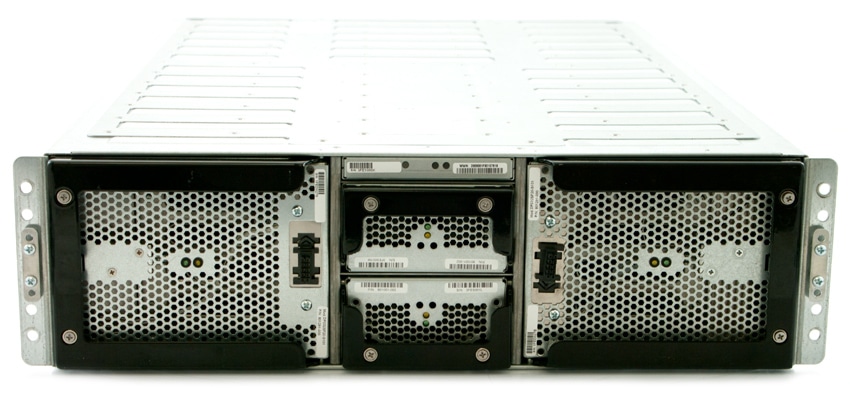
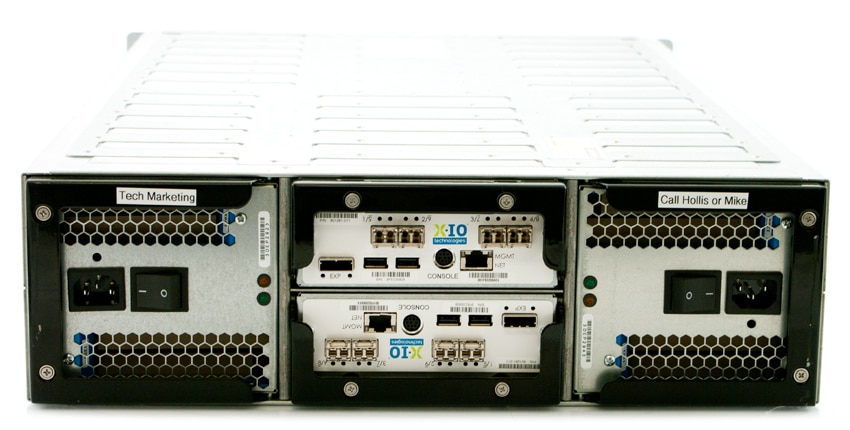
The rear of the unit features redundant power supplies as well as the two controllers. Each controller is powered by a 2.2 GHz, 6-Core Intel CPU with 16GB DRAM on board. In addition to four 8Gb Fibre Channel ports on each controller, there is also a management 1GbE port, console port, two USB slots and a SAS port.
X-IO Technologies ISE 860 G3 Setup and Configuration
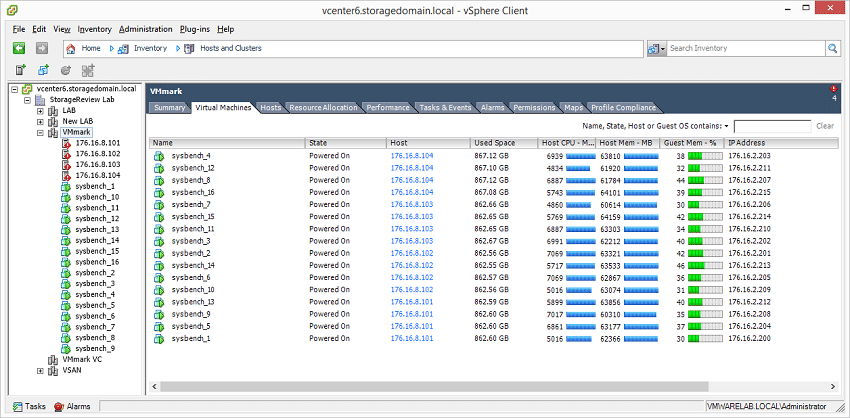
The ISE Manager Suite integrates with Citrix, Linux, Microsoft and VMware to create an environment that makes administration of the ISE very simple. In fact, X-IO likes to say that you don't need to be a trained storage admin to deploy and manage an ISE. We integrated ISE Manager Suite with our VMware vCenter. Along the left hand side administrators can choose between SAN Groups, Performance Adapter, and Collect Logs. Through SAN Groups there are several more tabs including Server View, Storage View, Physical View, ActiveWatch View, Performance View, Logs View, CloudStack, and X-Volume.
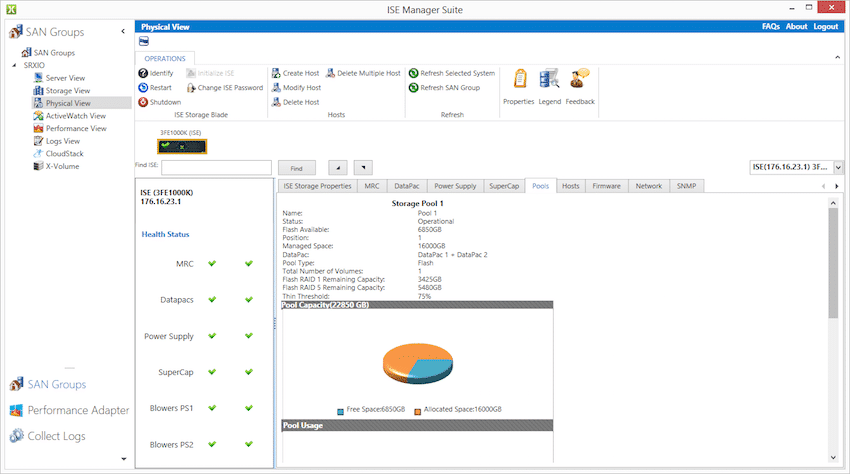
Through Physical View users can check on several of general properties of the array. Running down the left hand side is a readout of system health. Users can check on the DataPacs. The aspects that can be checked on include whether or not they are operational, what position they are in, their type (flash in this case), and which pool they belong to.
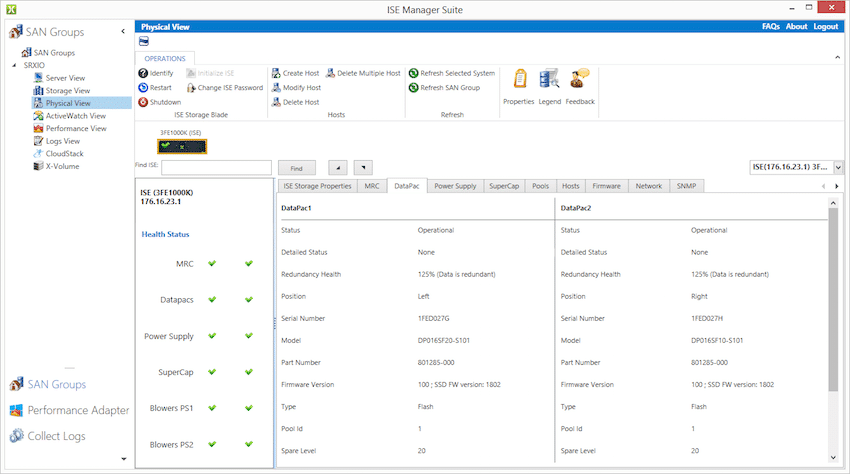
Physical View also allows one to check in on the storage pool(s). Showing details such as how much flash is available, which DataPac is in the pool (both in this case), and the amount of free and total capacity.
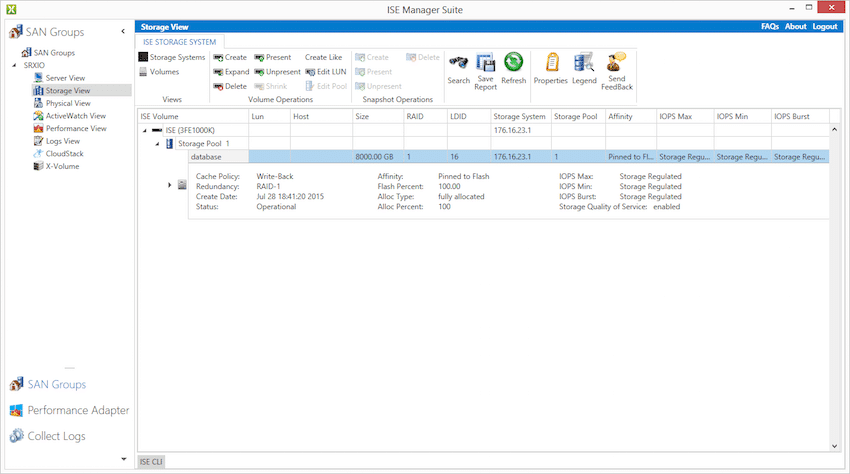
In Storage View users can see the different storage pools, their size, the RAID configuration, where the pool is pinned, and setup performance maximums and minimums.
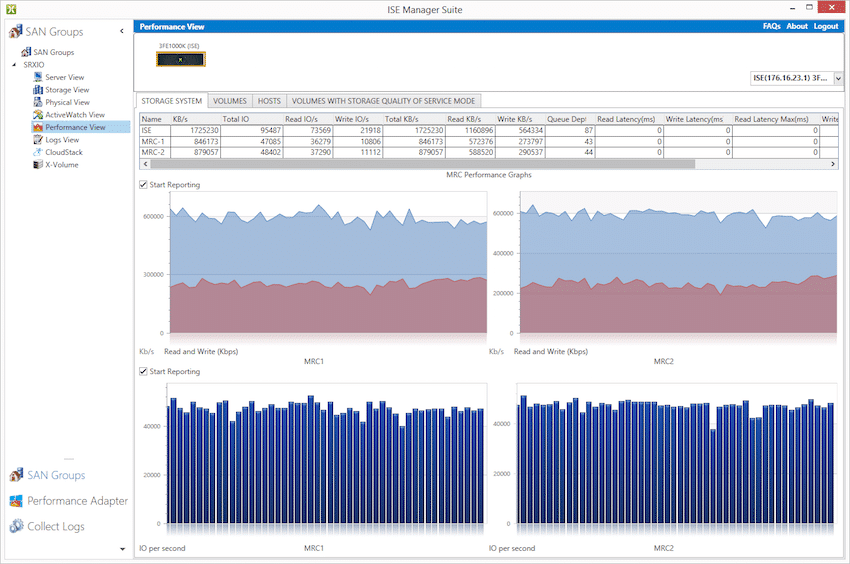
Performance View allows administrators to actually keep track of performance in real-time. Performance can be tracked easily. For example throughout measurements from where the SQL workload begins can be seen below. As data moves into host DRAM, reads taper off, although large write bursts are visible for each log write.
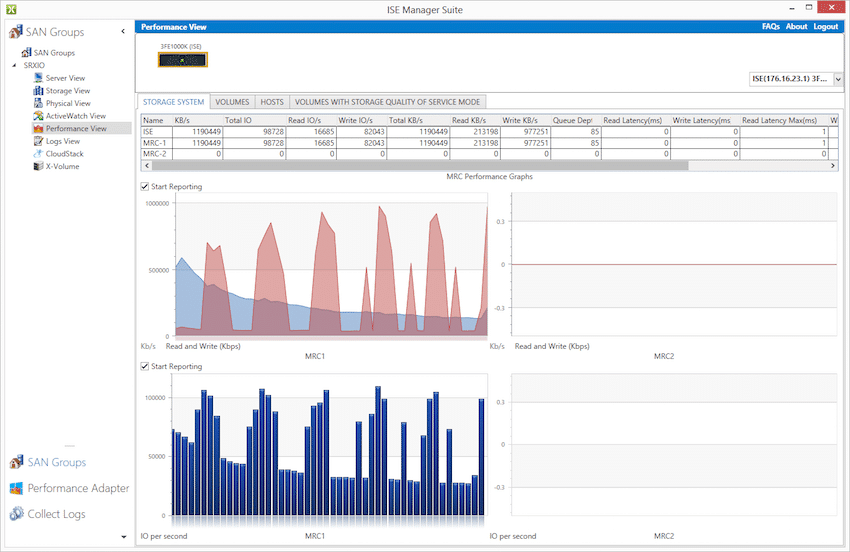
At the start of the virtualized Sysbench test with 16 VMs hammering the array, you can see the heavy read and write mix hitting both controllers.
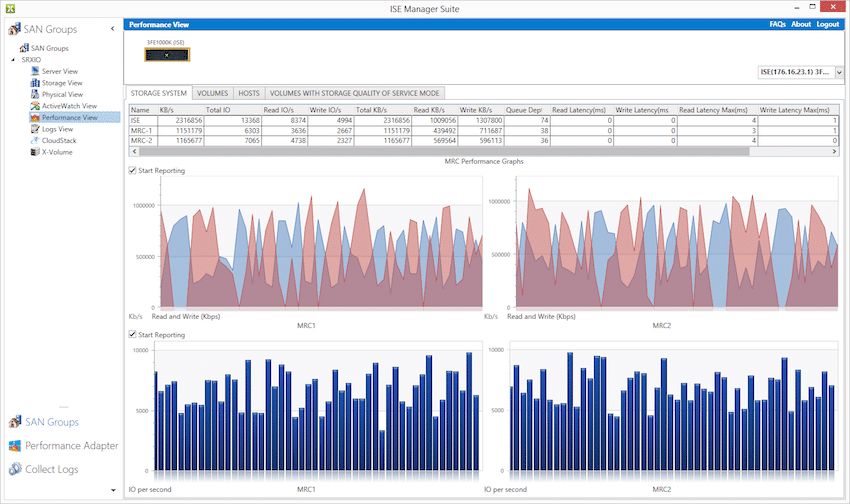
Once the 16VM Sysbench test levels off you can see the array reaching a steady state condition.
Application Performance Analysis
The Sysbench OLTP benchmark runs on top of Percona MySQL leveraging the InnoDB storage engine operating inside a CentOS installation. To align our tests of traditional SAN with newer hyper-converged gear, we've shifted many of our benchmarks to a larger distributed model. The primary difference is that instead of running one single benchmark on a bare-metal server, we now run multiple instances of that benchmark in a virtualized environment. To that end, we deployed 1, 4, 8, 12 and 16 Sysbench VMs on the X-IO ISE 860, 1-4 per node, and measured the total performance seen on the cluster with all operating simultaneously. This test was designed to show how well an array handles itself under normal to extreme workloads. At the test's peak, we are fully tasking the four ESXi hosts that the VMs reside on, pegging each host's DRAM usage.
Dell PowerEdge R730 Virtualized Sysbench 4-node Cluster
- Eight Intel E5-2690 v3 CPUs for 249GHz in cluster (Two per node, 2.6GHz, 12-cores, 30MB Cache)
- 1TB RAM (256GB per node, 16GB x 16 DDR4, 128GB per CPU)
- SD Card Boot (Lexar 16GB)
- 4 x Mellanox ConnectX-3 InfiniBand Adapter (vSwitch for vMotion and VM network)
- 4 x Emulex 16GB dual-port FC HBA
- 4 x Emulex 10GbE dual-port NIC
- VMware ESXi vSphere 6.0 / Enterprise Plus 8-CPU
Each Sysbench VM is configured with three vDisks, one for boot (~92GB), one with the pre-built database (~447GB) and the third for the database that we will test (400GB). From a system resource perspective, we configured each VM with 16 vCPUs, 64GB of DRAM and leveraged the LSI Logic SAS SCSI controller.
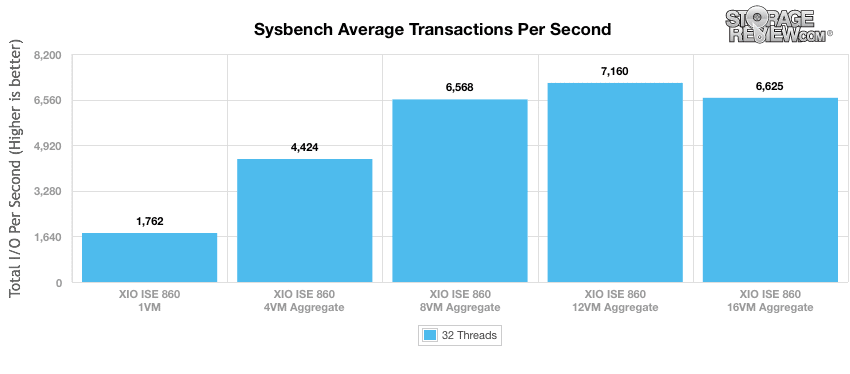
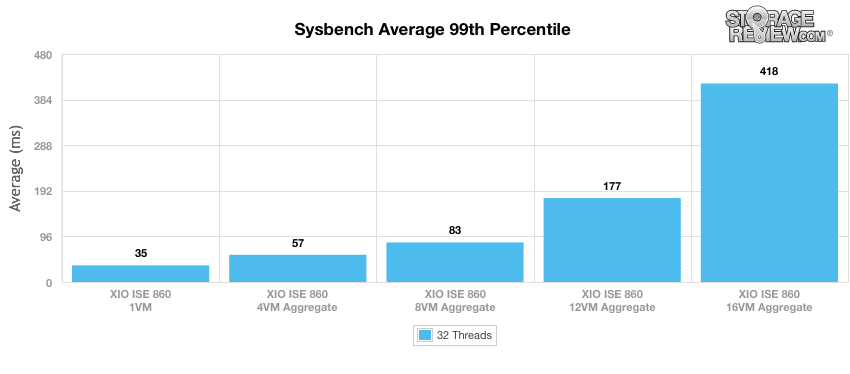
Our Sysbench test measures average TPS (Transactions Per Second), average latency, as well as average 99th percentile latency at a peak load of 32 threads.
Looking at average transactions per second, the XIO ISE 860 posted 1,762 TPS when using one virtual machine. When boosting the configuration to 4 VMs, we saw a huge improvement in TPS to 4,424, which is an increase of roughly 150%. We also saw increases to performance when going from 4 VMs to 8VMs (38%) as well as 8 VMs to 12 VMs (9%). However, when increasing to 16 VMs, we saw a slight decrease in TPS by 7.4%. Even as the overall performance dipped at 16 VMs, the X-IO ISE 860 proved itself to be an absolute powerhouse to maintain that level of performance under an incredibly load.
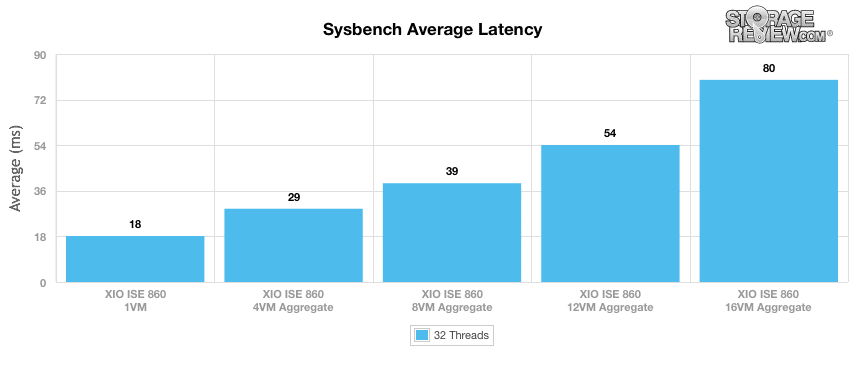
In average latency, it’s evident that the more virtual machines added to the XIO ISE 860, the higher recorded latency. When we changed the ISE 860’s 1 VM configuration (18ms) to 4 VMs (29ms), latency increased by 61%. From 4 VMs to 8 VMs, we saw an increase of 34.5% while we recorded a 38.5% increase when moving from 8 VMs to 12 VMs. Lastly, when using 16 VMs, we measured a 48% in latency. Looking back to our above TPS chart, note that when using 12VMs, it offered the highest performance, whereas 16VMs started to decrease TPS as well as further increase latency.
In terms of our worst-case MySQL latency scenario (99th percentile latency), the XIO SE 860 only saw a slight increase in latency moving from 1 VM to 4 VMs and again from 4 VMs to 8 VMs. When adding 12 VMs, however, we saw a significant 113% increase in latency while recording an even larger increase when moving from 12 VMs to 16 VMs (136%).
StorageReview’s Microsoft SQL Server OLTP testing protocol employs the current draft of the Transaction Processing Performance Council’s Benchmark C (TPC-C), an online transaction processing benchmark that simulates the activities found in complex application environments. The TPC-C benchmark comes closer than synthetic performance benchmarks to gauging the performance strengths and bottlenecks of storage infrastructure in database environments.
This test uses SQL Server 2014 running on Windows Server 2012 R2 guest VMs, being stressed by Dell's Benchmark Factory for Databases. While our traditional usage of this benchmark has been to test large 3,000-scale databases on local or shared storage, in this iteration we focus on spreading out four 1,500-scale databases evenly across our X-IO ISE 860 to better illustrate the aggregate performance inside a 4-node VMware cluster.
Second Generation SQL Server OLTP Benchmark Factory LoadGen Equipment
- Dell PowerEdge R730 VMware ESXi vSphere Virtual Client Hosts (2)
- Four Intel E5-2690 v3 CPUs for 124GHz in cluster (Two per node, 2.6GHz, 12-cores, 30MB Cache)
- 512GB RAM (256GB per node, 16GB x 16 DDR4, 128GB per CPU)
- SD Card Boot (Lexar 16GB)
- 2 x Mellanox ConnectX-3 InfiniBand Adapter (vSwitch for vMotion and VM network)
- 2 x Emulex 16GB dual-port FC HBA
- 2 x Emulex 10GbE dual-port NIC
- VMware ESXi vSphere 6.0 / Enterprise Plus 4-CPU
-
Dell PowerEdge R730 Virtualized SQL 4-node Cluster
- Eight Intel E5-2690 v3 CPUs for 249GHz in cluster (Two per node, 2.6GHz, 12-cores, 30MB Cache)
- 1TB RAM (256GB per node, 16GB x 16 DDR4, 128GB per CPU)
- SD Card Boot (Lexar 16GB)
- 4 x Mellanox ConnectX-3 InfiniBand Adapter (vSwitch for vMotion and VM network)
- 4 x Emulex 16GB dual-port FC HBA
- 4 x Emulex 10GbE dual-port NIC
- VMware ESXi vSphere 6.0 / Enterprise Plus 8-CPU
Each SQL Server VM is configured with two vDisks, one 100GB for boot and one 500GB for the database and log files. From a system resource perspective, we configured each VM with 16 vCPUs, 64GB of DRAM and leveraged the LSI Logic SAS SCSI controller.
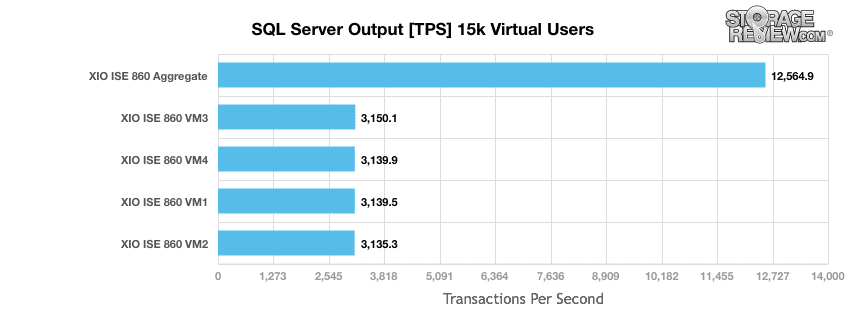
The X-IO ISE 860 benchmarked in SQL Server test was certainly well qualified to handle 15,000 virtual users, as the XIO ISE 860 boasted an aggregate average of 12,564.9 TPS.
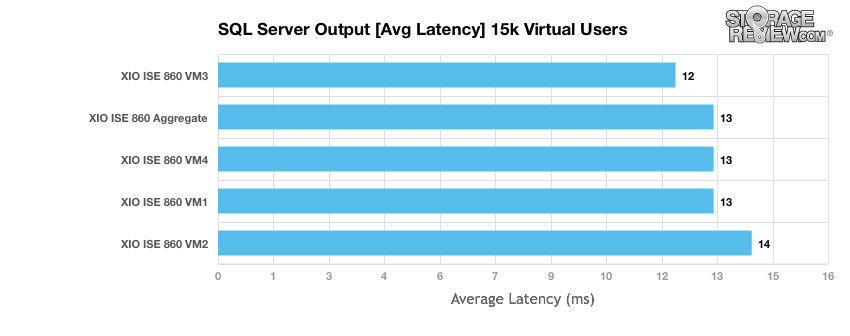
When looking at average latency with the same workload of virtual users, the X-IO ISE 860 offered an overall average 13ms latency, with a spread of 12 to 14ms between the 4 VMs. This is another area where consistency of the ISE 860 between volumes and its low latency responsiveness helped it achieve leading numbers.
Enterprise Synthetic Workload Analysis
Prior to initiating each of the fio synthetic benchmarks, our lab preconditions the system into steady state under a heavy load of 16 threads with an outstanding queue of 16 per thread. Then the storage is tested in set intervals with multiple thread/queue depth profiles to show performance under light and heavy usage.
- Preconditioning and Primary Steady State Tests:
- Throughput (Read+Write IOPS Aggregated)
- Average Latency (Read+Write Latency Averaged Together)
- Max Latency (Peak Read or Write Latency)
- Latency Standard Deviation (Read+Write Standard Deviation Averaged Together)
This synthetic analysis incorporates two profiles which are widely used in manufacturer specifications and benchmarks:
- 4k – 100% Read and 100% Write
- 8k – 70% Read/30% Write
Third Generation FIO LoadGen
- HP ProLiant DL380 Gen9
- Dual Intel E5-2667 v3 CPUs (3.2GHz, 8-cores, 20MB Cache)
- 256GB RAM (16GB x 16 DDR4, 128GB per CPU)
- Windows Server 2012 R2
- 400GB Boot SSD
- 2 x Emulex 16GB dual-port FC HBA
- Brocade 6510 48-port 16Gb Switch
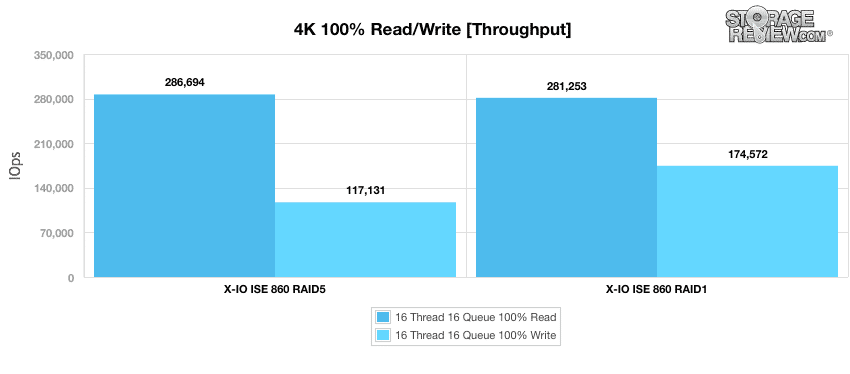
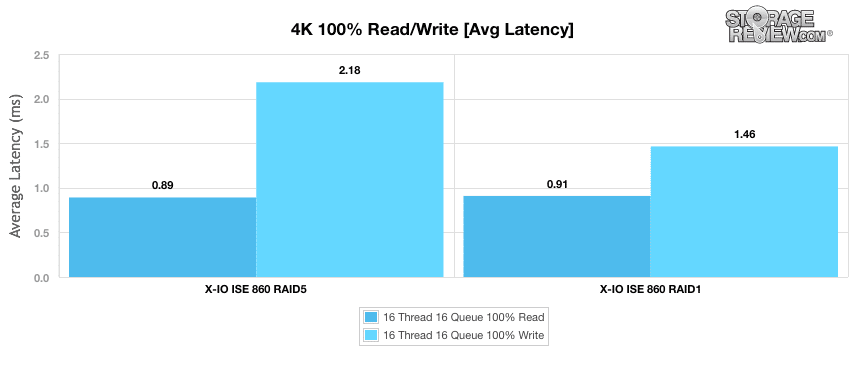
Our first benchmark measures the performance of random 4k transfers comprised of 100% write and 100% read activity. In throughput, the X-IO ISE 860 recorded 286,694 IOPS read and 117,131 write using a RAID5 configuration. In RAID1, it measured 281,253 IOPS read with better writes at 174,572 IOPS.
The X-IO ISE 860 experienced an average read latency of just 0.89ms and a write latency of 2.18ms in RAID5 while RAID1 boasted 0.91ms read and showed superior write latency again with 1.46ms.
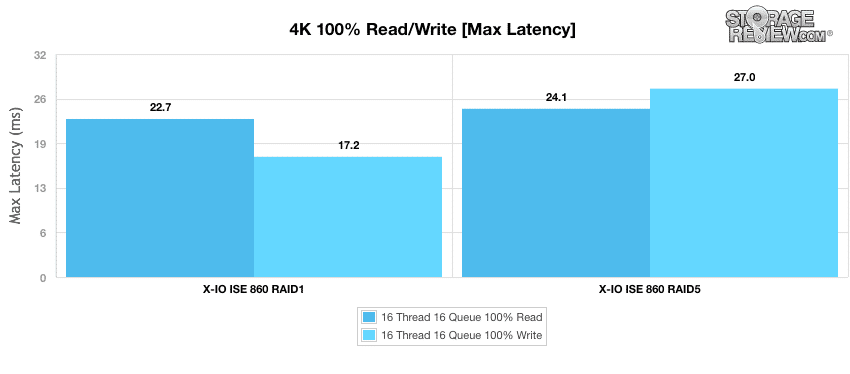
When moving to our maximum latency tests, the X-IO ISE 860 in RAID1 posted 22.7ms read and 17.2ms write while the RAID5 configuration measured 24.1ms read and 27.0ms write.
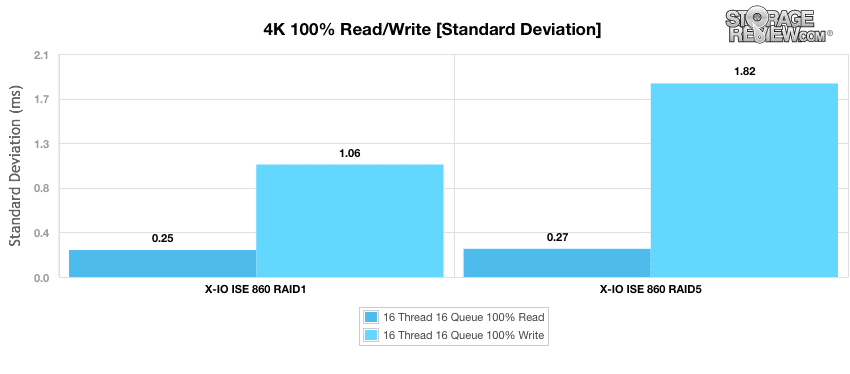
In our standard deviation test, the RAID1 configuration continued its great results, with only 0.25ms read and 1.06ms writes. Though the RAID5 configuration showed similar reads, it had a much higher latency in writes (1.82ms).
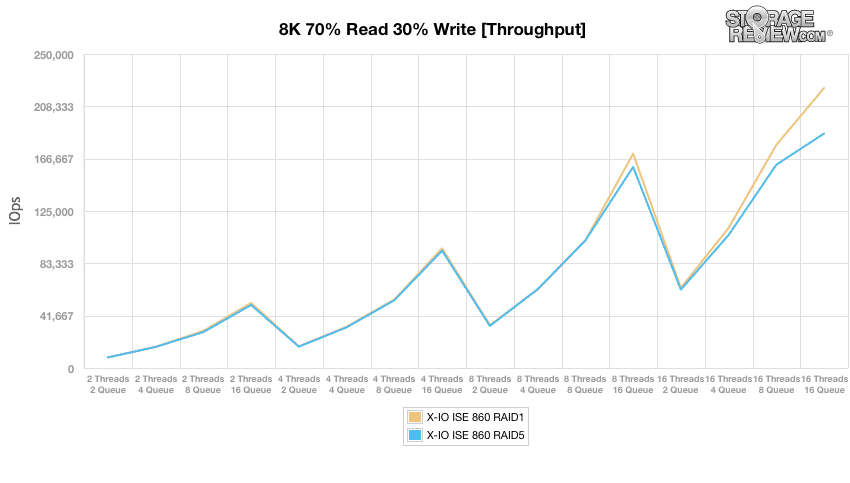
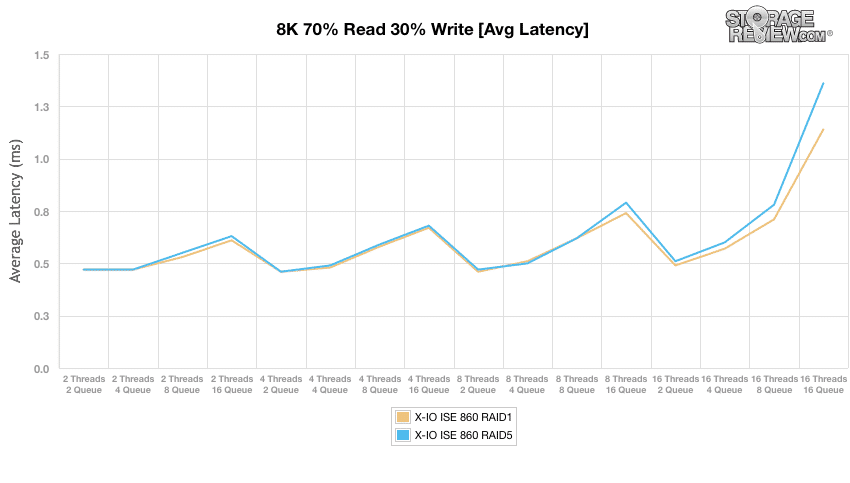
Moving to the 8k 70% read 30% write random workload, both X-IO ISE 860 configurations show virtually identical results throughout our Threads. The RAID5 configuration only started fading away at 16T/8Q where it ended up with roughly 185,000 IOPS. RAID1 showed a terminal throughout of approximately 230,000 IOPS.
Looking at average latency told a similar story, as both RAID1 and RAID5 showed similar results once again, only to split apart around 8T16Q. In the terminal depths, RAID5 showed roughly 1.4ms in average latency, while RAID1 measured 1.2ms.
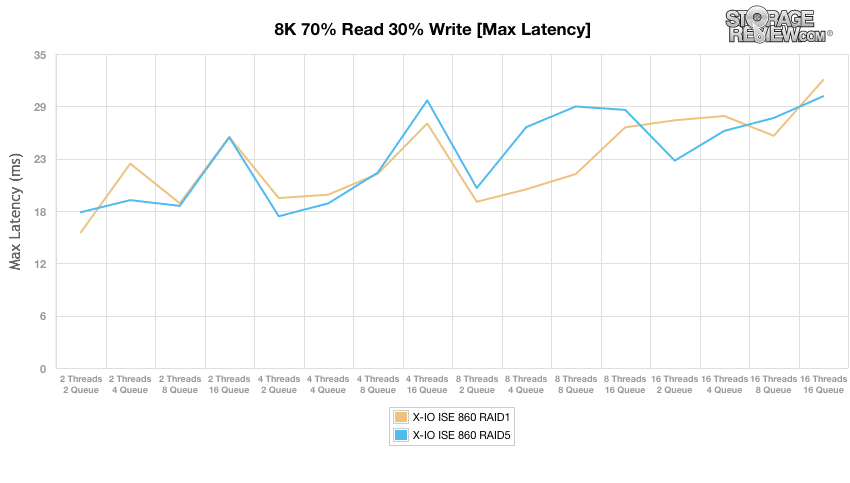
Results were much less similar when looking at peak latency performance. Here, RAID1 started at an initial 16ms at 2T2Q while reaching 32ms in the terminal. The X-IO ISE 860 in RAID5 measured 18ms at 2T2Q and 30ms at 16T16Q.
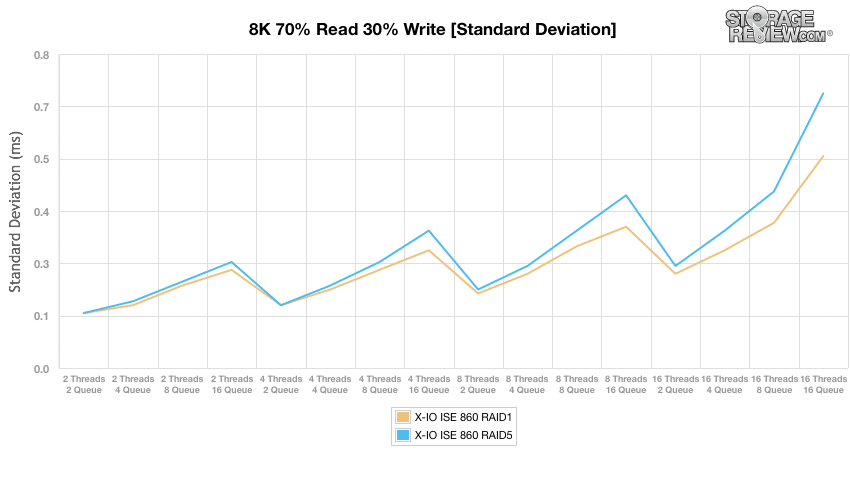
As shown below, our standard deviation results were very similar to our average latency charts. Both RAID configurations started at 0.1ms while gradually separating by the 4T4Q mark. In the terminal threads, the RAID5 configuration reached 0.73ms while RAID1 hit 0.51ms.
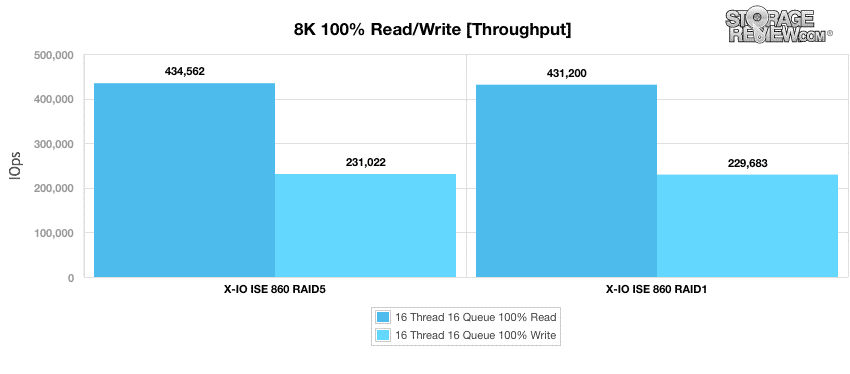
Our next workload shifts to an 8K small block sequential test. In this scenario the ISE 860 in RAID5 had a small lead in both read and write performance, measuring 434,562 IOPS read and 231,022 IOPS write, compared to RAID1 measuring 431,200 IOPS read and 229,683 IOPS write. In terms of peak I/O potential, the ISE 860 didn't disappoint.
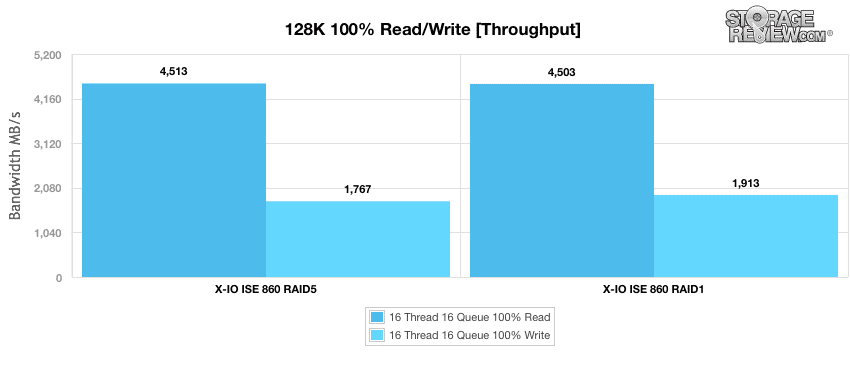
Our last workload is a 128K large block sequential test. In this scenario, both RAID configurations had similar results: RAID5 showed 4,513MBs read and 1,767MB/s write while RAID1 posted read and writes of 4,503MB/s and 1,913MB/s, respectively. While sequential performance doesn't have a huge role in a heavy virtualized world where you end up seeing highly randomized traffic, it still was nice to see the array had some muscle to push out upwards of 4.5GB/s out. Sequential large-block write performance was a touch low, but given how well it performed in our application tests, this won't impact much in real-world conditions.
Part 1 Final Thoughts
In part 2 of the review we will examine several other areas of performance. From what we've seen thus far, there's plenty of reason to be optimistic with the rest of the testing, which will include the likes VMmark, DataFusion in memory database and OpenLDAP database tests. Unfortunately we have little to directly compare the ISE 860 to. The Gen2 testing methodology and lab backbone (Dell servers) we've deployed for testing is just showing the fruits of success, with the ISE 860 being the first SAN to make it out as a review. Even so however, looking back at similar results and extrapolating some, tells us that the XIO ISE platform is ready to play on the main stage with other all flash heavyweights, competing at a very high level for business critical workloads. Part 2 will reveal even more as we press the system to its limits again by exercising well over 20 tiles in VMmark. Stay tuned for the next installment.
Coming Up: X-IO Technologies ISE 860 G3 Review: Part 2


 Amazon