

Tuning hyper-converged systems for VMmark presents new challenges for how StorageReview runs the benchmark. Our VMmark implementation is designed for traditional IT architectures, fixed compute servers and review storage hardware swapped between tests. With VMware VSAN, storage and compute are merged into one platform with one single datastore, necessitating a modification to our VMmark setup. In this case we had our VMware VSAN cluster both running the storage and the compute requirements, offering a one-two punch compared to traditional platforms that would require compute servers separate.
VMmark by its very design is a highly resource intensive benchmark, with a broad mix of VM-based application workloads stressing storage, network and compute activity. When it comes to testing VSAN, there is almost no better benchmark for it, since VMmark looks at so many facets, covering storage I/O, CPU, and even network performance in VMware environments. VSAN deployments also gain the benefits of hyper-converged, with compute and storage bundled together in the same cluster.
To get VMmark working within our VSAN cluster we brought in a spare iSCSI storage host (DotHill Ultra48), as VSAN is limited to one datastore and VMmark performs Storage vMotion activities as part of the test. We provisioned 2 SSDs in RAID1 and served this storage up to the cluster for that single data migration activity, which will remain consistent as other platforms in this category are tested. Sticking with academic posting requirements, we normalized the platform against a baseline iSCSI storage platform, which we also leverage with standard storage array VMmark testing to keep figures as consistent as possible even with the compute infrastructure changes. In this case we used a single tile score on a Synology RackStation RS10613xs+ configured with ten 15K SAS HDDs in RAID10 to normalize all results against for this cluster.
Dell PowerEdge R730xd VMware VSAN Specifications
- Dell PowerEdge R730xd Servers (x4)
- CPUs: Eight Intel Xeon E5-2697 v3 2.6GHz (14C/28T)
- Memory: 64 x 16GB DDR4 RDIMM
- SSD: 16 x 800GB Solid State Drive SAS Mix Use MLC 12Gbps
- HDD: 80 x 1.2TB 10K RPM SAS 6Gbps
- Networking: 4 x Intel X520 DP 10Gb DA/SFP+, + I350 DP 1Gb Ethernet
- Storage Capacity: 86.46TB
As we compare the pricing between the traditional storage arrays against the Dell PowerEdge R730xd VMware VSAN configuration, the total cost of the platform needs to be taken into consideration. With VSAN builds, compute and storage are part of the same package and scale-out as additional nodes are added into the fold. With traditional storage platforms, you only get the storage half of the equation, meaning compute costs must still be factored into your buying decision. While our Dell PowerEdge R730xd servers were specced out in a storage-heavy configuration ($26,500 each) to utilize the storage for VSAN, users opting for external shared storage would only need to purchase the servers for their compute resources. In that case the cost of the server, minus drives, drops to around $10,000 each or $40,000 total to match the compute resources in our VSAN build. vSphere licensing also has to be taken into account, which would add another $28,000 on top of the configuration costs to match those we used for VSAN.
- Dot Hill AssuredSAN Ultra48 (Hybrid): $113,158 + Cost of Servers + vSphere Licencing
- Tegile HA2300 Hybrid: $185,000 + Cost of Servers + vSphere Licencing
- Dell PowerEdge R730xd w/ VMware VSAN: $153,920
- Dell PowerEdge R730xd Servers w/ 3 year warranty: 4x $26,500
- VMware vSphere 6.0 Enterprise Plus Licenses: 8x $3,495
- VMware VSAN 6.0 Licenses: 8x $2,495
During VMmark testing, we deployed 20 tiles onto the cluster, taking up over 6TB of our 86.46TB total storage capacity. We started at a load of 20 tiles (which was close but not passing) and moved down to 18 tiles for the first passing score. Afterwards we scaled down by 2 before closing with a 1-tile score. Unlike other storage platforms, there is no RAID or datastore configuration with VSAN. Once the drives are pooled into the cluster, VSAN handles the rest on its own.
VMmark Performance
The 4-node Dell PowerEdge RD730xd VSAN cluster was able to top out at 18 tiles in VMmark. 18 tiles is certainly an impressive ceiling, given that's where we've seen traditional storage arrays top out previously with a dedicated compute cluster. The Dot Hill Ultra48 with SSD tiering for instance came in at 18 tiles, with 800GB of flash and 9.6TB HDD capacity in RAID10. The Tegile HA2300, which exceeds the total cost of our VSAN cluster, topped out at 6 tiles with a dual-controller unit and an extra shelf, though to be fair, Tegile swaps performance for data reduction and ease of use.
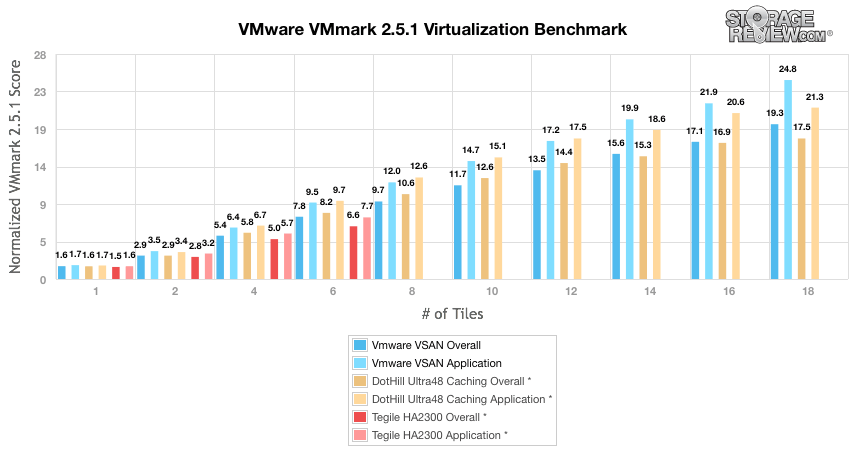
For the purposes of this test, the main focal point should be the number of tiles VSAN was capable of achieving, and less of the one-to-one comparison between it and traditional storage. Since the compute platforms differ, exact head to head, normalized numbers aren't possible. With that said though, this comparison is helpful to understand the top-end performance of VSAN given the hardware as configured. It is interesting to see that even in a compute-heavy benchmark such as VMmark, the overhead of the shared storage component of VSAN didn't inhibit the overall performance of the cluster. At 18 tiles we still had CPU resources leftover on all nodes, storage was the gating factor. It's worth noting that a little more flash would continue to drive up the supported tile count, which underscores the need for proper flash sizing in any VSAN deployment.
Next Up: VSAN MySQL Performance Report
VMware Virtual SAN Review: Overview and Configuration
VMware Virtual SAN Review: VMmark Performance
VMware Virtual SAN Review: Sysbench OLTP Performance
VMware Virtual SAN Review: SQL Server Performance
VMware Virtual SAN Review: Scaled Sysbench OLTP Performance
VMware Virtual SAN Review: HCIbench Synthetic Performance


 Amazon