
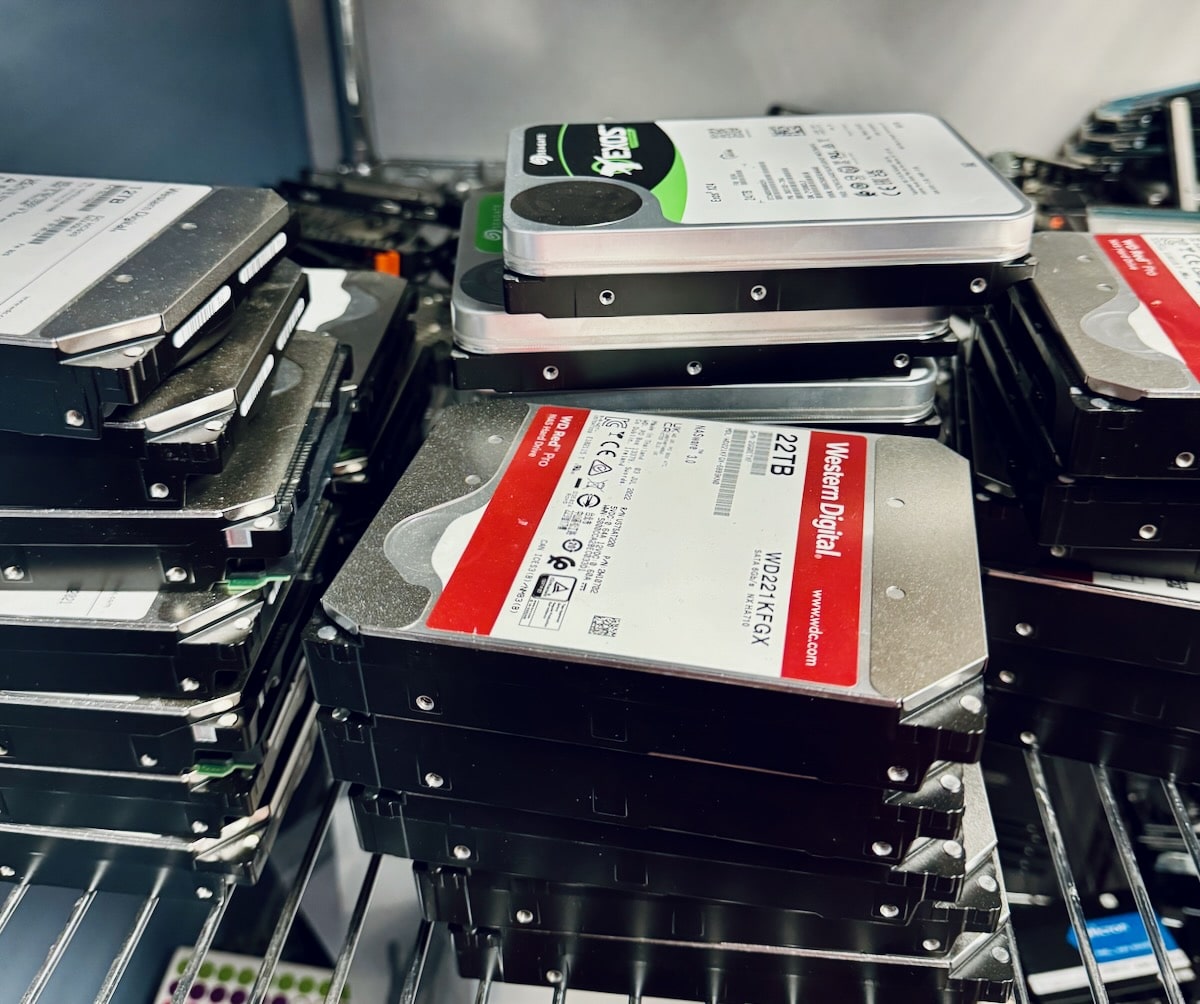
This latest Backblaze report looks into the growth of high-capacity drives while tracking the long-term health of aging 12TB and under performers.
Backblaze has released its Q2 2025 Drive Stats report, offering another detailed look into the health and performance of the hard drives powering its cloud storage infrastructure. With over 321,000 drives under management by the end of June (including 317,230 active data drives), this quarter gives us yet another strong snapshot of how various models are holding up. In this edition, we’ll take our usual look at the Backblaze quarterly and lifetime failure trends, with a new focus on the ever-growing 20TB+ segment at the end. So, let’s dig into the latest data.
Q2 2025 Hard Drive Failure Rates
First up is the Backblaze quarterly report that tracks drives meeting minimum thresholds for inclusion: at least 100 drives deployed and over 10,000 drive days recorded during the quarter. This helps filter outliers and test units that could skew the results.
Here’s the full Q2 2025 failure rate table:
| MFG | Model | Size (TB) | Drive Count | Avg. age (months) | Drive days | Failures | AFR |
| HGST | HMS5C4040BLE640 | 4 | 188 | 95.7 | 16,893 | 1 | 2.16% |
| HGST | HUH728080ALE600 | 8 | 1,081 | 82.8 | 97,423 | 2 | 0.75% |
| HGST | HUH721212ALE600 | 12 | 2,608 | 63.9 | 237,117 | 2 | 0.31% |
| HGST | HUH721212ALE604 | 12 | 13,468 | 45.4 | 1,207,348 | 115 | 3.48% |
| HGST | HUH721212ALN604 | 12 | 10,070 | 69.1 | 903,548 | 84 | 3.39% |
| Seagate | ST8000DM002 | 8 | 9,027 | 100.9 | 819,550 | 40 | 1.78% |
| Seagate | ST8000NM000A | 8 | 247 | 26 | 22,433 | 0 | 0% |
| Seagate | ST8000NM0055 | 8 | 13,424 | 89.6 | 1,215,170 | 73 | 2.19% |
| Seagate | ST10000NM0086 | 10 | 1,026 | 86.6 | 92,392 | 12 | 4.74% |
| Seagate | ST12000NM0007 | 12 | 1,014 | 64 | 91,801 | 9 | 3.58% |
| Seagate | ST12000NM0008 | 12 | 19,041 | 58.8 | 1,718,002 | 138 | 2.93% |
| Seagate | ST12000NM000J | 12 | 980 | 9.4 | 85,277 | 1 | 0.43% |
| Seagate | ST14000NM000J | 14 | 1,330 | 49.4 | 1,197,755 | 39 | 1.19% |
| Seagate | ST14000NM000J | 14 | 301 | 10 | 26,204 | 1 | 1.39% |
| Seagate | ST14000NM001G | 14 | 10,614 | 48.7 | 956,403 | 33 | 1.26% |
| Seagate | ST14000NM0138 | 14 | 1,300 | 50.7 | 116,900 | 14 | 4.37% |
| Seagate | ST16000NM001G | 16 | 33,963 | 30.4 | 3,078,040 | 49 | 0.58% |
| Seagate | ST16000NM002J | 16 | 460 | 27.4 | 41,860 | 0 | 0% |
| Seagate | ST24000NM002H | 24 | 6,029 | 2.3 | 443,251 | 28 | 2.26% |
| Toshiba | MG07ACA14TA | 14 | 37,570 | 52.3 | 3,402,312 | 107 | 1.15% |
| Toshiba | MG07ACA14TEY | 14 | 917 | 34.8 | 78,967 | 4 | 1.85% |
| Toshiba | MG08ACA16TA | 16 | 40,250 | 20.4 | 3,652,078 | 115 | 1.15% |
| Toshiba | MG08ACA16TE | 16 | 5,947 | 40.9 | 535,044 | 31 | 2.11% |
| Toshiba | MG08ACA16TEY | 16 | 5,158 | 38.9 | 466,977 | 33 | 2.58% |
| Toshiba | MG09ACA16TE | 16 | 164 | 1.9 | 12,700 | 1 | 2.87% |
| Toshiba | MG10ACA20TE | 20 | 14,422 | 3.9 | 1,203,866 | 2 | 0.06% |
| WDC | WUH721414ALE6L4 | 14 | 8,635 | 49.9 | 780,029 | 15 | 0.70% |
| WDC | WUH721816ALE6L0 | 16 | 3,006 | 38.7 | 272,497 | 17 | 2.28% |
| WDC | WUH721818ALE6L4 | 16 | 26,545 | 23.3 | 2,403,249 | 31 | 0.47% |
| WDC | WUH722222ALE6L4 | 22 | 37,947 | 7.3 | 3,241,771 | 46 | 0.52% |
| Totals | 317,992 | 28,402,627 | 1,061 | 1.36% | |||
Interestingly, while the quarterly failure rate ticked up slightly last quarter to 1.42%, it dropped again to 1.36% in Q2. This is a welcome dip, especially considering some of the higher outliers we saw recently. The decline appears to be driven in part by significant recoveries in a few of the models that were previously struggling.
Take the Seagate ST12000NM0007, for example. In Q1, it posted a staggering 9.47% AFR, but in Q2, that dropped to 3.58%. It’s a fundamental change in failure behavior over a large population, as the number of drives remained the same between quarters. Similarly, HGST’s HUH721212ALN604 also saw a noticeable improvement, down from 4.97% to 3.39%, while the Seagate ST14000NM0138 14TB drive (an earlier red flag from past reports) fell from 6.82% to 4.37%. This was still high, but trending in a better direction.
One new drive made its debut this quarter: the Toshiba MG09ACA16TE. This 16TB drive recorded one failure across just over 12,000 drive days, which puts its initial AFR at 2.87%. It’s too early to judge, but it’s worth watching in future reports.
As for the top performers, only two models reported zero failures in Q2:
- Seagate ST8000NM000A (8TB)
- Seagate ST16000NM002J (16TB)
This is the third consecutive quarter with no failures for the 8TB Seagate, a highlight in terms of consistency. And although just two models had perfect records this time, there were several that came very close, each with only a single failure: HGST HMS5C4040BLE640, Seagate ST12000NM000J and ST14000NM000J, and the new Toshiba MG09ACA16TE.
Drive Model Criteria
Before we dive into the lifetime numbers, Backblaze explained why certain drives were excluded from the Q2 2025 report; specifically, 495 drives were omitted from the analysis. There are two main reasons for this.
The first reason is testing. Some drives are being evaluated in a lab or pre-production setting, even though they’re active in the Backblaze environment. These drives are monitored and data is collected, but because they’re not part of the main deployment fleet, they’re left out of the official Drive Stats numbers. This helps keep the results focused strictly on drives used in real-world, at-scale storage scenarios.
The second reason is a lack of data. To maintain statistical reliability, Backblaze applies minimum thresholds before including any drive model in a quarterly, annual, or lifetime table. If there aren’t enough units or enough drive days logged, the model gets skipped for that period. The idea is to avoid drawing conclusions from too small a sample.
Here’s how those thresholds break down:
| Period | Drive count | Drive days |
| Quarterly | >100 | >10,000 |
| Annual | >250 | >50,000 |
| Lifetime | >500 | >100,000 |
Regardless of whether a model appears in the charts, Backblaze collects and provides the underlying data for every drive as part of its comprehensive Drive Stats dataset. If you wish to explore or download the raw data, you can always access it on the official Drive Stats page.
The same inclusion criteria shown above will also apply to the lifetime failure rate section that follows.
Lifetime Drive Failure Rates
For the long-term view, Backblaze only includes drive models that meet an even stricter set of criteria. To be considered for the lifetime failure table, a drive must have at least 500 active units as of the end of Q2 2025 and must have logged over 100,000 drive days in total. After removing models that didn’t meet these thresholds, 27 qualifying models remained for analysis, which represents 393,907 drives and nearly half a billion drive days.
Here’s the breakdown of lifetime failure rates as of June 30, 2025:
| MFG | Model | Size (TB) | Drive Count | Avg. Age (Months) | Drive Days | Failures | AFR |
| HGST | HMS5C4040ALE640 | 4 | 8,723 | 63.3 | 16,788,181 | 260 | 0.57% |
| HGST | HMS5C4040BLE640 | 4 | 16,349 | 82.7 | 41,138,908 | 448 | 0.40% |
| HGST | HUH728080ALE600 | 8 | 1,218 | 80.2 | 2,970,346 | 92 | 1.13% |
| HGST | HUH721212ALE600 | 12 | 2,695 | 65.9 | 5,401,641 | 83 | 0.56% |
| HGST | HUH721212ALE604 | 12 | 14,267 | 47 | 20,386,683 | 878 | 1.57% |
| HGST | HUH721212ALN604 | 12 | 11,438 | 69.6 | 24,231,219 | 1398 | 2.11% |
| Seagate | ST8000DM002 | 8 | 10,320 | 98.2 | 30,833,542 | 1,290 | 1.53% |
| Seagate | ST8000NM0055 | 8 | 15,680 | 87 | 41,512,527 | 2,256 | 1.98% |
| Seagate | ST10000NM0086 | 10 | 1,304 | 83.1 | 3,297,748 | 262 | 2.90% |
| Seagate | ST12000NM0007 | 12 | 38,843 | 31.4 | 37,065,961 | 2,264 | 2.33% |
| Seagate | ST12000NM0008 | 12 | 21,037 | 59.2 | 37,903,847 | 2,093 | 2.02% |
| Seagate | ST12000NM000J | 12 | 1,003 | 11.4 | 348,111 | 1 | 0.29% |
| Seagate | ST12000NM001G | 12 | 13,847 | 51 | 21,487,178 | 584 | 0.99% |
| Seagate | ST14000NM000J | 14 | 11,262 | 50.1 | 17,104,132 | 663 | 1.41% |
| Seagate | ST14000NM0138 | 14 | 1,364 | 48.9 | 2,423,426 | 381 | 5.89% |
| Seagate | ST16000NM001G | 16 | 36,957 | 30.2 | 4,562,793 | 663 | 0.72% |
| Toshiba | MG07ACA14TA | 14 | 37,570 | 52.3 | 3,402,312 | 107 | 1.15% |
| Toshiba | MG07ACA14TEY | 14 | 954 | 33.5 | 971,815 | 39 | 1.46% |
| Toshiba | MG08ACA16TA | 16 | 40,996 | 41.7 | 27,000,887 | 858 | 1.16% |
| Toshiba | MG08ACA16TE | 16 | 6,198 | 41.7 | 7,868,812 | 279 | 1.29% |
| Toshiba | MG08ACA16TEY | 16 | 5,348 | 41.6 | 6,688,214 | 227 | 1.24% |
| Toshiba | MG10ACA20TE | 20 | 14,448 | 5.6 | 2,469,386 | 46 | 0.68% |
| WDC | WUH721414ALE6L4 | 14 | 8,816 | 52.1 | 13,798,204 | 190 | 0.50% |
| WDC | WUH721816ALE6L0 | 16 | 3,069 | 41.2 | 3,848,250 | 28 | 0.74% |
| WDC | WUH721818ALE6L4 | 16 | 26,783 | 26.6 | 21,175,632 | 220 | 0.38% |
| WDC | WUH722222ALE6L4 | 22 | 37,451 | 9.6 | 10,978,372 | 243 | 0.81% |
| Totals | 393,907 | 498,078,717 | 17,707 | 1.30% | |||
Here you can see that the lifetime failure rate continues to hold steady, dipping just slightly from 1.31% last quarter to 1.30% this time around. While the change is minor, it’s notable for its consistency, especially given how dynamic some quarterly swings can be.
This table also gives us a clearer picture of how drive models can be excluded from one analysis but still qualify for another. For instance, the 4TB HGST HMS5C4040ALE640 drive didn’t show up in the Q2 quarterly table, but it does appear here in the lifetime list. That’s because while it didn’t have enough recent data in the past three months to meet the Q2 cutoff, its overall lifetime metrics do meet the bar for inclusion.
Interestingly, four drive models are in that exact situation this quarter: they were left out of the Q2 table due to low activity, but show up here because they’ve crossed the 500-unit, 100,000-day threshold overall. These include Seagate’s ST8000NM000A, ST14000NM000J, ST16000NM002J, and Toshiba’s MG09ACA16TE.
Another pattern worth noting is how many older drives still make the cut. The Backblaze report has 14 different drive models with a capacity of 12TB or less included in this lifetime review, and together, they posted a combined AFR of 1.54%. Here’s how that looks:
| MFG | Model | Size (TB) | Drive Count | Avg. Age (Months) | Drive Days | Failures | AFR |
| HGST | HMS5C4040BLE640 | 4 | 16,349 | 82.7 | 41,138,908 | 448 | 0.40% |
| HGST | HUH728080ALE600 | 8 | 1,218 | 80.2 | 2,970,346 | 92 | 1.13% |
| Seagate | ST8000DM002 | 8 | 10,320 | 98.2 | 30,833,542 | 1,290 | 1.53% |
| Seagate | ST8000NM0055 | 8 | 15,680 | 87 | 41,512,527 | 2,256 | 1.98% |
| Seagate | ST10000NM0086 | 10 | 1,304 | 83.1 | 3,297,748 | 262 | 2.90% |
| Seagate | ST12000NM0007 | 12 | 38,843 | 31.4 | 37,065,961 | 2,264 | 2.33% |
| Seagate | ST12000NM0008 | 12 | 21,037 | 59.2 | 37,903,847 | 2,093 | 2.02% |
| Seagate | ST12000NM000J | 12 | 1,003 | 11.4 | 348,111 | 1 | 0.29% |
| Seagate | ST12000NM001G | 12 | 13,847 | 51 | 21,487,178 | 584 | 0.99% |
| HGST | HMS5C4040ALE640 | 4 | 8,723 | 63.3 | 16,788,181 | 260 | 0.57% |
| HGST | HUH721212ALE600 | 12 | 2,695 | 65.9 | 5,401,641 | 83 | 0.56% |
| HGST | HUH721212ALE604 | 12 | 14,267 | 47 | 20,386,683 | 878 | 1.57% |
| HGST | HUH721212ALN604 | 12 | 11,438 | 69.6 | 24,231,219 | 1398 | 2.11% |
| Seagate | ST14000NM000J | 14 | 11,262 | 50.1 | 17,104,132 | 663 | 1.41% |
| Totals | 44,871 | 119,753,071 | 4,348 | 1.33% | |||
Of those 14 drives, eight have been running for five years or more, and two others are in the 4-year-plus range. That group of ten alone holds a lifetime AFR of 1.42%. What’s impressive is that, even within the eight oldest drives, five have passed the six-year mark. Collectively, they come in at a 1.33% AFR, suggesting that many of these aging drives are still putting in solid work.
A Look at 20TB+ Drives
Backblaze has been casually keeping tabs on the 20TB-and-up drives over the last few reports, but Q2 2025 marks the first time they’ve decided to take a deeper dive. As of now, three models qualify for lifetime analysis in this higher-capacity bracket: Toshiba’s 20TB MG10ACA20TE, WDC’s 22TB WUH722222ALE6L4, and Seagate’s 24TB ST24000NM002H.
With each of the three qualifying models now providing enough lifetime data, we get a clearer picture of their behavior as they age, which helps shed light on potential long-term reliability at these larger sizes.
Conveniently, each drive represents a different manufacturer, which offers a useful (though not perfectly equivalent) point of comparison. While the number of drives and how long they’ve been in use differ too much to make broad conclusions, it’s still worth examining how each model is performing on its own.
Toshiba MG10ACA20TE (20TB)
Backblaze started deploying this drive model 22 months ago, but only saw meaningful adoption within the last year. Early usage numbers were so low that they’re excluded from most calculations, with the report focusing only on the months when drive counts hit a more reliable level.
Here’s the AFR trend over time for the Toshiba model:
| Age in months | AFR | Drive count |
| 0 | 1.44% | 14,407 |
| 1 | 0.36% | 13,694 |
| 2 | 0.62% | 11,808 |
| 3 | 0.42% | 8,594 |
| 4 | 0% | 6,693 |
| 5 | 0.81% | 6,000 |
| 6 | 0.61% | 5,955 |
| 7 | 0% | 4,751 |
| 8 | 0.94% | 3,869 |
| 9 | 1.17% | 3,107 |
| 10 | 1.02% | 2,388 |
| 11 | 0% | 1,034 |
As shown in the graph, the AFR (blue line) and drive count (red line) follow a familiar trend: failure rates shift from month to month, while drive count steadily drops as the drives get older and fewer new units are added into use. Drive numbers are typically highest early on and decline over time as aging models are gradually phased out or replaced.
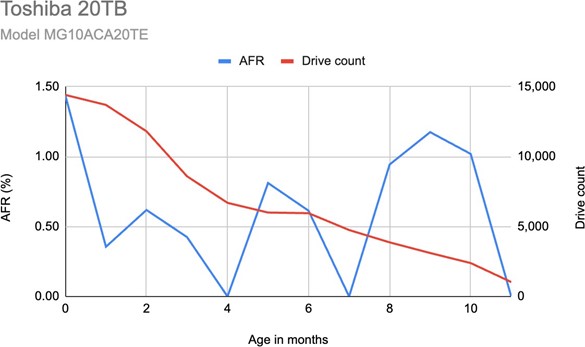
Backblaze explains that they structured the analysis this way to make it easier to evaluate drive behavior across different life stages. This zoomed-in view also mirrors what you might see in classic “bathtub curve” reliability studies, where early failures, stable mid-life, and eventual wear-out are mapped across time.
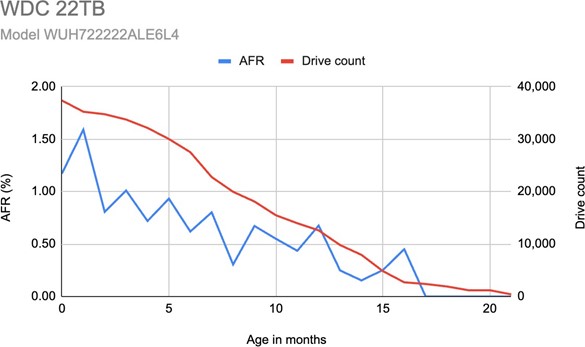
WDC WUH722222ALE6L4 (22TB)
This Western Digital model now has 22 months of operational data and has been scaling out steadily since launch. Overall, its performance has been consistent, with AFR values starting slightly higher but generally tapering off over time.
Here’s the month-by-month breakdown:
| Age in months | AFR | Drive count |
| 0 | 0.57% | 6,067 |
| 1 | 0.18% | 5,800 |
| 2 | 0.12% | 5,456 |
| 3 | 0.17% | 5,102 |
| 4 | 0.23% | 4,648 |
| 5 | 0.26% | 4,271 |
| 6 | 0.07% | 3,896 |
| 7 | 0.14% | 3,558 |
| 8 | 0.06% | 3,190 |
| 9 | 0.20% | 2,776 |
| 10 | 0.29% | 2,436 |
| 11 | 0.09% | 2,082 |
| 12 | 0.34% | 1,777 |
| 13 | 0.28% | 1,483 |
| 14 | 0.00% | 1,257 |
| 15 | 0.29% | 1,025 |
| 16 | 0.00% | 788 |
| 17 | 0.00% | 577 |
| 18 | 0.00% | 403 |
| 19 | 0.00% | 261 |
| 20 | 0.00% | 157 |
| 21 | 0.00% | 80 |
Overall, the WDC 22TB model performs exceptionally well. Across the 22 observed months, AFR values remain at or below 0.57% and generally trend downward as the drive count declines. There are no signs of concerning spikes, and the consistency should inspire confidence in its long-term prospects.
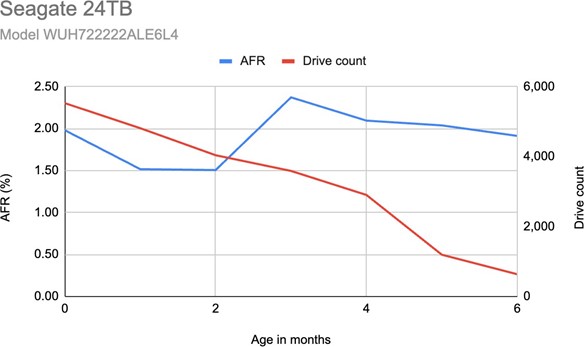
Seagate 24TB ST24000NM002H
Compared to the WDC model, Seagate’s 24TB drive shows a bit more fluctuation in AFR, especially in the earlier months. While not overly alarming, the data does suggest that this model may still be stabilizing or reacting to workload variability in a Backblaze environment.
| Age in months | AFR | Drive count |
|---|---|---|
| 0 | 1.98% | 5,528 |
| 1 | 1.52% | 4,812 |
| 2 | 1.51% | 4,039 |
| 3 | 2.37% | 3,590 |
| 4 | 2.10% | 2,903 |
| 5 | 2.04% | 1,194 |
| 6 | 1.91% | 636 |
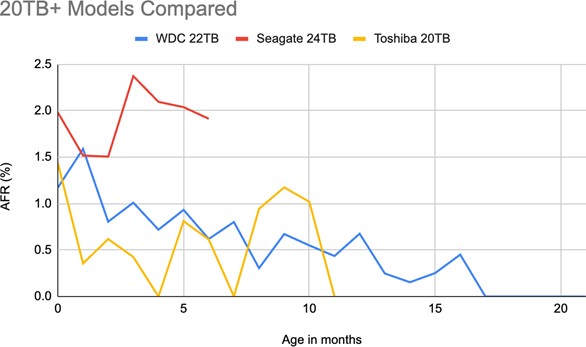
Comparing the 20TB+ Models
At the end of their report, Backblaze compares the AFR trends of all three high-capacity drives. When plotted together, a few things become clear:
- Toshiba 20TB starts with a high AFR in its first month but quickly drops and remains relatively steady.
- WDC 22TB shows one of the cleanest curves, with a smooth decline in AFR as drives age.
- Seagate 24TB, while still within acceptable limits, demonstrates more frequent AFR fluctuations.
While all three drives are holding up well so far, the WDC model is showing the most consistent reliability across nearly two years of use.
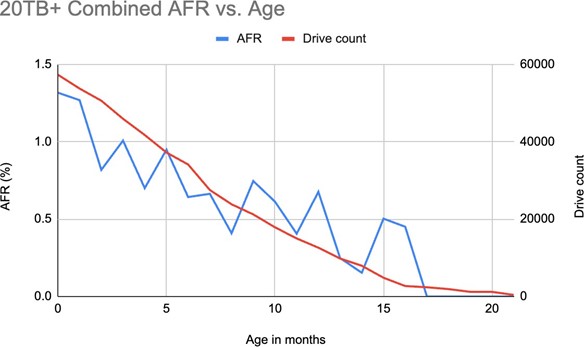
Overall AFR Trend for 20TB+ Drives
Backblaze also includes a combined AFR vs. age chart for all 20TB+ models. As expected, the overall AFR starts slightly elevated but trends downward over time, following a curve similar to the classic “bathtub” reliability model: early failures, stabilization, then eventual wear. This bird’s-eye view suggests that the higher-capacity Backblaze fleet is settling into maturity without any red flags, except a potentially slower curve for Seagate. While it’s still early in the lifecycle of these models, the results so far are promising.
Comparing 20TB+ vs. 14–16TB Drive Pools
When Backblaze considered whether it was worth spotlighting the 20TB+ drives as a group, the key challenge was figuring out how to make the comparison meaningful. Ultimately, they chose to stack them up against the 14–16TB drives. This wasn’t because it’s a perfect match but because that group has solid data coverage and represents the last major wave of drive models added to the fleet.
One thing to point out is that when the 20TB drives were grouped into a single pool, some previously excluded data was brought back in. For example, at the 21-month mark, Toshiba’s 20TB model had just one active drive. That lone unit was included alongside the 399 drives from the WDC model, giving a clean round total of 400 drives for that age group and allowing an average failure rate (AFR) to be calculated for the pool.
20TB+ Pool (AFR and Drive Count)
Below is the table showing how the 20TB+ pool performed over the first 22 months:
| Age in months | AFR | Drive count |
|---|---|---|
| 0 | 1.32% | 57,298 |
| 1 | 1.27% | 53,725 |
| 2 | 0.86% | 50,589 |
| 3 | 1.01% | 45,914 |
| 4 | 0.70% | 40,996 |
| 5 | 0.95% | 37,202 |
| 6 | 0.64% | 34,100 |
| 7 | 0.66% | 27,513 |
| 8 | 0.41% | 23,824 |
| 9 | 0.75% | 21,207 |
| 10 | 0.61% | 17,873 |
| 11 | 0.41% | 14,999 |
| 12 | 0.68% | 12,601 |
| 13 | 0.25% | 9,808 |
| 14 | 0.15% | 7,938 |
| 15 | 0.50% | 4,839 |
| 16 | 0.45% | 2,701 |
| 17 | 0% | 2,383 |
| 18 | 0% | 1,905 |
| 19 | 0% | 1,193 |
| 20 | 0% | 1,193 |
| 21 | 0% | 400 |
That data gives us a pretty clean trend line:
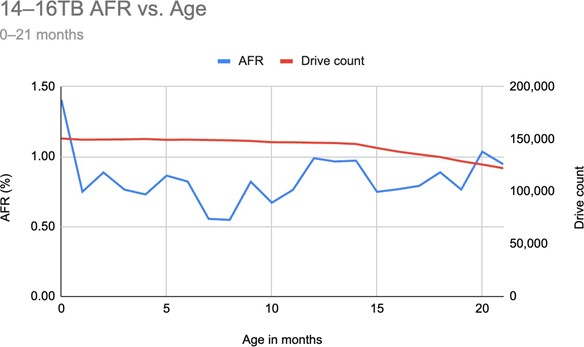
Comparison with 14–16TB Drives
To make a fairer comparison, the 14–16TB drives were examined over the same 21-month window. This group has a much deeper history (these drives have been in rotation for almost seven years), so while they aren’t a one-to-one match with the newer 20TB models, their long-term usage provides a valuable benchmark.
| Age in months | AFR | Drive count |
|---|---|---|
| 0 | 1.41% | 150,551 |
| 1 | 0.75% | 149,435 |
| 2 | 0.89% | 149,568 |
| 3 | 0.76% | 149,754 |
| 4 | 0.73% | 150,100 |
| 5 | 0.86% | 149,296 |
| 6 | 0.82% | 149,479 |
| 7 | 0.55% | 149,137 |
| 8 | 0.55% | 148,825 |
| 9 | 0.62% | 148,236 |
| 10 | 0.67% | 147,053 |
| 11 | 0.76% | 146,958 |
| 12 | 0.99% | 146,524 |
| 13 | 0.97% | 146,249 |
| 14 | 0.97% | 145,331 |
| 15 | 0.75% | 141,521 |
| 16 | 0.77% | 138,066 |
| 17 | 0.79% | 135,417 |
| 18 | 0.89% | 132,924 |
| 19 | 0.76% | 128,915 |
| 20 | 1.04% | 125,777 |
| 21 | 0.95% | 122,273 |
Visually, the line chart for this group shows a smoother, more consistent pattern over time.
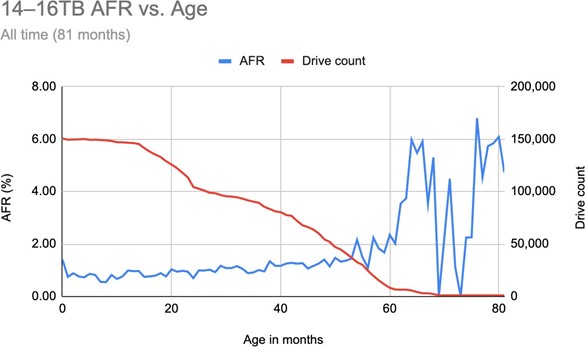
That said, here is the same comparison, but over a ~7-year period:
How Do They Stack Up?
When you match up the two pools month for month, the 20TB+ drives are holding their own, and in some cases, slightly outperforming expectations. But it’s important to remember the 14–16TB pool benefits from a much higher and more consistent drive count, which naturally smooths out the noise. Still, it’s a helpful way to see how these newer high-capacity drives are progressing in the early stages of deployment.
Ultimately, Backblaze still needs time before the 20TB+ class of drives tells the whole story in their reports. These newer models are still ramping up in deployment and haven’t yet aged into the sweet spot for reliable long-term conclusions. As Backblaze adds more of them to their fleet, we’ll be able to better observe how they hold up over time.
The 14–16TB range is already giving valuable insights. These drives have been in use long enough to show wear patterns that match what you’d expect around the 4- to 5-year mark. That said, when you look at their overall AFRs next to the 12TB and smaller drive pool, which has continued to perform exceptionally well in terms of long-term reliability, the larger drives don’t fare quite as well.
It’s not unreasonable to suspect that the same aging dynamics we saw in the smaller drives are at play here, too. In fact, the Backblaze table of 14–16TB drives currently in operation supports that idea, especially when you isolate the models that are four years or older.
Here’s that breakdown:
| MFG | Model | Size (TB) | Drive Count | Avg. Age (Months) | Drive Days | Failures | AFR |
| Seagate | ST14000NM000G | 14 | 11,252 | 50.1 | 17,140,132 | 663 | 1.41% |
| Seagate | ST14000NM0138 | 14 | 1,690 | 47.1 | 2,423,426 | 391 | 5.89% |
| Seagate | ST16000NM001G | 16 | 34,755 | 32.8 | 34,692,793 | 684 | 0.72% |
| Toshiba | MG07ACA14TA | 14 | 39,387 | 54.1 | 64,805,775 | 1,828 | 1.03% |
| Toshiba | MG07ACA14TEY | 14 | 954 | 33.5 | 97,815 | 39 | 1.46% |
| Toshiba | MG08ACA16TA | 16 | 40,996 | 21.7 | 27,000,887 | 858 | 1.16% |
| Toshiba | MG08ACA16TE | 16 | 6,198 | 41.7 | 7,868,882 | 279 | 1.29% |
| Toshiba | MG08ACA16TEY | 16 | 5,348 | 41.6 | 6,688,214 | 227 | 1.24% |
| WDC | WUH721414ALE6L4 | 14 | 8,816 | 52.1 | 13,978,204 | 190 | 0.50% |
| WDC | WUH721816ALE6L0 | 16 | 3,069 | 41.2 | 3,848,250 | 78 | 0.74% |
| WDC | WUH721818ALE6L4 | 16 | 26,783 | 26.0 | 21,175,632 | 220 | 0.38% |
| Totals | 179,248 | 200,594,010 | 5,457 | 0.99% | |||
The overall AFR across these models currently sits just under 1%. Again, this table reflects only drives still in service, not every 14–16TB unit Backblaze ever deployed, so it is not a complete historical view. Treat it as a snapshot of how active 14–16TB drives are performing right now.
Conclusion
Overall, the Backblaze Q2 2025 report offers a valuable look at how various drive capacities are aging across a massive dataset. While the newer 20TB+ models still need time and volume to reveal meaningful patterns, the data on 12TB and smaller drives remains encouraging, and the 14–16TB range is starting to show typical signs of wear. As always, the whole picture will continue to evolve with time, but for now, this snapshot provides a valuable update on how these drives are holding up in real-world conditions.
For a complete look at the Drive Stats data, visit the Backblaze official Drive Stats page.
Engage with StorageReview
Newsletter | YouTube | Podcast iTunes/Spotify | Instagram | Twitter | TikTok | RSS Feed