

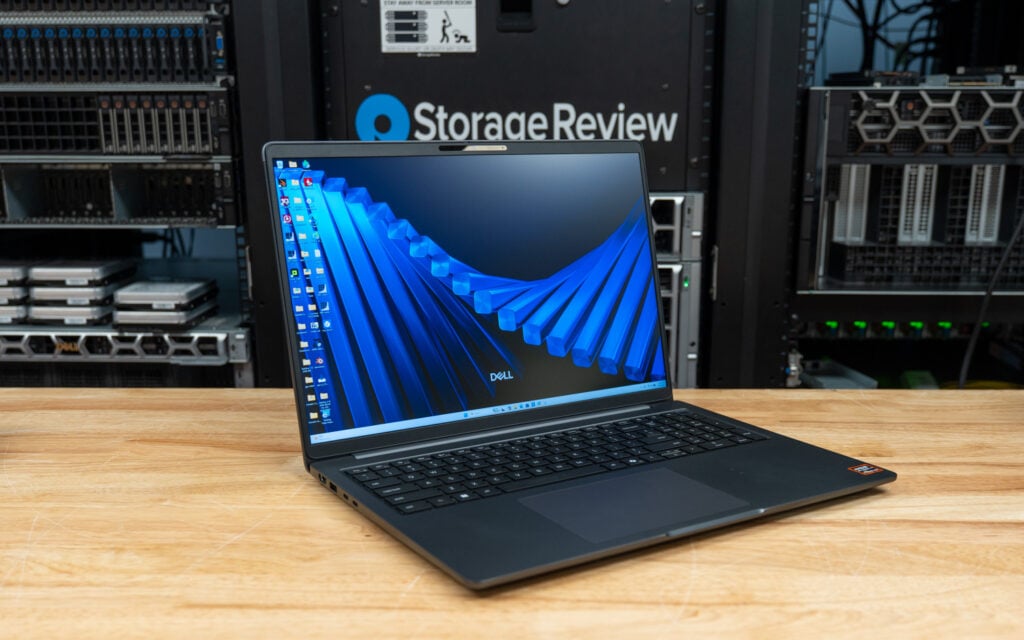
The Dell Pro 5 16 is the large-screen entry in Dell’s commercial Pro laptop line, and the one that leads on value rather than portability. Our review unit pairs the AMD Ryzen AI 9 HX PRO 470 (12 cores, 24 threads, 55 TOPS NPU) with AMD Radeon 890M integrated graphics, 64 GB of DDR5-5600 RAM, a 1 TB SSD, and a 16-inch WQXGA display. At $4,648 as configured (Dell.com single-unit, before the volume discounts most fleets actually pay), it comes in below the rest of the Pro family we tested.
To be fair, this is a commercial fleet machine. The questions that matter are sustained productivity, manageability, serviceability, battery, and total cost of ownership. It ships with AMD PRO manageability, Dell SafeBIOS and SafeID, quantum-resistant BIOS verification, and ProSupport Next Business Day Onsite coverage; the details IT buyers weigh more heavily than a spec-sheet clock speed.
What makes the Pro 5 16 interesting is that it runs the same silicon as the 14-inch Pro 7 AMD but changes two variables: it moves to slower DDR5-5600 memory, versus LPDDR5x-8533 in the thinner units, and it puts that chip in a larger 16-inch chassis. Those two choices define its performance character, and not in the same direction. The larger chassis lets the Ryzen AI 9 HX PRO 470 maintain higher sustained clocks; the Pro 5 16 posts the strongest multi-core Cinebench result among the four Dell units we tested. The slower memory is the ceiling for its integrated graphics, and the 16-inch panel is why it finishes last in the group on battery life. Paired with the full numeric keypad, this is a desk-first productivity machine: strong at sustained CPU work and everyday multitasking, weaker where memory bandwidth or all-day unplugged runtime matter most.
Design and Build
With its 16-inch screen and full-size keyboard, the Dell Pro 5 16 is the largest laptop in this group, measuring 14.12 inches wide, 9.98 inches deep, and up to 0.75 inches thick, with a starting weight of 4.02 pounds. That is still a noticeable jump from the 14-inch models, especially once the charger is added to a bag, but the larger footprint pays off with more screen space and a roomier keyboard.
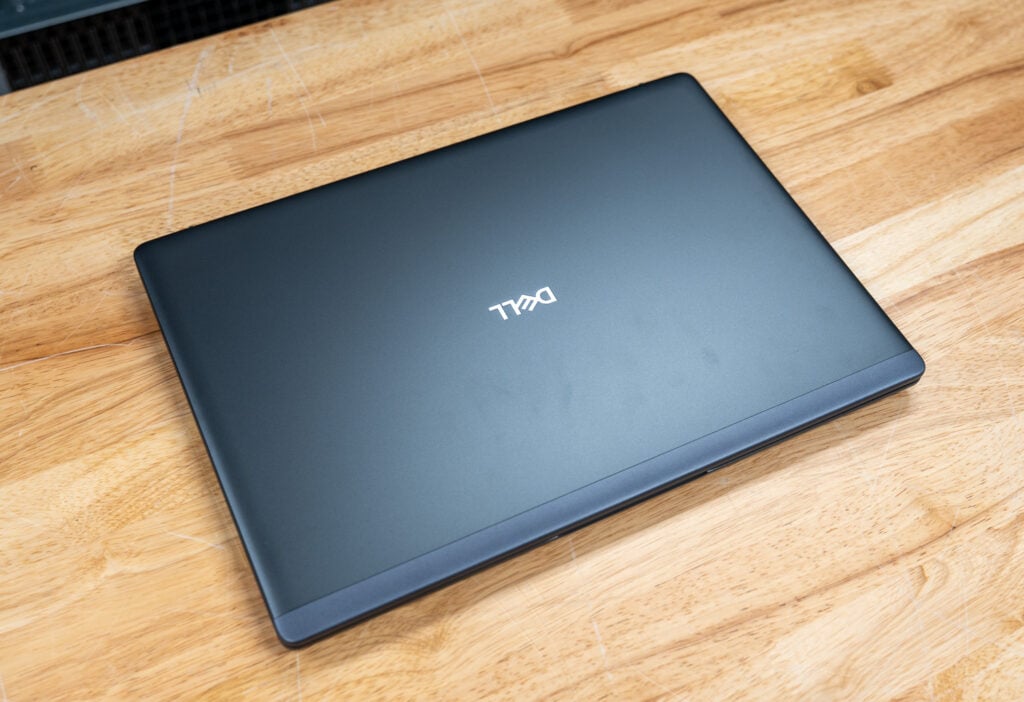
The Magnetite aluminum chassis has a dark finish with a light texture across the lid, keyboard deck, and bottom cover. It has the usual plain, business-oriented appearance with little beyond the silver Dell logo. The finish does a good job of hiding fingerprints, too.
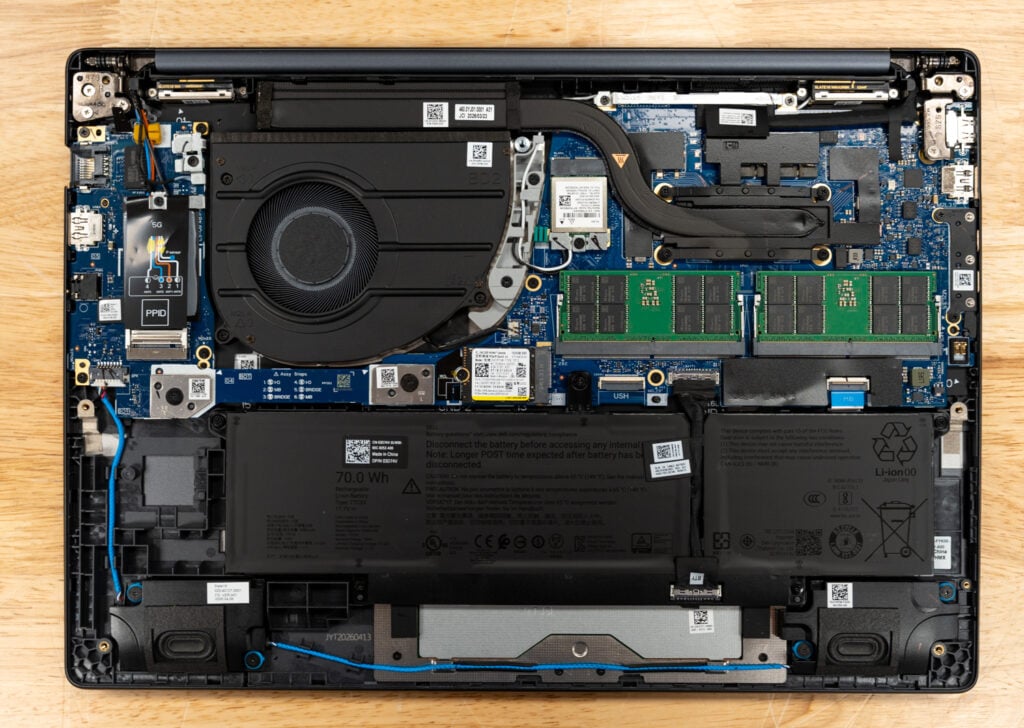
Once the bottom cover is removed, the two DDR5 SODIMM slots, M.2 SSD, wireless card, cooling fan, and 70Wh battery are all accessible. Both memory modules can be replaced, and the battery is also designed for customer replacement, giving businesses more options for repairs and upgrades as the laptop ages. For cooling, it features a single large fan and heat pipe, with a wide intake grille covering much of the underside and an exhaust vent running along the rear.
Display and Input
Our review build has the upgraded 16-inch WQXGA display, with a 2560 x 1600 resolution, variable refresh rate support, 500-nit brightness, and full sRGB coverage. The combination gives Windows, photos, and video a sharper and more colorful appearance than Dell’s lower-resolution display options. Its anti-glare coating also helps reduce reflections under office lighting, while Low Blue Light technology is included for longer work sessions.
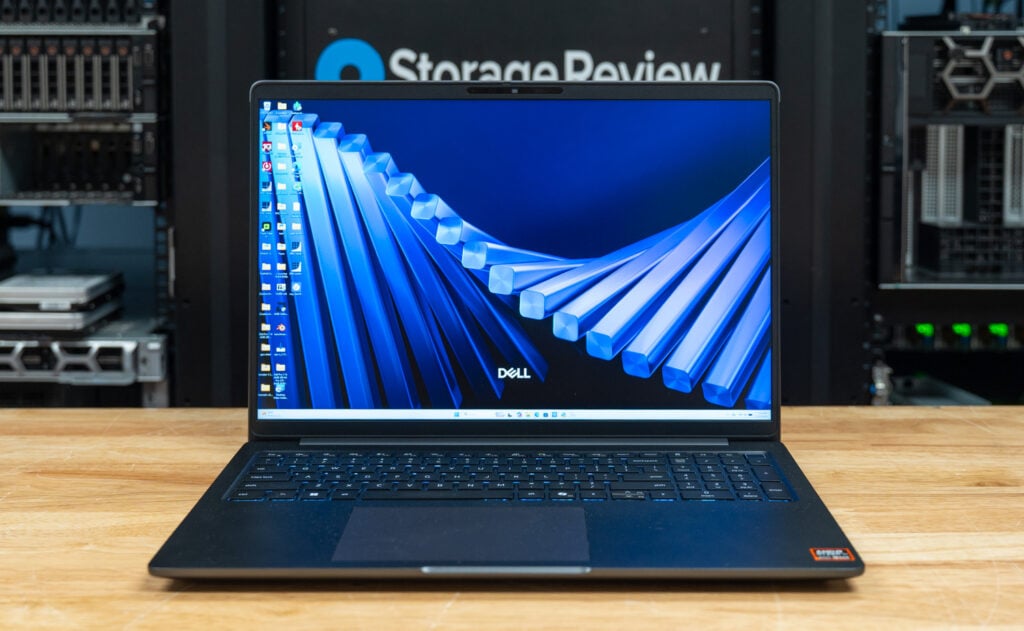
Having a 16:10 panel gave us plenty of vertical room for documents, spreadsheets, web pages, and applications with crowded interfaces. The extra width is also useful when working with two windows side by side, particularly when the laptop is being used away from an external monitor. Our panel does not support touch, but that likely isn’t too big of a deal for the business users this configuration is built for.
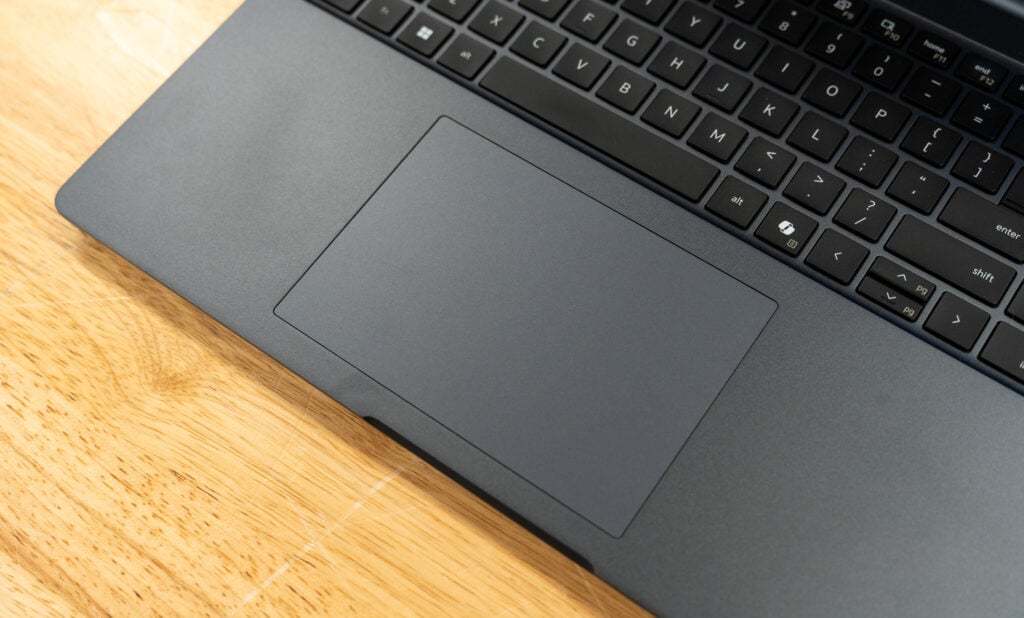
Dell uses the wider keyboard deck to include a dedicated numeric keypad, which is a useful difference from the three 14-inch laptops in this review group. Anyone who regularly works with spreadsheets, accounting software, or large sets of numerical data should find it much quicker than relying on the number row. The Mini-LED backlighting provides even illumination around the keys, and the keyboard also includes a Copilot key and a fingerprint reader built into the power button.
Below the keyboard is a large clickpad that provides plenty of room for navigation and multi-finger gestures. Since the number pad shifts the main typing area to the left, the clickpad is also positioned left of the laptop’s centerline. An 8MP HDR camera is located above the display with infrared support, presence detection, Windows Hello facial recognition, and a physical privacy shutter.
Ports and Connectivity
The Dell Pro 5 16 offers a good selection of ports across both sides of the chassis. On the left are HDMI 2.1, one USB 3.2 Gen 1 Type-A port, and two 40Gbps Thunderbolt 4 Type-C ports with DisplayPort 2.1 and USB Power Delivery. Either Type-C port can be used with the included 65W charger, leaving some flexibility when deciding where to route the cable on a desk.
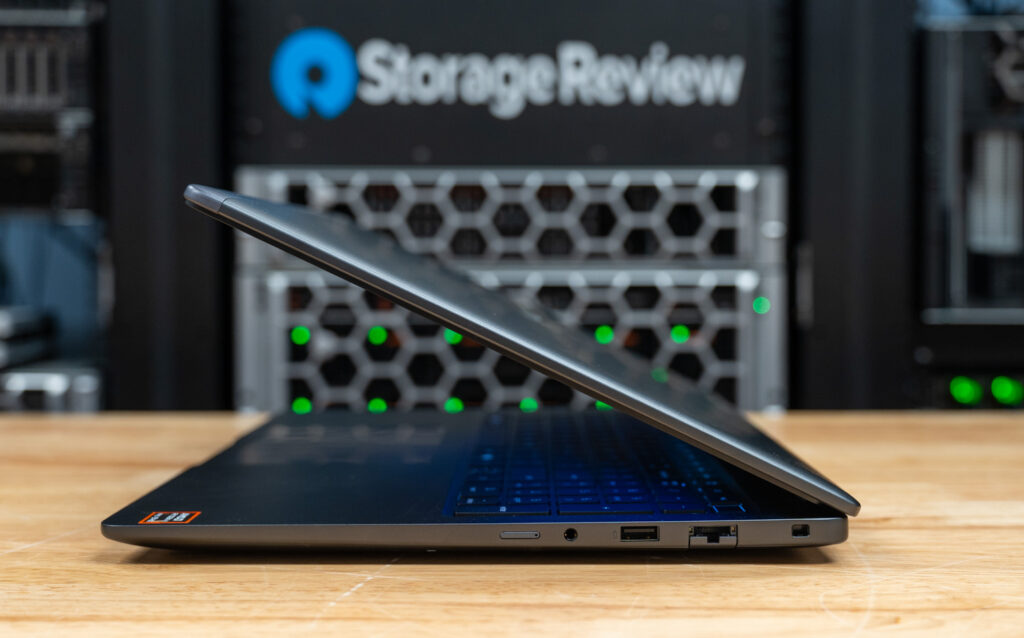
Along the right side are a second USB 3.2 Gen 1 Type-A port with PowerShare, a global headset jack, Gigabit Ethernet, and a Kensington wedge-shaped lock slot. Smart-card and nano-SIM slots are available as optional additions, depending on the selected configuration. The built-in RJ45 connection is particularly useful in an office or test environment, where a wired network connection may be preferable to carrying a USB Ethernet adapter.
Wireless connectivity includes a MediaTek MT7925 adapter supporting Wi-Fi 7 and Bluetooth 5.4. The 70Wh battery supports Dell ExpressCharge and is ExpressCharge Boost capable.
Security and Manageability
Business buyers will find most of the security and fleet-management features they are likely to need already included in this configuration. The Ryzen AI 9 HX PRO 470 brings AMD PRO management and security features, while Dell Management Portal can work with Microsoft Intune to help IT teams configure systems, distribute updates, and oversee a larger device fleet.
Dell Pro 5 16 (AMD) Specifications
| Specification | Dell Pro 5 16 (P516265) |
|---|---|
| Platform Overview | |
| Processor | AMD Ryzen AI 9 HX PRO 470 12 cores / 24 threads, up to 5.2 GHz 55 TOPS NPU (Copilot+ PC) |
| Graphics | AMD Radeon 890M (integrated) |
| Operating System | Windows 11 Pro (Copilot+ PC) |
| Memory and Storage | |
| Memory | 64 GB DDR5-5600 (2 × 32 GB), dual-channel |
| Storage | 1 TB SSD (SanDisk PC SN5100S) |
| Display and Camera | |
| Display | 16″ WQXGA (2560 × 1600), non-touch, VRR 500 nits, 100% sRGB, anti-glare, Low Blue Light |
| Camera | 8 MP + IR (Windows Hello) |
| Connectivity and Input | |
| Wireless | MediaTek Wi-Fi 7 MT7925, Bluetooth 5.4 |
| Keyboard | US English mini-LED backlit with numeric keypad |
| Ports | 2x Thunderbolt 4 40Gbps Type-C (DisplayPort 2.1, Power Delivery); 2x USB 3.2 Gen 1 Type-A (one with PowerShare); HDMI 2.1; Gigabit Ethernet (RJ45); global headset jack; wedge-shaped lock slot. Optional smart-card reader and nano-SIM slot. |
| Security and Manageability | |
| Security | Fingerprint reader Dell SafeBIOS, SafeID, Trusted Device Quantum-resistant BIOS verification |
| Manageability | AMD PRO manageability Dell Management Portal, Microsoft Intune |
| Power and Physical | |
| Battery | 3-cell, 70 Wh, ExpressCharge / ExpressCharge Boost |
| Power Adapter | 65 W USB-C |
| Weight / Dimensions | From 4.02 lb; 14.12 x 9.98 x up to 0.75 in. |
| Warranty and Pricing | |
| Service | Dell ProSupport, Next Business Day Onsite, 36 months |
| Base Price | $2,089 |
| Price as Tested | $4,648 (Dell.com single-unit, no discount) |
Performance Testing
Test Systems
| Specification | Dell Pro 5 16 (AMD) | Dell Pro 7 14 (AMD) | Dell Pro 7 14 (Intel) | Dell Pro 5 14 (Intel) |
|---|---|---|---|---|
| CPU | Ryzen AI 9 HX PRO 470 (12C/24T) | Ryzen AI 9 HX PRO 470 (12C/24T) | Core Ultra 7 366H (16C) | Core Ultra X7 368H (16C) |
| GPU | Radeon 890M | Radeon 890M | Intel Graphics | Intel Arc B390 |
| Memory | 64 GB DDR5-5600 | 64 GB LPDDR5x-8533 | 64 GB LPDDR5x-8533 | 64 GB LPCAMM2-8533 |
| Storage | SanDisk PC SN5100S 1 TB | Samsung BM9C1a 1 TB | SK hynix PCB01 1 TB | SK hynix PCB01 1 TB |
| Display | 16″ WQXGA | 14″ WUXGA | 14″ WUXGA | 14″ WUXGA |
| Price as Tested | $4,648 | $5,377 | $5,600 | $5,492 |
UL Procyon: AI Computer Vision
The Procyon AI Computer Vision Benchmark measures AI inference performance across CPUs, GPUs, and dedicated accelerators using a range of state-of-the-art neural networks. It evaluates tasks such as image classification, object detection, segmentation, and super-resolution using models including MobileNet V3, Inception V4, YOLO V3, DeepLab V3, Real ESRGAN, and ResNet 50. Tests are run on multiple inference engines, including NVIDIA TensorRT, Intel OpenVINO, Qualcomm SNPE, Microsoft Windows ML, and Apple Core ML, providing a broad view of hardware and software efficiency. Results are reported for float- and integer-optimized models, providing a consistent, practical measure of machine vision performance for professional workloads.
The Dell Pro 5 16 scored 91 in the CPU test, placing it ahead of the Pro 7 14 AMD at 77 but behind both Intel systems. Its Ryzen processor completed every model faster than the same chip in the Pro 7 14, including YOLO V3 at 99.38 ms versus 122.35 ms and REAL-ESRGAN at 4,504.35 ms versus 5,383.21 ms. Its Radeon 890M raised the GPU score to 214, edging past the Pro 7 14 Intel at 205 but trailing the Pro 7 14 AMD at 243 and the Pro 5 14 Intel at 398. The smaller AMD laptop’s faster LPDDR5x-8533 memory appears to help its integrated graphics, while the Arc B390 gives the Pro 5 14 Intel a large advantage in this test.
| CPU Results (average time in ms) | Dell Pro 5 16 (AMD Ryzen AI 9 HX PRO 470 12C) | Dell Pro 7 14 (AMD Ryzen AI 9 HX PRO 470 12C) | Dell Pro 7 14 (Intel Core Ultra 7 366H 16C) | Dell Pro 5 14 (Intel Core Ultra X7 368H 16C) |
|---|---|---|---|---|
| AI Computer Vision Overall Score | 91 | 77 | 121 | 119 |
| MobileNet V3 | 1.57 ms | 1.79 ms | 1.24 ms | 1.09 ms |
| ResNet 50 | 13.64 ms | 16.46 ms | 11.57 ms | 10.11 ms |
| Inception V4 | 40.43 ms | 51.10 ms | 34.01 ms | 29.77 ms |
| DeepLab V3 | 69.73 ms | 74.74 ms | 37.98 ms | 50.18 ms |
| YOLO V3 | 99.38 ms | 122.35 ms | 81.22 ms | 112.64 ms |
| REAL-ESRGAN | 4,504.35 ms | 5,383.21ms | 3,163.45 ms | 2,884.51 ms |
| GPU Results (average time in ms) | Dell Pro 5 16 (AMD Ryzen AI 9 HX PRO 470 12C) | Dell Pro 7 14 (AMD Ryzen AI 9 HX PRO 470 12C) | Dell Pro 7 14 (Intel Core Ultra 7 366H 16C) | Dell Pro 5 14 (Intel Core Ultra X7 368H 16C) |
|---|---|---|---|---|
| AI Computer Vision Overall Score | 214 | 243 | 205 | 398 |
| MobileNet V3 | 1.56 ms | 1.17 ms | 1.04 ms | 0.84 ms |
| ResNet 50 | 8.76 ms | 7.93 ms | 6.52 ms | 2.94 ms |
| Inception V4 | 22.46 ms | 20.06 ms | 20.72 ms | 8.38 ms |
| DeepLab V3 | 38.40 ms | 34.04 ms | 26.53 ms | 17.54 ms |
| YOLO V3 | 23.56 ms | 21.92 ms | 43.07 ms | 19.14 ms |
| REAL-ESRGAN | 570.35 ms | 536.81 ms | 1,309.49 ms | 562.87 ms |
UL Procyon: AI Text Generation
The Procyon AI Text Generation Benchmark streamlines LLM performance testing by providing a concise, consistent evaluation method. It enables repeated testing across multiple LLM models while minimizing the complexity of large models and the number of variables. Developed with AI hardware leaders, it optimizes the use of local AI accelerators to deliver more reliable, efficient performance assessments.
Local text generation was a weak area for the Dell Pro 5 16, as it finished last with all four language models. Scores ranged from 306 with Llama3 to 371 with Phi, while the Pro 7 14 AMD reached 345 and 427 with the same processor. The difference also appeared in generation speed, with the Dell Pro 5 16 producing 27.163 tokens per second in Phi and 15.050 tokens per second in Llama3, compared with 30.492 and 16.725 tokens per second from the Pro 7 14 AMD. Faster memory gave the other systems an advantage in these bandwidth-heavy local AI workloads, with Intel’s Arc B390 producing the best results by a wide margin.
| UL Procyon: AI Text Generation | Dell Pro 5 16 (AMD Ryzen AI 9 HX PRO 470 12C) | Dell Pro 7 14 (AMD Ryzen AI 9 HX PRO 470 12C) | Dell Pro 7 14 (Intel Core Ultra 7 366H 16C) | Dell Pro 5 14 (Intel Core Ultra X7 368H 16C) |
|---|---|---|---|---|
| Phi | ||||
| Phi Overall Score | 371 | 427 | 689 | 904 |
| Phi Output Time To First Token | 5.052 s | 4.286 s | 1.843 s | 1.158 s |
| Phi Output Tokens Per Second | 27.163 tokens/s | 30.492 tokens/s | 34.172 tokens/s | 36.952 tokens/s |
| Phi Overall Duration | 135.343 s | 118 s | 92.273 s | 81.304 s |
| Mistral | ||||
| Mistral Overall Score | 346 | 389 | 525 | 716 |
| Mistral Output Time To First Token | 6.929 s | 6.060 s | 3.778 s | 2.195 s |
| Mistral Output Tokens Per Second | 18.174 tokens/s | 20.125 tokens/s | 22.843 tokens/s | 24.724 tokens/s |
| Mistral Overall Duration | 196.185 s | 176 s | 143.831 s | 123.773 s |
| Llama3 | ||||
| Llama3 Overall Score | 306 | 345 | 509 | 708 |
| Llama3 Output Time To First Token | 6.518 s | 5.707s | 2.992 s | 1.657 s |
| Llama3 Output Tokens Per Second | 15.050 tokens/s | 16.725 tokens/s | 19.104 tokens/s | 20.421 tokens/s |
| Llama3 Overall Duration | 224.176 s | 199 s | 161.290 s | 142.814 s |
| Llama2 | ||||
| Llama2 Overall Score | 329 | 367 | 530 | 641 |
| Llama2 Output Time To First Token | 11.089 s | 10.307 s | 5.412 s | 4.082 s |
| Llama2 Output Tokens Per Second | 8.878 tokens/s | 10.260 tokens/s | 11.230 tokens/s | 12.397 tokens/s |
| Llama2 Overall Duration | 381.464 s | 334 s | 278.109 s | 245.572 s |
UL Procyon: AI Image Generation
The Procyon AI Image Generation Benchmark provides a consistent and accurate method for measuring AI inference performance across a range of hardware, from low-power NPUs to high-end GPUs. It includes three tests: Stable Diffusion XL (FP16) for high-end GPUs, Stable Diffusion 1.5 (FP16) for moderately powerful GPUs, and Stable Diffusion 1.5 (INT8) for low-power devices. The benchmark uses the optimal inference engine for each system, ensuring fair and comparable results.
The Dell Pro 5 16 stayed close to the Pro 7 14 AMD and Pro 7 14 Intel in the two Stable Diffusion 1.5 tests. It scored 255 in FP16 and generated each image in 24.474 seconds, while its INT8 score of 3,598 was the best of those three laptops by a narrow margin. Stable Diffusion XL was far more demanding, requiring 215.530 seconds per image for a score of 173, which placed it just behind the Pro 7 14 AMD and well behind both Intel systems. The Radeon 890M works reasonably well with Stable Diffusion 1.5, but generation times become lengthy with the larger SDXL model.
| UL Procyon: AI Image Generation | Dell Pro 5 16 (AMD Ryzen AI 9 HX PRO 470 12C) | Dell Pro 7 14 (AMD Ryzen AI 9 HX PRO 470 12C) | Dell Pro 7 14 (Intel Core Ultra 7 366H 16C) | Dell Pro 5 14 (Intel Core Ultra X7 368H 16C) |
|---|---|---|---|---|
| Stable Diffusion 1.5 (FP16) | ||||
| Stable Diffusion 1.5 (FP16) – Overall Score | 255 | 247 | 258 | 635 |
| Stable Diffusion 1.5 (FP16) – Overall Time | 391.577 s | 404.455 s | 386.614 s | 157.296 s |
| Stable Diffusion 1.5 (FP16) – Image Generation Speed | 24.474 s/image | 25.278 s/image | 24.163 s/image | 9.831 s/image |
| Stable Diffusion 1.5 (INT8) | ||||
| Stable Diffusion 1.5 (INT8) – Overall Score | 3,598 | 3,521 | 3,575 | 7,693 |
| Stable Diffusion 1.5 (INT8) – Overall Time | 69.478 s | 70.985 s | 69.911 s | 32.495 s |
| Stable Diffusion 1.5 (INT8) – Image Generation Speed | 8.685 s/image | 8.873 s/image | 8.739 s/image | 4.062 s/image |
| Stable Diffusion XL (FP16) | ||||
| Stable Diffusion XL (FP16) – Overall Score | 173 | 177 | 268 | 646 |
| Stable Diffusion XL (FP16) – Overall Time | 3,448.478 s | 3,379.388 s | 2,230.563 s | 928.747 s |
| Stable Diffusion XL (FP16) – Image Generation Speed | 215.530 s/image | 211.212 s/image | 139.410 s/image | 58.047 s/image |
PCMark 10
PCMark 10 measures general system performance across everyday work such as web browsing, video conferencing, spreadsheets, writing, photo editing, and rendering. Higher scores are better.
The Dell Pro 5 16 posted an overall PCMark 10 score of 8,268, finishing only 170 points behind the Pro 7 14 Intel and 31 points ahead of the Pro 7 14 AMD. Its Productivity score of 14,322 beat both Intel laptops and fell only 44 points behind the smaller AMD system, while Digital Content Creation reached 9,852 and placed second. This was a strong showing across the office, communication, and creative applications represented in PCMark 10.
| PCMark 10 (higher is better) | Dell Pro 5 16 (AMD Ryzen AI 9 HX PRO 470 12C) | Dell Pro 7 14 (AMD Ryzen AI 9 HX PRO 470 12C) | Dell Pro 7 14 (Intel Core Ultra 7 366H 16C) | Dell Pro 5 14 (Intel Core Ultra X7 368H 16C) |
|---|---|---|---|---|
| Overall | 8,268 | 8,237 | 8,438 | 7,945 |
| Essentials | 10,870 | 10,783 | 10,981 | 10,751 |
| Productivity | 14,322 | 14,366 | 13,992 | 13,821 |
| Digital Content Creation | 9,852 | 9,792 | 10,610 | 9,158 |
Geekbench 6
Geekbench 6 measures processor performance using a mix of common tasks, with separate scores for single-core and multi-core workloads. Higher scores are better.
The Dell Pro 5 16 recorded the highest Geekbench 6 single-core score in the group at 2,989, narrowly beating the Pro 5 14 Intel at 2,968. Its multi-core score of 14,348 placed it last, although it was only about 3% behind the Pro 7 14 AMD at 14,768. Both Intel systems finished above 16,700, giving them a stronger result in Geekbench’s collection of relatively short multi-core workloads.
| Geekbench 6 (higher is better) | Dell Pro 5 16 (AMD Ryzen AI 9 HX PRO 470 12C) | Dell Pro 7 14 (AMD Ryzen AI 9 HX PRO 470 12C) | Dell Pro 7 14 (Intel Core Ultra 7 366H 16C) | Dell Pro 5 14 (Intel Core Ultra X7 368H 16C) |
|---|---|---|---|---|
| Single-Core | 2,989 | 2,888 | 2,862 | 2,968 |
| Multi-Core | 14,348 | 14,768 | 16,787 | 16,874 |
Cinebench R23 and 2024
Cinebench measures how quickly the processor can render a complex scene, with separate tests for single-core and multi-core performance. Higher scores are better.
Longer CPU rendering tests allowed the Dell Pro 5 16 to take better advantage of its larger cooling system. It led Cinebench R23 multi-core with 18,764, beating the Pro 5 14 Intel by roughly 11% and the Pro 7 14 AMD by nearly 24%, while its single-core score of 2,029 was only 14 points behind the leader. Cinebench 2024 widened the multi-core gap, with the Dell Pro 5 16 scoring 1,055 compared with 847 for the Pro 7 14 AMD and 807 for the Pro 5 14 Intel. These results show how much better the Ryzen AI 9 HX PRO 470 performs during sustained rendering when installed in the larger 16-inch chassis.
| Cinebench (higher is better) | Dell Pro 5 16 (AMD Ryzen AI 9 HX PRO 470 12C) | Dell Pro 7 14 (AMD Ryzen AI 9 HX PRO 470 12C) | Dell Pro 7 14 (Intel Core Ultra 7 366H 16C) | Dell Pro 5 14 (Intel Core Ultra X7 368H 16C) |
|---|---|---|---|---|
| R23 Single-Core | 2,029 | 1,946 | 2,043 | 2,010 |
| R23 Multi-Core | 18,764 | 15,173 | 14,640 | 16,915 |
| 2024 Single-Core | 119 | 105 | 116 | 122 |
| 2024 Multi-Core | 1,055 | 847 | 683 | 807 |
7-Zip Compression
The 7-Zip benchmark measures how quickly the processor can compress and decompress data using multiple threads. Higher GIPS scores are better.
The Dell Pro 5 16 led the 7-Zip benchmark with a total rating of 103.9 GIPS. That placed it roughly 15% ahead of the Pro 7 14 AMD, 16% ahead of the Pro 5 14 Intel, and 28% ahead of the Pro 7 14 Intel. Users regularly compressing or extracting large archives should see a useful reduction in processing time compared with the three smaller laptops.
| 7-Zip (higher is better) | Dell Pro 5 16 (AMD Ryzen AI 9 HX PRO 470 12C) | Dell Pro 7 14 (AMD Ryzen AI 9 HX PRO 470 12C) | Dell Pro 7 14 (Intel Core Ultra 7 366H 16C) | Dell Pro 5 14 (Intel Core Ultra X7 368H 16C) |
|---|---|---|---|---|
| Total Rating (GIPS) | 103.9 | 90.2 | 81.2 | 89.4 |
y-cruncher
y-cruncher measures how quickly the processor can calculate large numbers of Pi digits, placing a heavy load on the CPU and memory. Results are measured in seconds, so lower times are better.
The Dell Pro 5 16 completed all three y-cruncher calculations in the shortest time, beginning with 25.160 seconds in the one-billion-digit test. That was nearly identical to the Pro 7 14 AMD at 25.199 seconds, but the larger system opened a wider gap as the workload increased. Its five-billion-digit result of 163.768 seconds was 14 seconds faster than the smaller AMD laptop, 41 seconds faster than the Pro 5 14 Intel, and nearly 77 seconds faster than the Pro 7 14 Intel.
| y-cruncher — seconds (lower is better) | Dell Pro 5 16 (AMD Ryzen AI 9 HX PRO 470 12C) | Dell Pro 7 14 (AMD Ryzen AI 9 HX PRO 470 12C) | Dell Pro 7 14 (Intel Core Ultra 7 366H 16C) | Dell Pro 5 14 (Intel Core Ultra X7 368H 16C) |
|---|---|---|---|---|
| 1 Billion | 25.160 | 25.199 | 34.775 | 29.405 |
| 2.5 Billion | 73.320 | 79.393 | 104.586 | 90.719 |
| 5 Billion | 163.768 | 177.776 | 240.554 | 204.685 |
Blender 5.1.1 (GPU)
The Blender benchmark measures GPU rendering performance using three different 3D scenes: Monster, Junkshop, and Classroom. Results are reported in samples per minute, so higher scores are better.
Blender GPU rendering favored Intel graphics, leaving the Dell Pro 5 16 at the bottom of all three scenes. The Radeon 890M produced 129.8 samples per minute in Monster, 103.1 in Junkshop, and 91.1 in Classroom. The Pro 7 14 AMD was between nine and 18% faster, while the Arc B390 in the Pro 5 14 Intel delivered close to three times the performance in Junkshop and Classroom.
| Blender 5.1.1 GPU — samples/min (higher is better) | Dell Pro 5 16 (AMD Ryzen AI 9 HX PRO 470 12C) | Dell Pro 7 14 (AMD Ryzen AI 9 HX PRO 470 12C) | Dell Pro 7 14 (Intel Core Ultra 7 366H 16C) | Dell Pro 5 14 (Intel Core Ultra X7 368H 16C) |
|---|---|---|---|---|
| Monster | 129.8 | 140.9 | 253.6 | 366.6 |
| Junkshop | 103.1 | 122.0 | 189.3 | 312.6 |
| Classroom | 91.1 | 105.6 | 153.0 | 244.4 |
V-Ray and LuxMark
LuxMark measures GPU compute performance by rendering complex scenes through OpenCL while V-Ray GPU measures how quickly the graphics processor can render a scene using the V-Ray engine. Higher scores are better.
GPU compute performance was stronger than the Blender results, with the Dell Pro 5 16 scoring 2,125 in LuxMark Hall, 982 in LuxMark Food, and 861 vpaths in V-Ray GPU. The Hall result placed it just behind the Pro 7 14 Intel at 2,168, while its V-Ray score was second only to the Pro 5 14 Intel at 919. Although the Radeon 890M did not perform particularly well with Blender’s renderer, it was far more competitive in the OpenCL and V-Ray workloads tested here.
| GPU Compute (higher is better) | Dell Pro 5 16 (AMD Ryzen AI 9 HX PRO 470 12C) | Dell Pro 7 14 (AMD Ryzen AI 9 HX PRO 470 12C) | Dell Pro 7 14 (Intel Core Ultra 7 366H 16C) | Dell Pro 5 14 (Intel Core Ultra X7 368H 16C) |
|---|---|---|---|---|
| LuxMark — Hall | 2,125 | 2,042 | 2,168 | 3,287 |
| LuxMark — Food | 982 | 1,050 | 880 | 1,585 |
| V-Ray GPU (vpaths) | 861 | 784 | 775 | 919 |
SPECviewperf 15
SPECviewperf 15 measures graphics performance using viewsets based on professional applications for CAD, 3D modeling, rendering, engineering, and medical visualization. Higher scores are better, although performance can vary considerably between applications and graphics architectures.
The Dell Pro 5 16 led several engineering and scientific viewsets, including Energy (25.39), Medical (65.45), and SolidWorks (33.12), while staying close to the Pro 7 14 AMD in 3ds Max (23.21), CATIA (20.16), Creo (44.27), and SNX (51.67). Results shifted in the visualization tests, where the Arc B390 led Blender, Enscape, Maya, and Unreal Engine, with the Dell Pro 5 16 scoring 19.89, 8.02, 48.67, and 26.61, respectively. The Radeon 890M performed best in many of the CAD, engineering, and medical workloads represented here, while Intel’s Arc B390 had the advantage in several rendering applications.
| SPECviewperf 15 (higher is better) | Dell Pro 5 16 (AMD Ryzen AI 9 HX PRO 470 12C) | Dell Pro 7 14 (AMD Ryzen AI 9 HX PRO 470 12C) | Dell Pro 7 14 (Intel Core Ultra 7 366H 16C) | Dell Pro 5 14 (Intel Core Ultra X7 368H 16C) |
|---|---|---|---|---|
| 3dsmax-08 | 23.21 | 24.69 | 9.58 | 20.21 |
| blender-01 | 19.89 | 20.85 | 9.11 | 21.19 |
| catia-07 | 20.16 | 21.21 | 5.27 | 10.27 |
| creo-04 | 44.27 | 45.70 | 18.27 | 32.53 |
| energy-04 | 25.39 | 25.08 | 3.68 | 10.78 |
| enscape-01 | 8.02 | 8.29 | 6.22 | 14.28 |
| maya-07 | 48.67 | 53.64 | 49.54 | 82.42 |
| medical-04 | 65.45 | 60.50 | 9.91 | 22.96 |
| snx-05 | 51.67 | 51.84 | 37.74 | 46.22 |
| solidworks-08 | 33.12 | 32.02 | 11.86 | 23.60 |
| unreal_engine-01 | 26.61 | 26.29 | 21.36 | 38.77 |
SPECworkstation 4
SPECworkstation 4 measures workstation performance across CPU, graphics, storage, AI, product design, engineering, financial services, and other professional workloads. Higher scores are better, while DNF means the system did not complete every workload required for that category.
The Dell Pro 5 16 recorded the highest scores in AI and Machine Learning at 1.37, Energy at 1.24, and Financial Services at 0.98, while tying the Pro 5 14 Intel in Life Sciences at 1.34. Its Graphics score of 2.36 was just behind the Pro 7 14 AMD at 2.41 and well ahead of both Intel systems, while the CPU subsystem reached 1.09. Storage was weaker at 0.89, and the laptop also trailed both Intel systems in Product Design and Productivity and Development. Media and Entertainment did not finish just like the other AMD system.
| SPECworkstation 4 (higher is better) | Dell Pro 5 16 (AMD Ryzen AI 9 HX PRO 470 12C) | Dell Pro 7 14 (AMD Ryzen AI 9 HX PRO 470 12C) | Dell Pro 7 14 (Intel Core Ultra 7 366H 16C) | Dell Pro 5 14 (Intel Core Ultra X7 368H 16C) |
|---|---|---|---|---|
| CPU (subsystem) | 1.09 | 1.00 | 1.08 | 1.19 |
| Graphics (subsystem) | 2.36 | 2.41 | 0.82 | 1.68 |
| Storage (subsystem) | 0.89 | 0.55 | 1.68 | 1.76 |
| AI & Machine Learning | 1.37 | 1.29 | 1.18 | 1.36 |
| Energy | 1.24 | 1.13 | 0.90 | 1.18 |
| Financial Services | 0.98 | 0.88 | 0.78 | 0.78 |
| Life Sciences | 1.34 | 1.08 | 1.04 | 1.34 |
| Media & Entertainment | DNF | DNF | 1.16 | DNF |
| Product Design | 1.34 | 1.18 | 1.41 | 1.64 |
| Productivity & Development | 0.78 | 0.72 | 1.04 | 1.10 |
Storage Performance
3DMark Storage measures how an SSD performs during gaming-related tasks such as loading games, installing software, saving progress, and moving game files. Blackmagic Disk Speed Test measures an SSD’s sequential read and write speeds using large media files.
The 1TB SanDisk PC SN5100S delivered a 3DMark Storage score of 2,477, placing the Dell Pro 5 16 behind the two Intel systems but far ahead of the Pro 7 14 AMD at 894. Blackmagic measured sequential read and write speeds of 4,758.0 MB/s and 5,166.5 MB/s, respectively. Those speeds should be plenty for office work, large file transfers, and creative applications, although the SK hynix drives in the Intel laptops approached or exceeded 8,400 MB/s in both directions.
| Storage (higher is better) | Dell Pro 5 16 (AMD Ryzen AI 9 HX PRO 470 12C) | Dell Pro 7 14 (AMD Ryzen AI 9 HX PRO 470 12C) | Dell Pro 7 14 (Intel Core Ultra 7 366H 16C) | Dell Pro 5 14 (Intel Core Ultra X7 368H 16C) |
|---|---|---|---|---|
| 3DMark Storage (score) | 2,477 | 894 | 3,259 | 3,144 |
| Blackmagic Disk — Read (MB/s) | 4,758.0 | 3,103.4 | 8,398.6 | 8,609.6 |
| Blackmagic Disk — Write (MB/s) | 5,166.5 | 4,034.3 | 8,934.5 | 8,747.3 |
Battery Life
The PCMark 10 Modern Office battery test repeatedly runs common office tasks until the battery reaches the test’s cutoff point. Longer runtimes are better.
The Dell Pro 5 16 lasted 15 hours and 22 minutes in the PCMark 10 Modern Office battery test, giving it the shortest runtime of the four laptops. The Pro 7 14 AMD ran for four hours and six minutes longer, while both Intel systems passed 26 hours. The 70Wh battery can cover a normal workday, but its runtime falls well short of the three 14-inch models.
| Battery — PCMark 10 Modern Office (higher is better) | Dell Pro 5 16 (AMD Ryzen AI 9 HX PRO 470 12C) | Dell Pro 7 14 (AMD Ryzen AI 9 HX PRO 470 12C) | Dell Pro 7 14 (Intel Core Ultra 7 366H 16C) | Dell Pro 5 14 (Intel Core Ultra X7 368H 16C) |
|---|---|---|---|---|
| Runtime | 15h 22m | 19h 28m | 26h 18m | 26h 48m |
Conclusion
The Dell Pro 5 16 is the best fit among the tested laptops for buyers who want a larger screen, a dedicated numeric keypad, and stronger performance during long CPU-heavy workloads. Its Ryzen AI 9 HX PRO 470 led both Cinebench multi-core tests, including an 18,764 in R23 that beat every 14-inch system by 11% or more, topped 7-Zip at 103.9 GIPS, and swept all three y-cruncher calculations, showing that the larger cooling system gives the processor room to sustain performance the thinner chassis can’t. It even posted the group’s best Geekbench single-core score at 2,989. The 16-inch WQXGA display also provides a better workspace for spreadsheets, creative applications, and side-by-side windows than the three 14-inch alternatives.
Our review build costs $4,648, making it the least expensive of the four Dell configurations tested despite including 64GB of replaceable memory, a 1TB SSD, Wi-Fi 7, a 70Wh battery, and three years of next-business-day onsite support. That is still a considerable investment, but within a managed Dell fleet, the Pro 5 16 offers the best combination of sustained CPU performance, serviceability, screen size, and price. It works especially well as a desk-replacement system that may travel occasionally but will spend much of its time connected to office equipment.
Anyone who needs the fastest integrated graphics should look elsewhere in the family, since the DDR5-5600 memory limits what the Radeon 890M can do in Blender, local AI, and other bandwidth-heavy workloads. The Pro 7 14 AMD delivers better Radeon performance with its LPDDR5x-8533 memory, while the Arc B390 in the Pro 5 14 Intel is considerably faster in Blender and AI generation. The Dell Pro 5 16 also has the shortest battery life and highest starting weight in this group, so one of the 14-inch models will be a better choice for users who spend most of the day away from a desk.
For buyers who prioritize screen space, a numeric keypad, and sustained CPU performance over graphics speed and portability, the Dell Pro 5 16 is the strongest desk-replacement option in this group.



 Amazon