

The Intel Arc Pro B70 is the most capable and promising deskside AI card Intel has shipped, but at times, it is also the most frustrating. Intel set the list price at $949 for 32GB of GDDR6 when it launched in March of this year. However, the memory crunch squeezing the whole market has pushed street prices over $1,100 as of this review. Even then, the B70 undercuts NVIDIA’s RTX Pro 4000, which lists at a higher price and has climbed past $2,000 despite offering 24GB, a third less VRAM than the B70. Four B70s fit into a single workstation or server for 128GB of pooled VRAM, enough to host 120-billion-parameter mixture-of-experts models at a concurrency that used to require much larger spend. The hardware is impressive; the pricing is even more so. What holds it back is the same issue that held back the B60 we previewed last December: the software isn’t there yet, and we have to wonder: Will Intel ever get there?
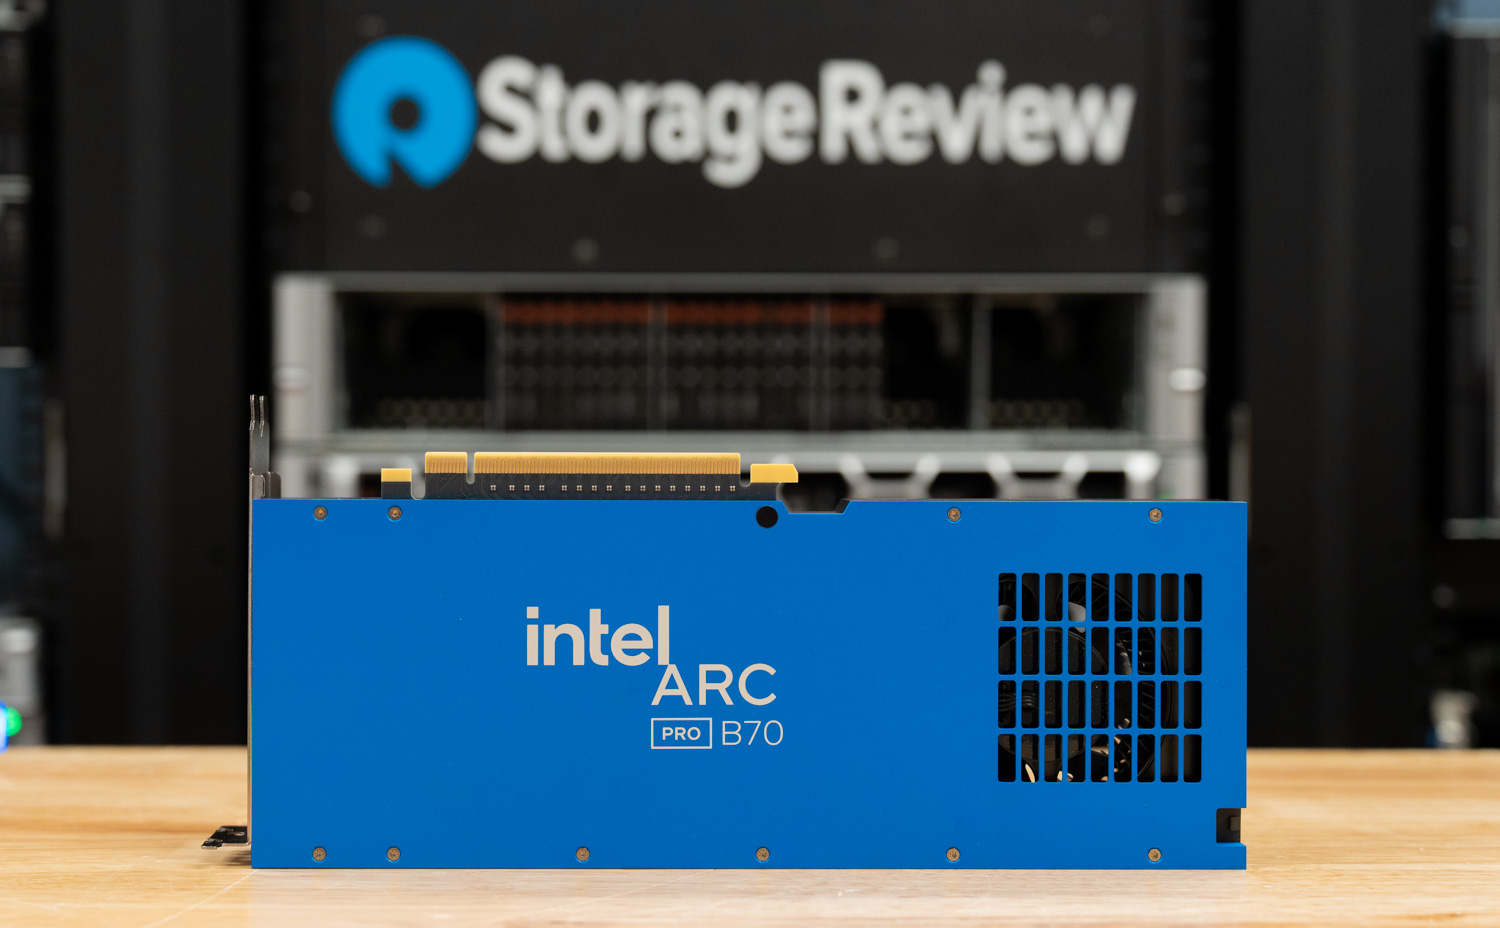
We’ve been here before with Intel more than once. When we looked at the Arc Pro B60 Battlematrix, the story was great silicon waiting on a pre-release stack, and the B70 inherits both halves. The card is built on the larger BMG-G31 die with 32 Xe2 cores, 256 XMX engines, and 367 INT8 TOPS. It is fed by a 256-bit bus at 608 GB/s and configurable from 160W to 290W. Against the B60, Intel puts the generational gain at 44% on average across workstation workloads and up to 69% on professional applications. One deployment wrinkle worth knowing up front: while the B60 shipped as dual-GPU cards that split a slot x8/x8, the B70 is one GPU per card and requires a full PCIe 5.0 x16 lane, which changes how you populate a four-card chassis.
Intel’s marketing leans entirely into local inference, and the comparison it picked is NVIDIA’s RTX Pro 4000 24GB. On Intel’s own Linux numbers, the B70’s 32GB holds roughly 93K KV-cache tokens against the RTX Pro 4000’s 42K before running out of memory, delivers up to 85% higher token throughput as concurrent users climb, answers up to 6.2x faster on time-to-first-token under load, and offers up to 2x the tokens per dollar. Those are Intel’s figures, single-card, on a small Llama 3.1 8B at BF16; we’ll work the B70s a little harder. The tokens-per-dollar claim used launch list prices; at current pricing, the gap holds or widens in Intel’s favor.
Before we get to the benchmarks, that trade-off matters because it determines who should buy this card today. Intel’s LLM Scaler, the Battlemage-enabled development branch of vLLM, in our opinion is still a beta release at best. Model coverage is limited; several quantization paths that should work do not yet, and the stack limits what the hardware can do. We saw the same problem on Intel Gaudi 3 in the Dell PowerEdge XE7740, where the soft FP8 results traced not to the silicon but to immature code paths in Intel’s vLLM fork. The B70 sits in the same spot. This is where Intel has to make a decision and stick with it more aggressively than they have so far.
NVIDIA’s moat is not just CUDA. It is the boring stuff that matters when deploying a model: docs, examples, working containers, forum answers, and enough community history that most problems have been solved. AMD has clearly been pushing ROCm in the same direction. Intel needs the same level of commitment around Arc Pro, or the B70 risks becoming a card enthusiasts want to like but teams struggle to adopt.
For this review, we kept the platform identical to the B60 work for a clean comparison: a Supermicro AS-4125GS-TNRT with AMD EPYC 9374F processors and 512GB of DDR5, running four B70s (128GB) against four B60s (96GB) under vLLM. As with the B60, this is not Intel’s all-Intel Battlematrix reference, which pairs the cards with a Xeon 6 host. Production systems on Intel silicon may behave differently. Treat what follows as a same-bench generational and value check with software maturity affecting every result.
Intel Arc Pro B70 Specifications
| Specification | Intel Arc Pro B70 |
|---|---|
| General | |
| Product Family | Intel Arc Pro B-Series Graphics |
| Model | Intel Arc Pro B70 |
| Code Name | Battlemage |
| Microarchitecture | Xe2 |
| Process Technology | TSMC N5 |
| Launch Date | Q1 2026 |
| Warranty | 3 Years |
| GPU Specifications | |
| Xe-Cores | 32 |
| Render Slices | 8 |
| Ray Tracing Units | 32 |
| Intel XMX Engines | 256 |
| Xe Vector Engines | 256 |
| Graphics Clock | 2280 MHz |
| Maximum Dynamic Clock | 2800 MHz |
| FP32 Performance | 22.94 TFLOPS |
| INT8 AI Performance | 367 TOPS |
| Total Board Power (TBP) | 230W (Configurable: 160–290W) |
| PCI Express Interface | PCIe 5.0 x16 |
| Memory | |
| Memory Capacity | 32GB GDDR6 |
| Memory Bus | 256-bit |
| Memory Bandwidth | 608 GB/s |
| ECC Memory | Supported |
| Display & I/O | |
| Display Outputs | DisplayPort 2.1 |
| Maximum Displays | 4 |
| Maximum Resolution | 7680 × 4320 @ 120Hz (HDMI / DisplayPort) |
| Variable Refresh Rate | HDMI VRR, VESA Adaptive Sync |
| Features & Software | |
| Video Encode/Decode | H.264, H.265 (HEVC), AV1 |
| Ray Tracing | Supported |
| AI Frameworks | oneAPI, OpenVINO, Intel Extension for PyTorch (IPEX) |
| Graphics APIs | DirectX 12 Ultimate, Vulkan 1.3, OpenGL 4.6, OpenCL 3.0 |
| Intel XeSS | Supported |
| HDR Support | HDR10, HDR10+ Gaming, Dolby Vision |
| Multi-Format Codec Engines | 2 |
| Physical Specifications | |
| Dimensions | 10.5 × 3.9 inches |
| Slot Width | Dual Slot |
| Weight | 1020g |
| Power Connector | 1 × 8-pin (ATX 2×4) |
Intel Arc Pro B70 Build and Design
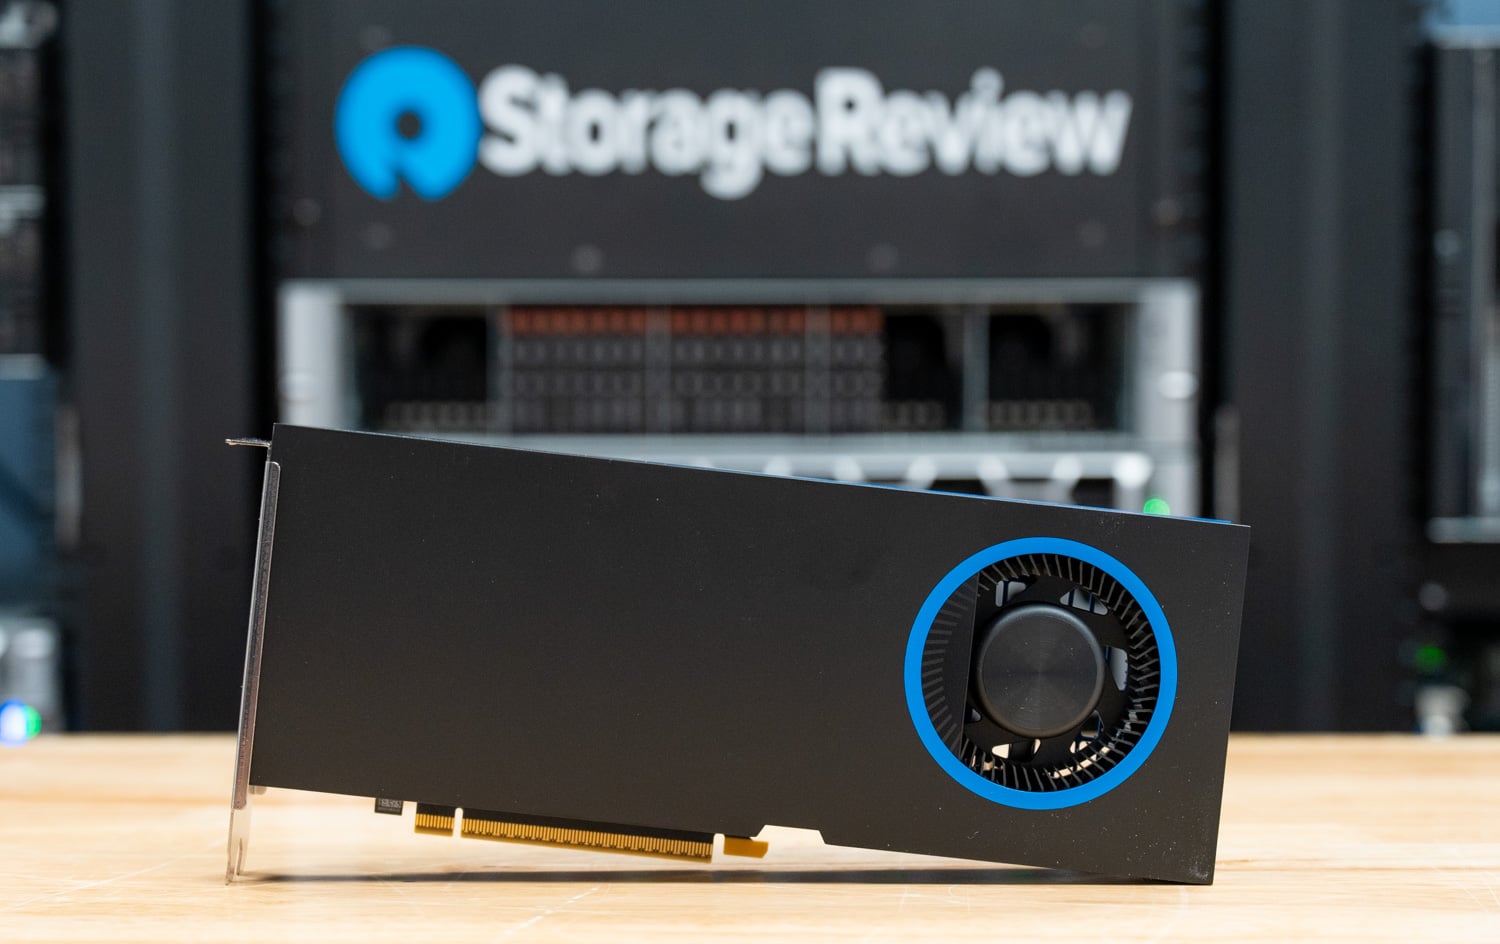
Measuring 10.5 × 3.9 inches (267 × 99 mm) and weighing 2.25 lb, the Intel Arc Pro B70 features a compact dual-slot design with a clean, understated appearance. The card is finished in matte black with Intel’s signature blue accents. It includes a full-length anodized aluminum backplate that adds rigidity and matches Intel’s branding.
It features a single blower-style fan that pulls air through the heatsink and exhausts it directly out of the rear I/O bracket. This enclosed cooling design keeps the card’s footprint compact and maintains a clean airflow path through the system.
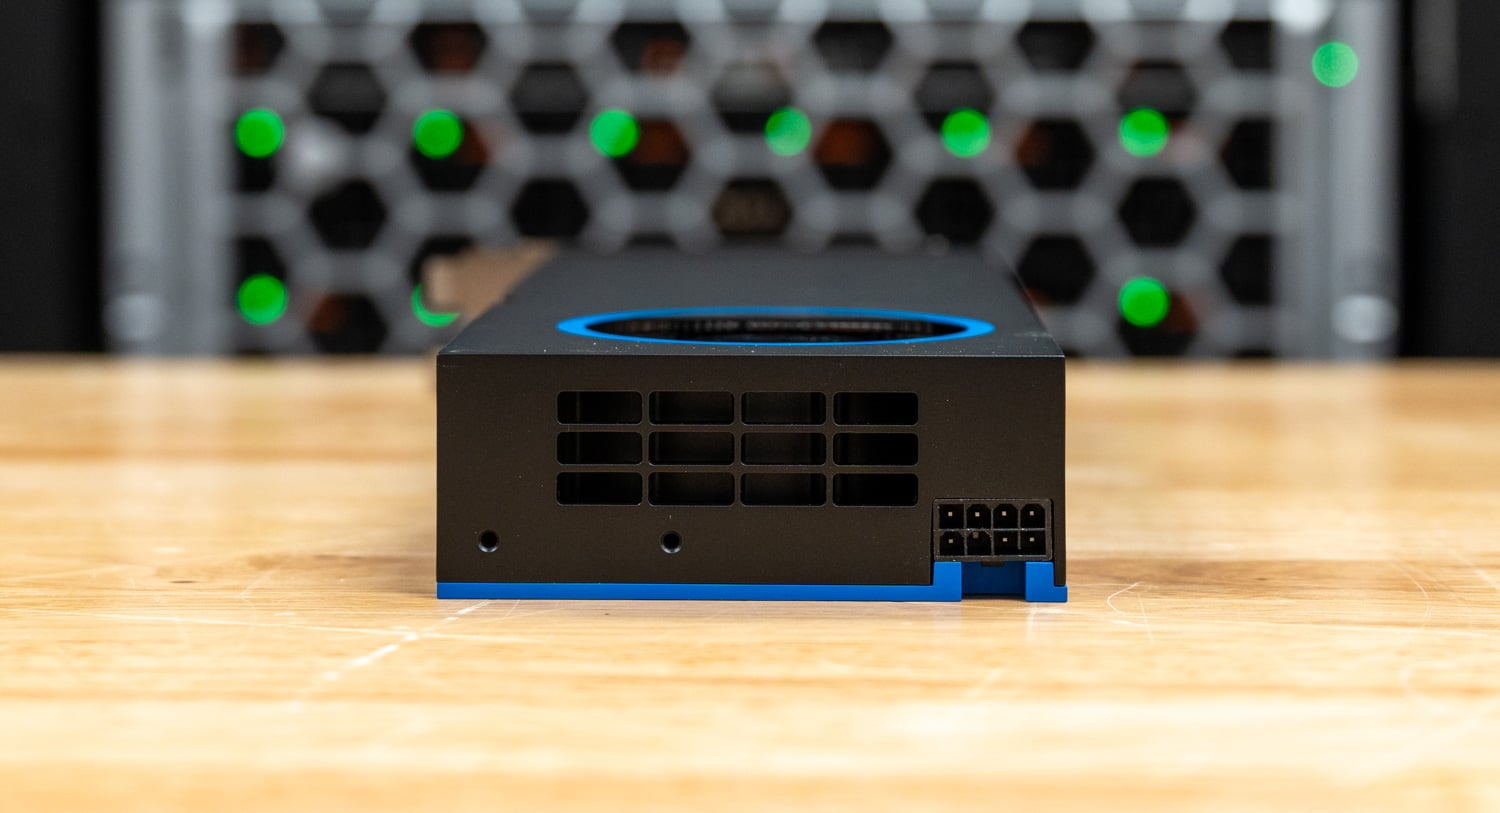
At the rear of the card, opposite the PCIe bracket, Intel includes a single 8-pin (2×4) PCIe power connector to supply external power. This end of the shroud also has additional intake openings that feed fresh air into the blower fan, along with threaded mounting points for attaching an optional GPU support bracket to improve stability in workstation deployments.
Along the bottom edge, the Arc Pro B70 uses a standard PCIe 5.0 x16 interface for host connectivity. This angle also highlights the card’s dual-slot form factor. It provides enough space for the enclosed blower cooling solution while remaining compact enough for dense workstation and server installations.
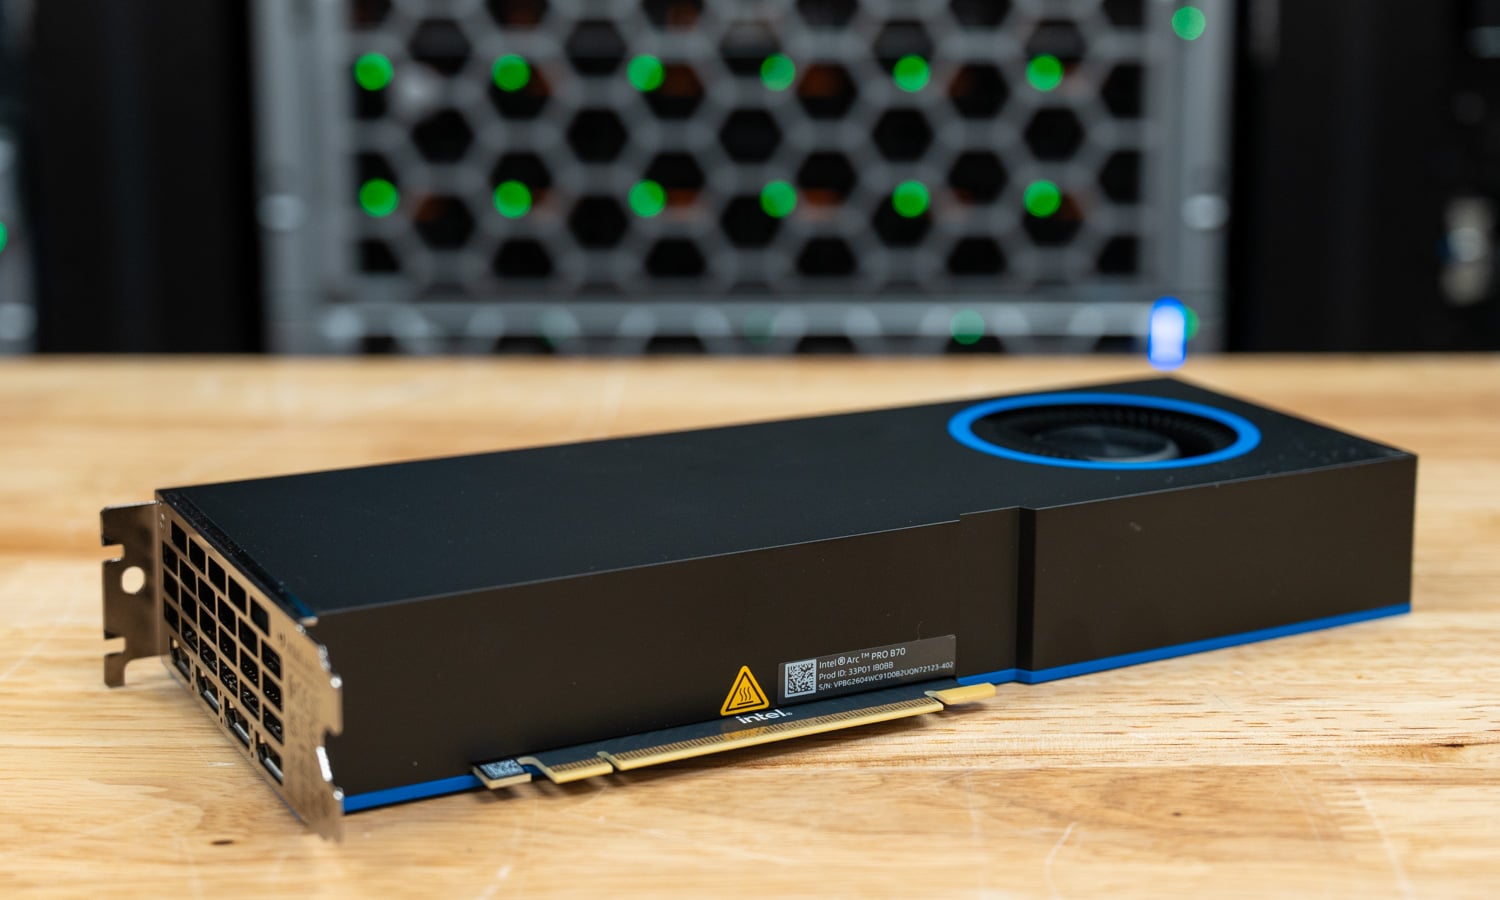
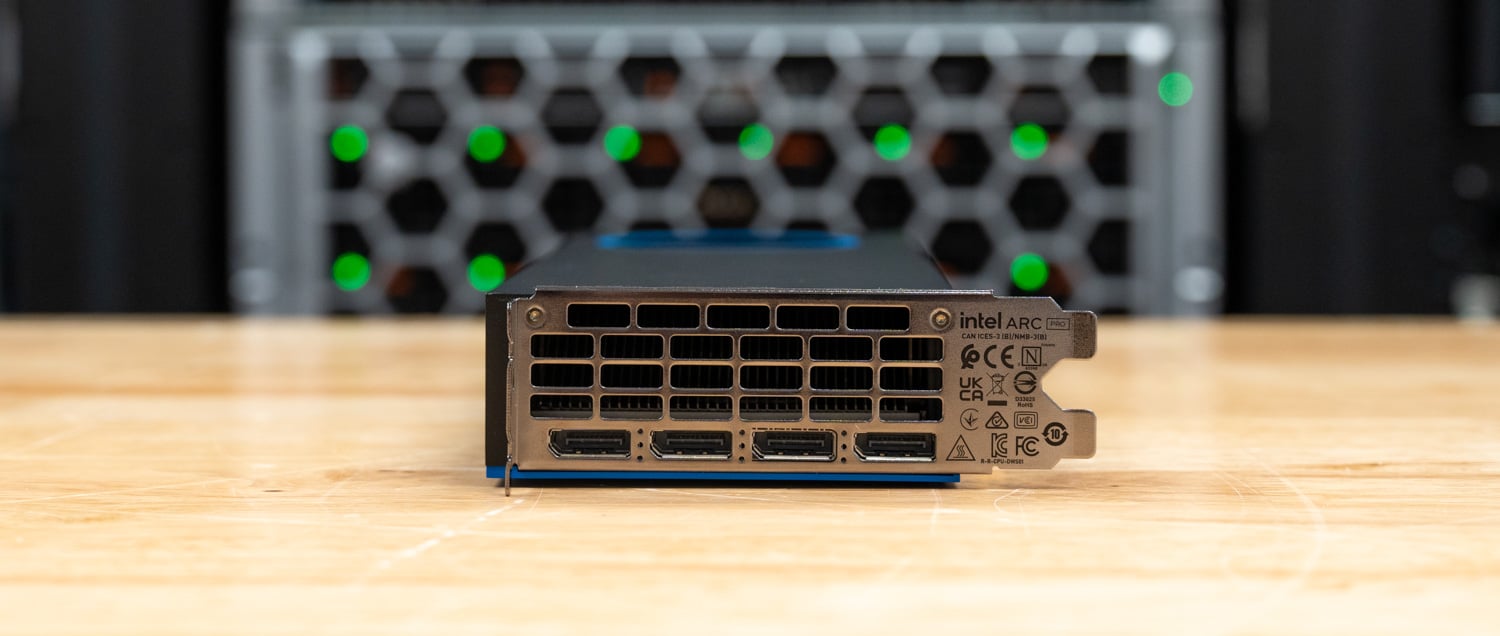
The I/O bracket features a large vented exhaust that allows the blower fan to expel hot air directly out of the chassis. Below the exhaust are four DisplayPort 2.1 outputs, each capable of driving displays up to 7680 × 4320 (8K) at 120Hz, providing ample bandwidth for high-resolution multi-monitor workstation environments.
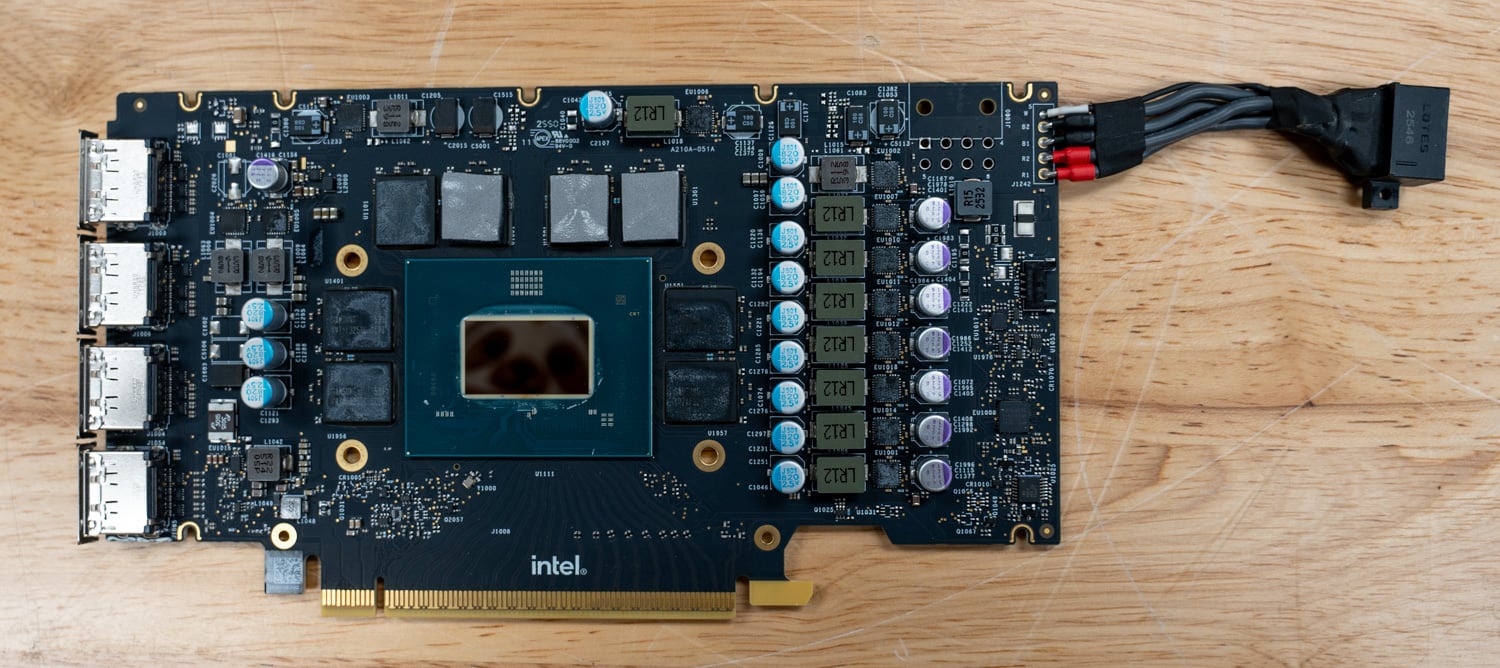
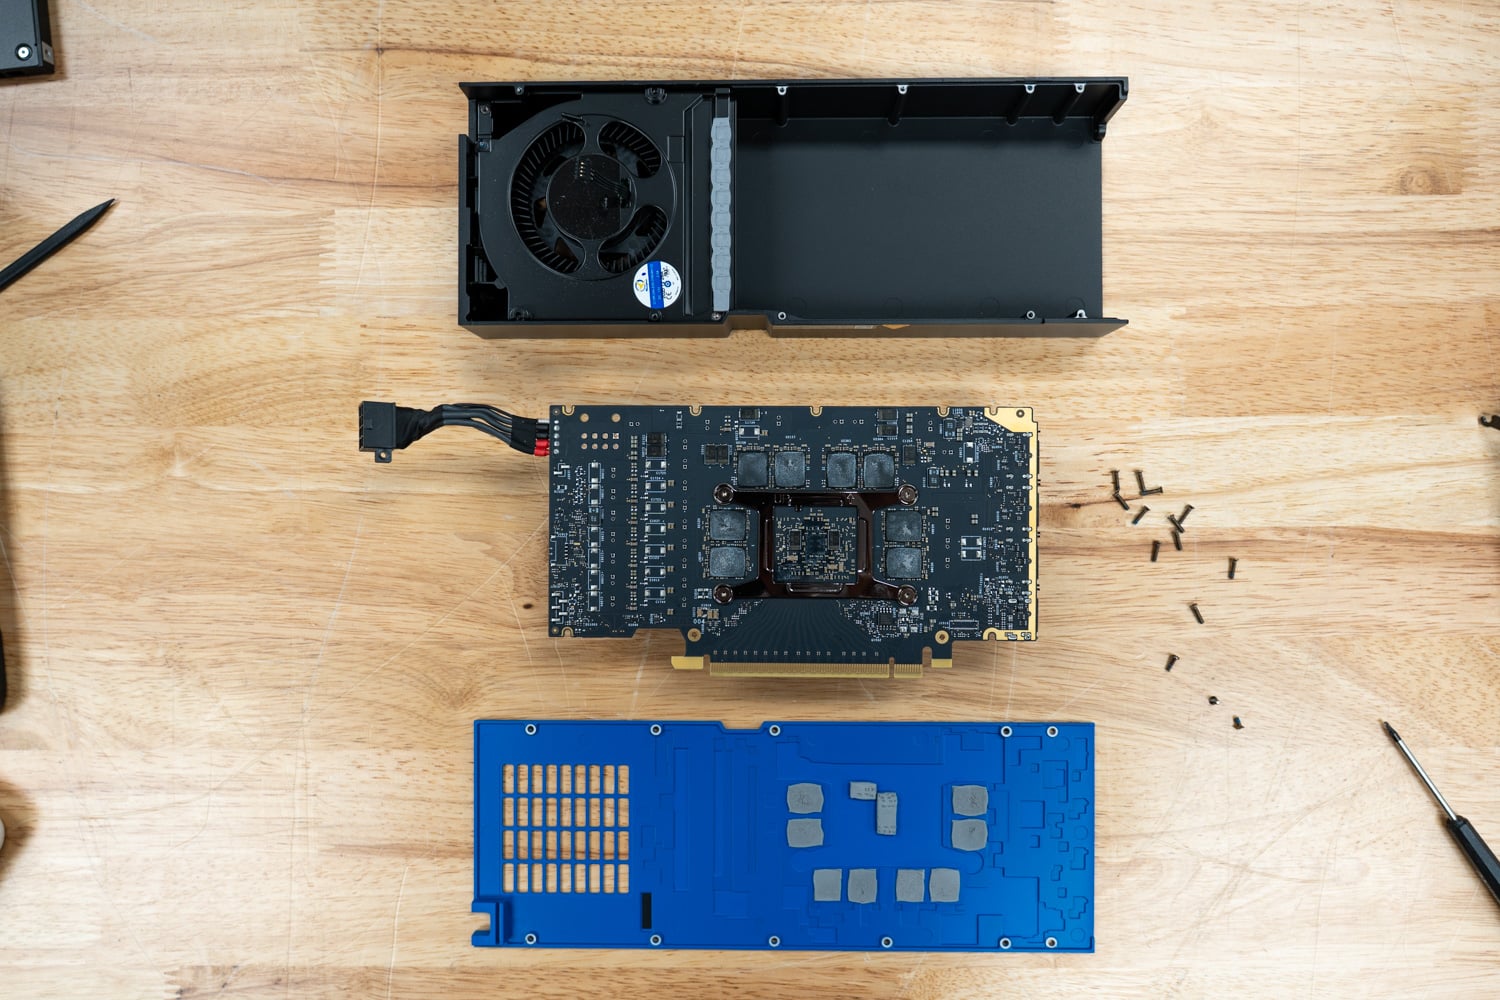
With the cooler removed, the Arc Pro B70’s PCB reveals the major components that power the card. At its center sits Intel’s 32-core Xe2-HPG GPU, surrounded by 32GB of dedicated GDDR6 memory connected via a 256-bit memory interface delivering up to 608 GB/s of memory bandwidth. The GPU also integrates 256 XMX AI engines delivering up to 367 INT8 TOPS of AI compute performance, alongside 32 dedicated Ray Tracing units for hardware-accelerated ray-tracing workloads. Surrounding the GPU are the power delivery stages, memory circuitry, and display output components that support the card’s design.
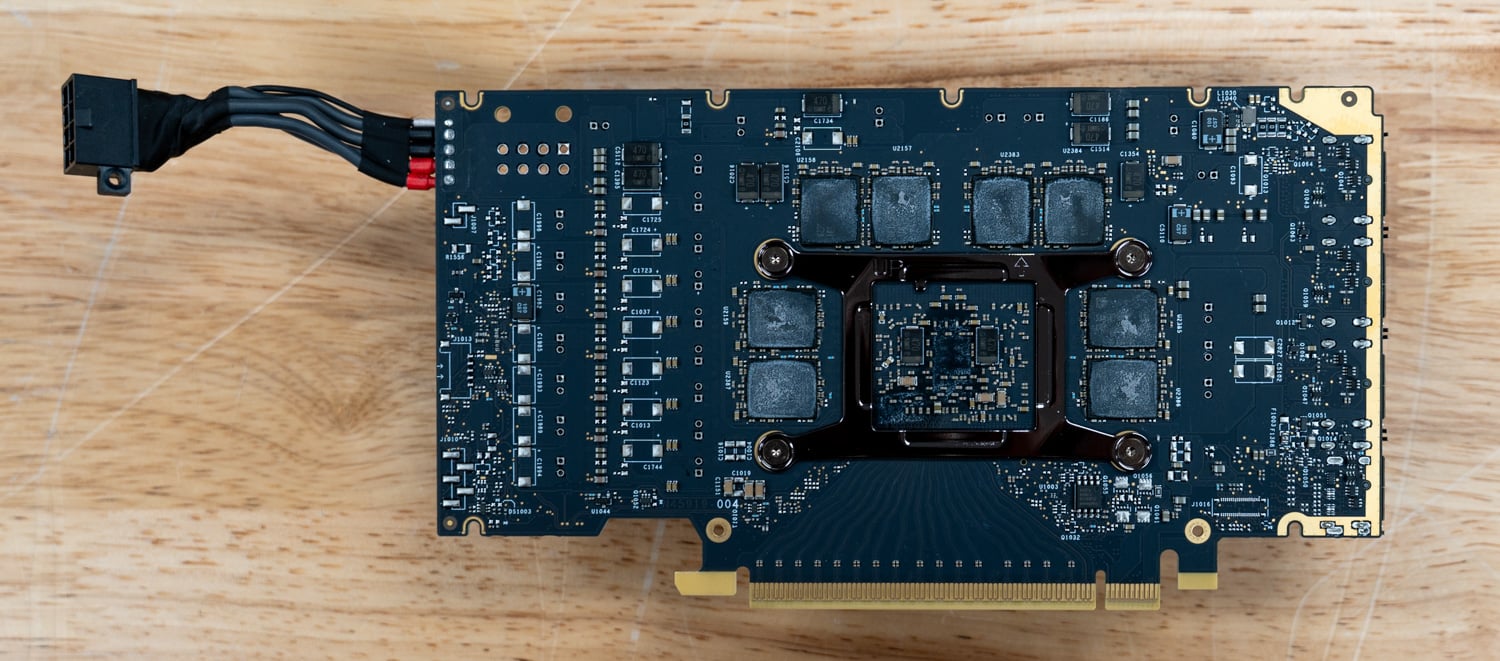
The rear of the PCB exposes more GDDR6 memory packages and parts of the card’s power delivery circuitry. The large retention bracket surrounding the GPU package helps distribute mounting pressure from the heatsink evenly. The 8-pin PCIe power connector supplies the card’s external power. With power delivered via the PCIe slot, the Arc Pro B70 is rated for up to 230W of total board power.
Intel Arc Pro B70 Performance testing
Windows Testing – StorageReview AMD Threadripper Test Platform
Here is the test platform we will be using for our single Intel Arc Pro B70 testing:
- Motherboard: ASUS Pro WS TRX50-SAGE WIFI
- CPU: AMD Ryzen Threadripper 7980X 64-Core
- RAM: 128GB DDR5 4800MT/s
- Storage: 2TB Samsung 980 Pro
- OS: Windows 11 Pro for Workstations
Comparable GPUs tested
- Intel Arc Pro B50
- Intel Arc Pro B70
- AMD Radeon RX 9060 XT
- AMD Radeon RX 9070
- AMD Radeon RX 9070 XT
- NVIDIA GeForce RTX 5060 Ti
- NVIDIA GeForce RTX 5070 FE
UL Procyon: AI Text Generation
The Procyon AI Text Generation Benchmark streamlines AI LLM performance testing with a concise, consistent evaluation method. It allows repeated testing across multiple LLM models while minimizing the complexity of large models and the impact of variable factors. Developed with AI hardware leaders, it optimizes the use of local AI accelerators to deliver more reliable, efficient performance assessments. The following results were measured using TensorRT on NVIDIA models and ONNX on AMD models.
The Arc Pro B70 delivers one of the largest generational improvements in the comparison, increasing overall scores by 60% over the B50 across the Phi, Mistral, and Llama 3 models while reducing time-to-first-token by 40-45%. Against AMD, the B70 scores 224% higher than the Radeon RX 9060 XT on Phi (4,152 vs. 1,281), 220% higher on Mistral (4,082 vs. 1,274), and 250% higher on Llama 3 (4,029 vs. 1,150). Compared to the Radeon RX 9070 XT, Intel still maintains an advantage of 100%, 83%, and 95%, respectively. NVIDIA narrows the gap, with the RTX 5060 Ti trailing the B70 by 45% in Phi and 45% in Mistral, while the RTX 5070 remains 15-20% behind in those same models. The standout result is Llama 2, where the B70 posts the highest score in the entire comparison at 5,769, outperforming the RTX 5070 by 85% and the RX 9070 XT by 151%.
| UL Procyon: AI Text Generation | Intel Arc Pro B50 | Intel Arc Pro B70 | AMD Radeon RX 9060 XT | AMD Radeon RX 9070 | AMD Radeon RX 9070 XT | NVIDIA GeForce RTX 5060 Ti | NVIDIA GeForce RTX 5070 FE |
|---|---|---|---|---|---|---|---|
| Phi Overall Score | 2,593 | 4,152 | 1,281 | 1,933 | 2,080 | 2,870 | 3,453 |
| Phi Output Time To First Token | 0.275 s | 0.155 s | 1.473 s | 0.954 s | 0.855 s | 0.375 s | 0.323 s |
| Phi Output Tokens Per Second | 72.128 tokens/s | 104.121 tokens/s | 94.453 tokens/s | 139.187 tokens/s | 144.471 tokens/s | 120.773 tokens/s | 150.435 tokens/s |
| Phi Overall Duration | 39.179 s | 37.924 s | 39.365 s | 26.989 s | 25.587 s | 25.216 s | 20.302 s |
| Mistral Overall Score | 2,483 | 4,082 | 1,274 | 2,040 | 2,231 | 2,807 | 3,562 |
| Mistral Output Time To First Token | 0.346 s | 0.180 s | 1.827 s | 1.109 s | 0.946 s | 0.526 s | 0.433 s |
| Mistral Output Tokens Per Second | 46.799 tokens/s | 65.834 tokens/s | 65.115 tokens/s | 101.300 tokens/s | 103.348 tokens/s | 91.057 tokens/s | 120.507 tokens/s |
| Mistral Overall Duration | 59.907 s | 58.976 s | 54.516 s | 34.960 s | 33.350 s | 33.377 s | 25.496 s |
| Llama3 Overall Score | 2,427 | 4,029 | 1,150 | 1,904 | 2,070 | 2,599 | 3,125 |
| Llama3 Output Time To First Token | 0.311 s | 0.166 s | 1.632 s | 0.981 s | 0.845 s | 0.449 s | 0.379 s |
| Llama3 Output Tokens Per Second | 45.031 tokens/s | 66.340 tokens/s | 53.167 tokens/s | 87.594 tokens/s | 89.102 tokens/s | 74.709 tokens/s | 100.388 tokens/s |
| Llama3 Overall Duration | 61.926 s | 53.687 s | 62.563 s | 38.273 s | 36.742 s | 39.489 s | 29.720 s |
| Llama2 Overall Score | – | 5,769 | 1,252 | 2,047 | 2,298 | 2,576 | 3,125 |
| Llama2 Output Time To First Token | – | 0.259 s | 2.992 s | 1.926 s | 1.565 s | 0.844 s | 0.785 s |
| Llama2 Output Tokens Per Second | – | 63.666 tokens/s | 34.654 tokens/s | 59.673 tokens/s | 61.127 tokens/s | 41.386 tokens/s | 56.647 tokens/s |
| Llama2 Overall Duration | – | 44.131 s | 99.027 s | 59.100 s | 55.520 s | 71.302 s | 53.234 s |
UL Procyon: AI Image Generation
The Procyon AI Image Generation Benchmark consistently and accurately measures AI inference performance across a range of hardware, from low-power NPUs to high-end GPUs. It includes three tests: Stable Diffusion XL (FP16) for high-end GPUs, Stable Diffusion 1.5 (FP16) for moderately powerful GPUs, and Stable Diffusion 1.5 (INT8) for low-power devices. The benchmark uses the optimal inference engine for each system, ensuring fair and comparable results.
Image generation is another area where the Arc Pro B70 shows a dramatic improvement over its smaller sibling, delivering a 179% higher Stable Diffusion 1.5 FP16 score (2,101 vs. 754) while reducing generation time from 132.6 seconds to 47.6 seconds, a 64% reduction. The B70 essentially ties the RTX 5060 Ti (2,101 vs. 2,110, less than 1% difference) while trailing the RX 9070 XT by 19% and the RTX 5070 by 29%. In Stable Diffusion XL FP16, Intel again nearly triples B50 performance (181% higher) and finishes just 8% ahead of the RTX 5060 Ti while trailing the RTX 5070 FE by approximately 18%. The INT8 workload favors NVIDIA’s TensorRT implementation, though the B70 still improves on the B50 by 265% and cuts image generation time by more than 72%.
| UL Procyon: AI Image Generation (overall score: higher is better) |
Intel Arc Pro B50 | Intel Arc Pro B70 | AMD Radeon RX 9060 XT | NVIDIA GeForce RTX 5060 Ti | AMD Radeon RX 9070 | AMD Radeon RX 9070 XT | NVIDIA GeForce RTX 5070 FE |
|---|---|---|---|---|---|---|---|
| Stable Diffusion 1.5 (FP16) — Overall Score | 754 | 2,101 | 1,436 | 2,110 | 2,280 | 2,598 | 2,937 |
| Stable Diffusion 1.5 (FP16) — Overall Time | 132.585 s | 47.585 s | 69.633 s | 47.590 s | 43.858 s | 38.481 s | 34.038 s |
| Stable Diffusion 1.5 (FP16) — Image Generation Speed | 8.287 s/image | 2.974 s/image | 4.352 s/image | 2.974 s/image | 2.741 s/image | 2.405 s/image | 2.127 s/image |
| Stable Diffusion 1.5 (INT8) — Overall Score | 5,020 | 18,344 | N/A | 27,705 | N/A | N/A | 36,320 |
| Stable Diffusion 1.5 (INT8) — Overall Time | 49.795 s | 13.628 s | N/A | 9.024 s | N/A | N/A | 6.883 s |
| Stable Diffusion 1.5 (INT8) — Image Generation Speed | 6.224 s/image | 1.703 s/image | N/A | 1.128 s/image | N/A | N/A | 0.860 s/image |
| Stable Diffusion XL (FP16) — Overall Score | 748 | 2,102 | 1,124 | 1,940 | 1,805 | 2,010 | 2,473 |
| Stable Diffusion XL (FP16) — Overall Time | 790.774 s | 285.344 s | 533.736 s | 326.550 s | 332.400 s | 298.499 s | 242.606 s |
| Stable Diffusion XL (FP16) — Image Generation Speed | 49.423 s/image | 17.834 s/image | 33.359 s/image | 20.409 s/image | 20.775 s/image | 18.656 s/image | 15.163 s/image |
Luxmark
Luxmark is a GPU benchmark that uses LuxRender, an open-source ray-tracing renderer, to assess a system’s performance with highly detailed 3D scenes. This benchmark is particularly relevant for evaluating the graphical rendering capabilities of servers and workstations, especially in visual effects and architectural visualization applications, where accurate light simulation is crucial.
LuxMark demonstrates excellent scaling for Battlemage. The Arc Pro B70 improves over the B50 by 128% in the Food scene and 137% in Hall. It also outperforms the Radeon RX 9060 XT by 33% in Food and 53% in Hall. The gaming-focused RX 9070 XT maintains an advantage of approximately 54% in Food and 37% in Hall, while NVIDIA’s RTX 5070 FE leads by 62% and 81%, respectively. Overall, the B70 firmly establishes itself as a strong OpenCL rendering accelerator for workstation workloads.
| Luxmark (higher is better) |
Intel Arc Pro B50 | Intel Arc Pro B70 | AMD Radeon RX 9060 XT | NVIDIA GeForce RTX 5060 Ti | AMD Radeon RX 9070 | AMD Radeon RX 9070 XT | NVIDIA GeForce RTX 5070 FE |
|---|---|---|---|---|---|---|---|
| Food Score | 2,456 | 5,609 | 4,220 | 6,590 | 8,233 | 8,610 | 9,061 |
| Hall Score | 5,158 | 12,220 | 8,007 | 15,348 | 16,566 | 16,758 | 22,062 |
Geekbench 6
Geekbench 6 is a cross-platform benchmark that measures overall system performance. The Geekbench Browser allows you to compare any system to it.
The Arc Pro B70 posts a score of 140,165, representing exactly a 100% improvement over the Arc Pro B50. It edges out the Radeon RX 9070 by roughly 1%, outperforms the RX 9060 XT by 36%, and trails the RTX 5060 Ti by just 7%. NVIDIA’s RTX 5070 FE extends the lead to roughly 24%, while AMD’s RX 9070 XT finishes about 35% ahead, placing the B70 squarely in the middle of the upper mainstream compute stack.
| Geekbench 6 OpenCL (higher is better) |
Intel Arc Pro B50 | Intel Arc Pro B70 | AMD Radeon RX 9060 XT | AMD Radeon RX 9070 | NVIDIA GeForce RTX 5060 Ti | NVIDIA GeForce RTX 5070 FE | AMD Radeon RX 9070 XT |
|---|---|---|---|---|---|---|---|
| GPU OpenCL Score | 70,038 | 140,165 | 102,750 | 138,463 | 150,743 | 173,255 | 188,892 |
3DMark
3DMark Port Royal, Speed Way, and Steel Nomad are GPU benchmarks that test performance across different scenarios. Port Royal focuses on ray tracing, Speed Way evaluates performance in racing simulations, and Steel Nomad challenges GPUs with high-intensity, realistic graphics. They assess GPU capabilities in rendering, lighting, and dynamic scenes.
Synthetic graphics performance scales well with the new architecture. The Arc Pro B70 scores 154% higher than the B50 in Port Royal, 136% higher in Speed Way, and 149% higher in Steel Nomad. Against the RX 9060 XT, the B70 leads by 9% in Port Royal, 7% in Speed Way, and 9% in Steel Nomad. Compared to the RTX 5060 Ti, the B70 performs within 2% in Port Royal, falls 23% behind in Speed Way, and leads by 13% in Steel Nomad. The higher-end RTX 5070 FE and RX 9070 XT continue to hold a 31-83% advantage depending on the workload, reflecting their positioning as higher-performance gaming GPUs.
| 3DMark (higher is better) |
Intel Arc Pro B50 | Intel Arc Pro B70 | AMD Radeon RX 9060 XT | NVIDIA GeForce RTX 5060 Ti | NVIDIA GeForce RTX 5070 FE | AMD Radeon RX 9070 | AMD Radeon RX 9070 XT |
|---|---|---|---|---|---|---|---|
| Port Royal | 4,197 | 10,668 | 9,751 | 10,432 | 14,026 | 15,760 | 17,989 |
| Speed Way | 1,355 | 3,202 | 3,004 | 4,184 | 5,869 | 5,791 | 6,237 |
| Steel Nomad (DX12) | 1,644 | 4,089 | 3,767 | 3,611 | 5,019 | 5,992 | 6,977 |
Topaz Video AI
Topaz Video AI is a professional application for enhancing and restoring video using advanced AI models. It supports various tasks, including upscaling footage to 4K or 8K, sharpening blurry content, reducing noise, enhancing facial details, colorizing black-and-white footage, and interpolating frames for smoother motion. The suite includes an onboard benchmark that measures system performance across its various video-enhancing algorithms, providing a clear view of how well hardware platforms handle demanding AI video-processing workloads.
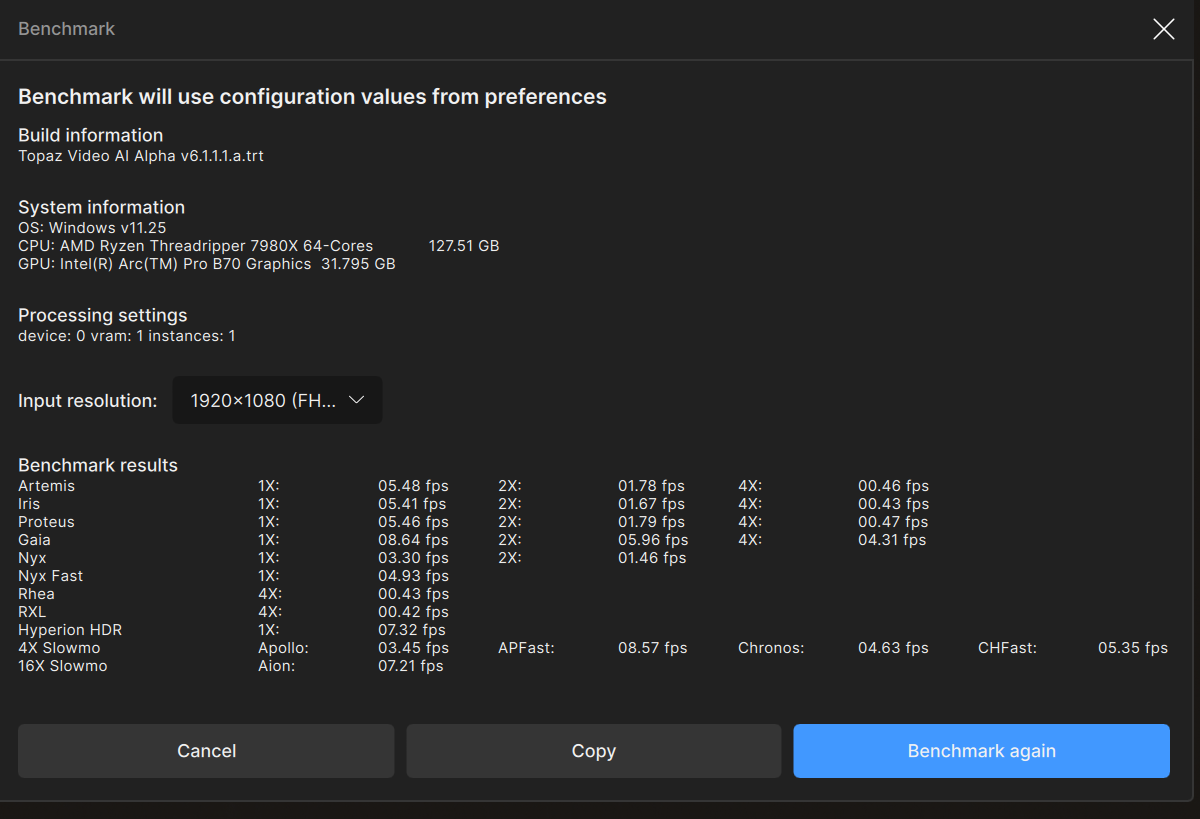
The Arc Pro B70 delivers a substantial improvement over Intel’s previous-generation professional offering, with the largest gains appearing in AI upscaling workloads. The card achieves 5.48 FPS in Artemis, 5.41 FPS in Iris, and 5.46 FPS in Proteus at 1× enhancement, while Gaia reaches 8.64 FPS, the fastest result of the standard enhancement models. More computationally intensive restoration models naturally run slower, with Nyx at 3.30 FPS and Nyx Fast at 4.93 FPS, while Hyperion HDR processes footage at 7.32 FPS. Slow-motion generation also performs well, producing 3.45 FPS with Apollo, 8.57 FPS using APFast, 4.63 FPS with Chronos, 5.35 FPS with CHFast, and 7.21 FPS using Aion. Collectively, these results show that the Arc Pro B70 can handle the full range of Topaz AI workflows, from video enhancement and denoising to HDR conversion and frame interpolation, making it a solid option for creators looking to leverage Intel’s XMX AI acceleration.
Blender 4.5
Blender is an open-source 3D modeling application. This benchmark was run using the Blender Benchmark utility across the GPUs. The score is measured in samples per minute, with higher values indicating better performance.
The Arc Pro B70 produces 1,524.6 samples/minute in Monster, 846.9 samples/minute in Junkshop, and 912.2 samples/minute in Classroom. While these figures do not compete with higher-end enthusiast GPUs such as the RX 9070 XT or RTX 5070, they demonstrate that Battlemage has enough rendering performance for professional visualization and content creation workloads. Combined with its 32GB framebuffer and certified workstation drivers, the B70 strikes a practical balance between rendering capability, AI acceleration, and professional reliability.
| Blender 4.5.0 (samples per minute, higher is better) | Intel Arc Pro B70 |
|---|---|
| Monster | 1,524.60 |
| Junkshop | 846.87 |
| Classroom | 912.24 |
Power Consumption: Intel B70
Power consumption is a significant component of any computing platform. Each new GPU generation consumes more power under load, requiring larger power supplies and ample airflow for cooling. However, faster GPUs might reach higher peak values, but the duration of each workload decreases. Using the Quarch Mains Analyzer in our test lab, we measured total system power consumption during the Procyon AI Image Generator Stable Diffusion XL FP16 test. This workload pushed each GPU to its power limits, with defined start and stop points for each generated image clearly visible.
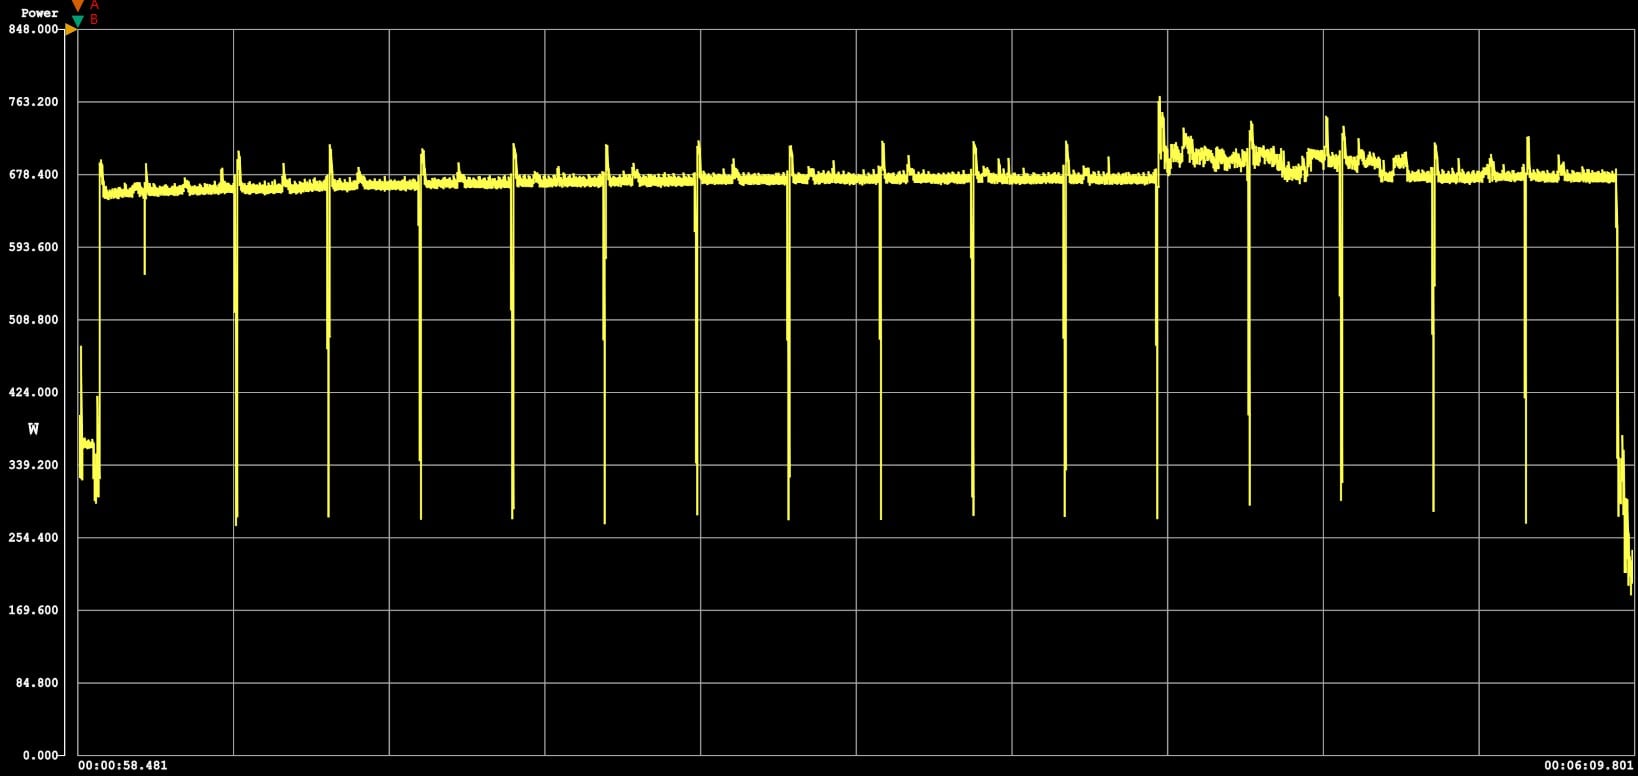
During our testing of the Intel Arc Pro B70, we measured a system idle power draw of 207W, a peak draw of 705.6W during the workload, and a workload average of 638.6W.
| Stable Diffusion XL FP16 Power Efficiency (lower is better) |
Intel Arc Pro B50 | Intel Arc Pro B70 | AMD Radeon RX 9070 | AMD Radeon RX 9070 XT | PNY NVIDIA GeForce RTX 5060 Ti | NVIDIA GeForce RTX 5070 FE |
|---|---|---|---|---|---|---|
| Power Consumed | 5.32 Wh | 3.45 Wh | 4.00 Wh | 3.41 Wh | 2.13 Wh | 2.46 Wh |
| Test Duration | 49.9 s | 18.46 s | 33.0 s | 17.4 s | 20.2 s | 19.2 s |
vLLM Online Serving Benchmark Performance
vLLM is the most popular high-throughput inference and serving engine for LLMs. The vLLM online serving benchmark is a performance evaluation tool that measures real-world serving performance under concurrent requests. It simulates production workloads by sending requests to a running vLLM server with configurable parameters, including request rate, input/output lengths, and the number of concurrent clients. The benchmark measures key metrics, including throughput (tokens per second), time to first token (TTFT), and time per output token (TPOT), helping users understand how vLLM performs under different load conditions.
Test Platform:
- Server: Supermicro AS-4125GS-TNRT
- Processors: AMD EPYC 9374F
- Memory: 512GB Samsung 4800 MT/s DDR5
- ISL 2k/ OSL 256
Comparable GPUs Test
- Intel Arc Pro B60
- Intel Arc Pro B70
- NVIDIA RTX Pro 6000
- NVIDIA DGX Spark
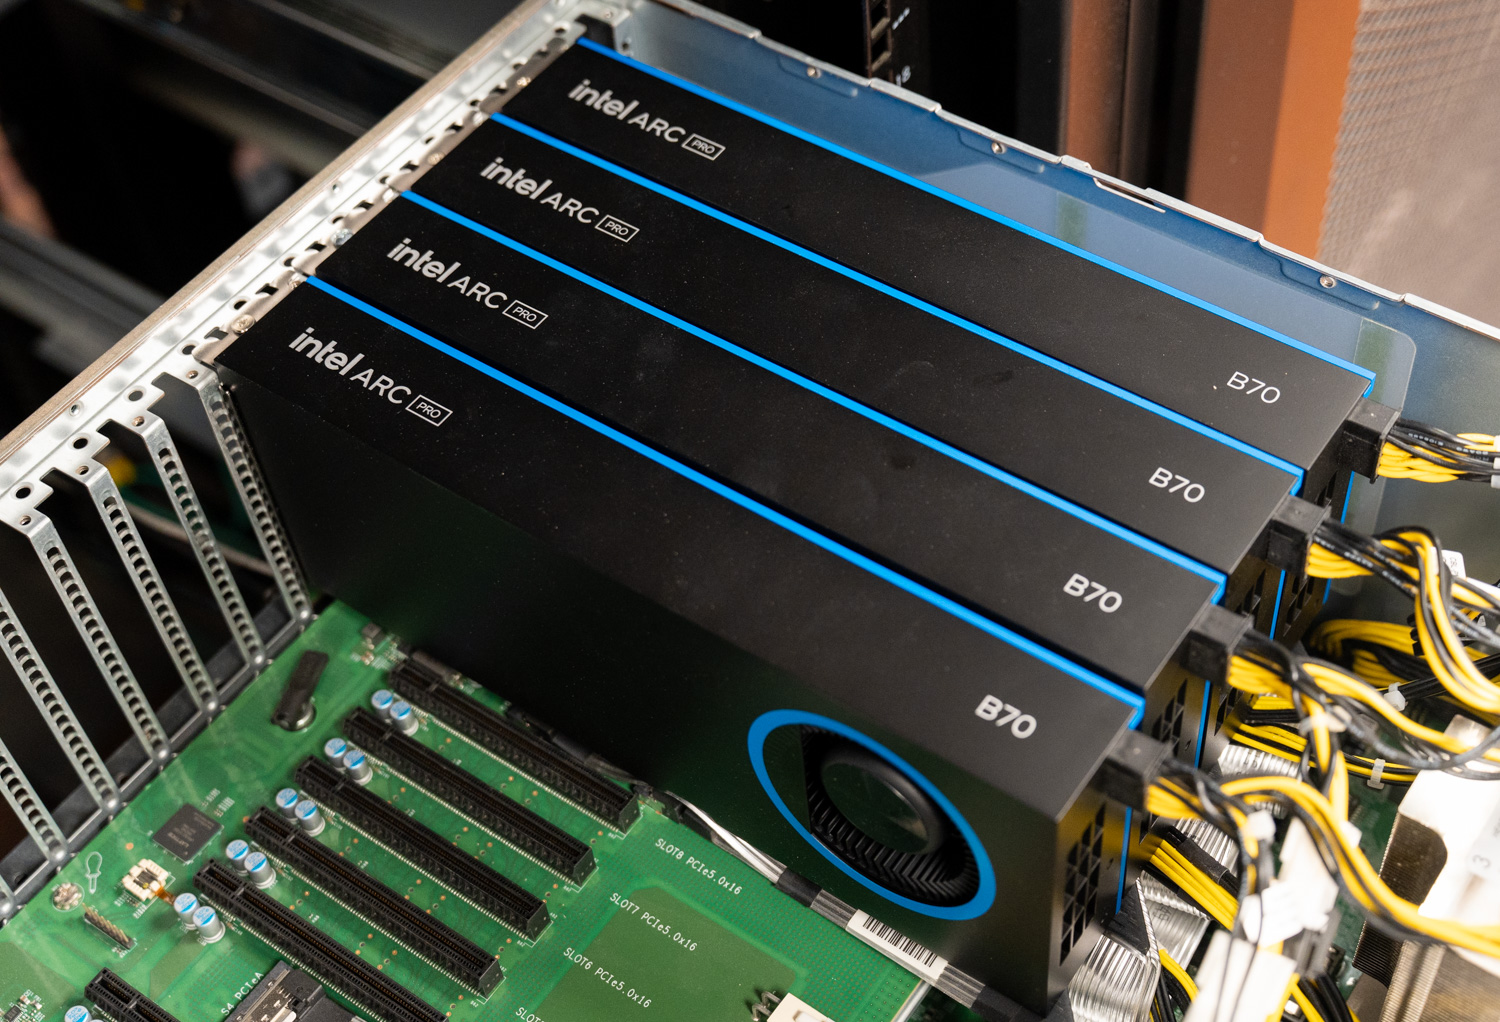
We tested four B70s (128GB) and four B60s (96GB) in the Supermicro host against a single RTX Pro 6000 and a single DGX Spark. The uneven GPU counts are deliberate: at a $949 list price, a four-card B70 set lands near the price of a single Spark and well under a single RTX Pro 6000, so this comparison aligns platforms by rough dollar investment rather than by card count.
Mistral Small 24B
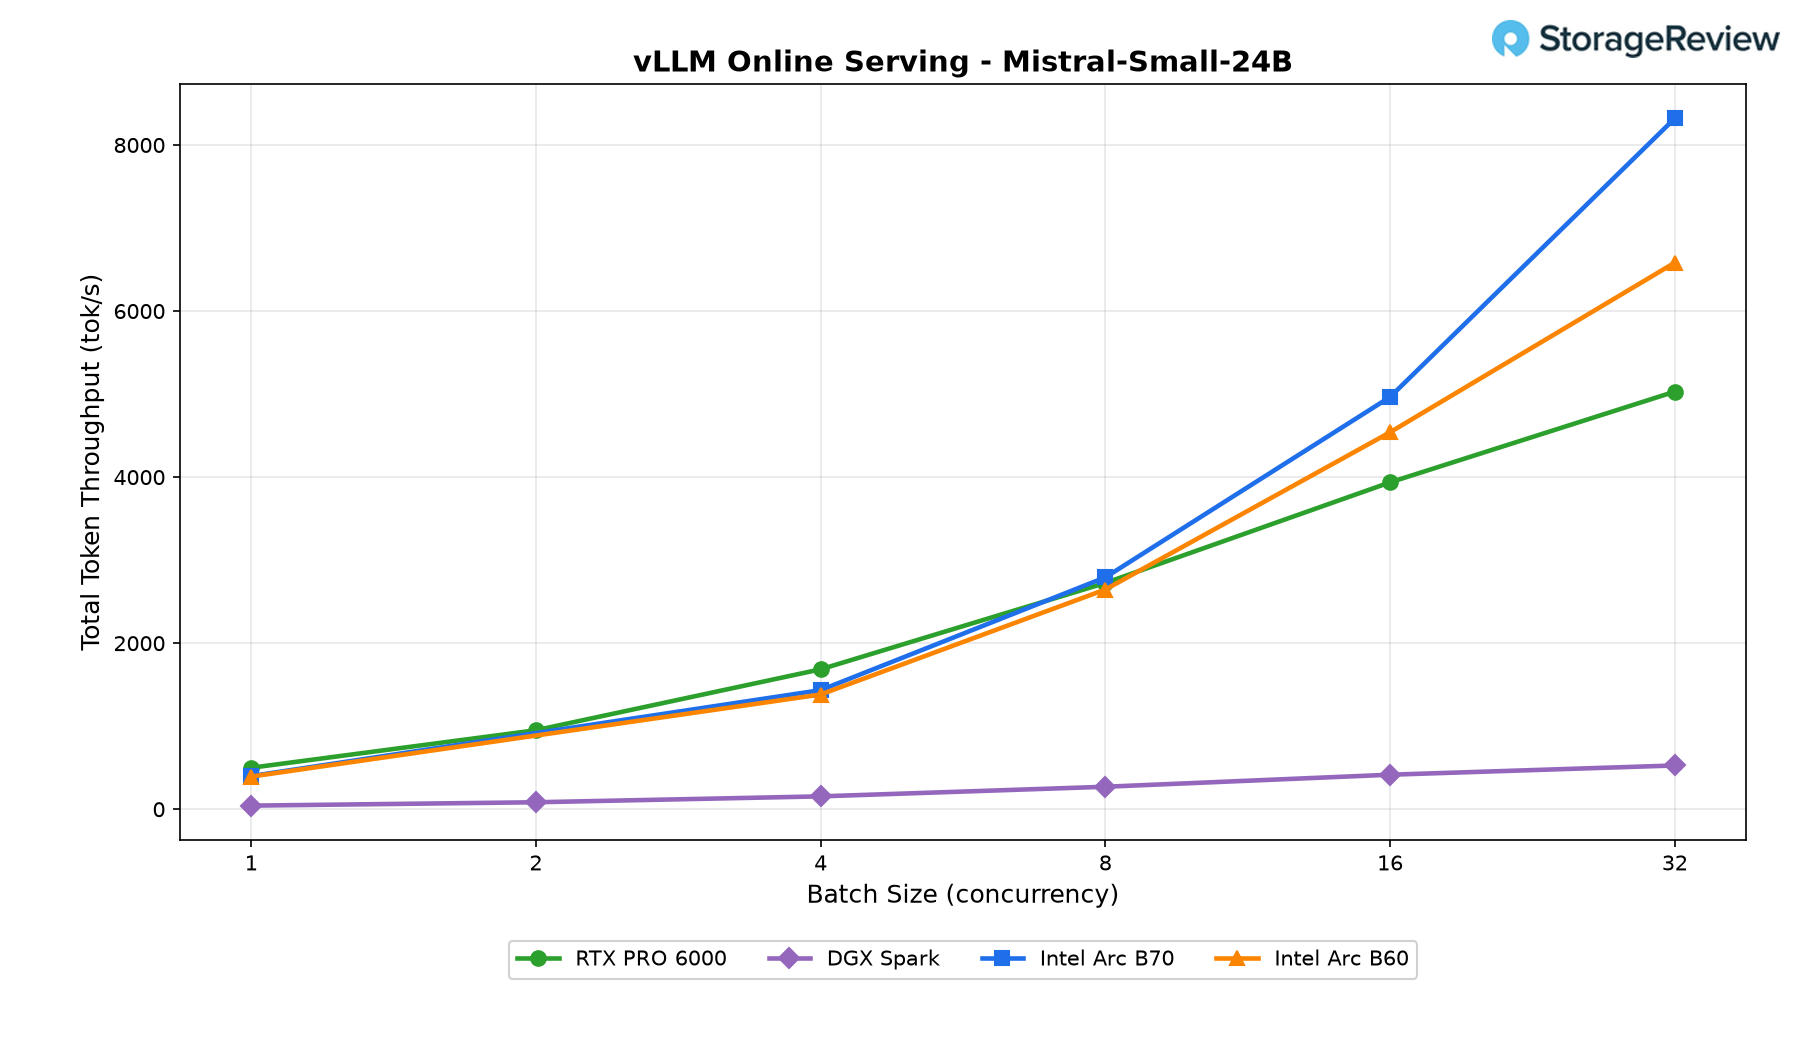
The Intel Arc Pro B70 delivered its strongest showing in the Mistral-Small-24B workload, scaling from 450 tok/s at batch size 1 to 8,321 tok/s at batch size 32. While the RTX PRO 6000 held a slight advantage through batch size 4, the B70 overtook it at batch size 8 and steadily widened the gap, finishing about 65% ahead at the highest concurrency. Compared to its smaller sibling, the Arc Pro B60, the B70 maintained a modest lead early on and extended that advantage to roughly 26% by batch size 32. The DGX Spark remained well behind throughout the test, peaking at just 527 tok/s, leaving the B70 nearly 16 times faster under maximum load.
Qwen3 Coder 30B
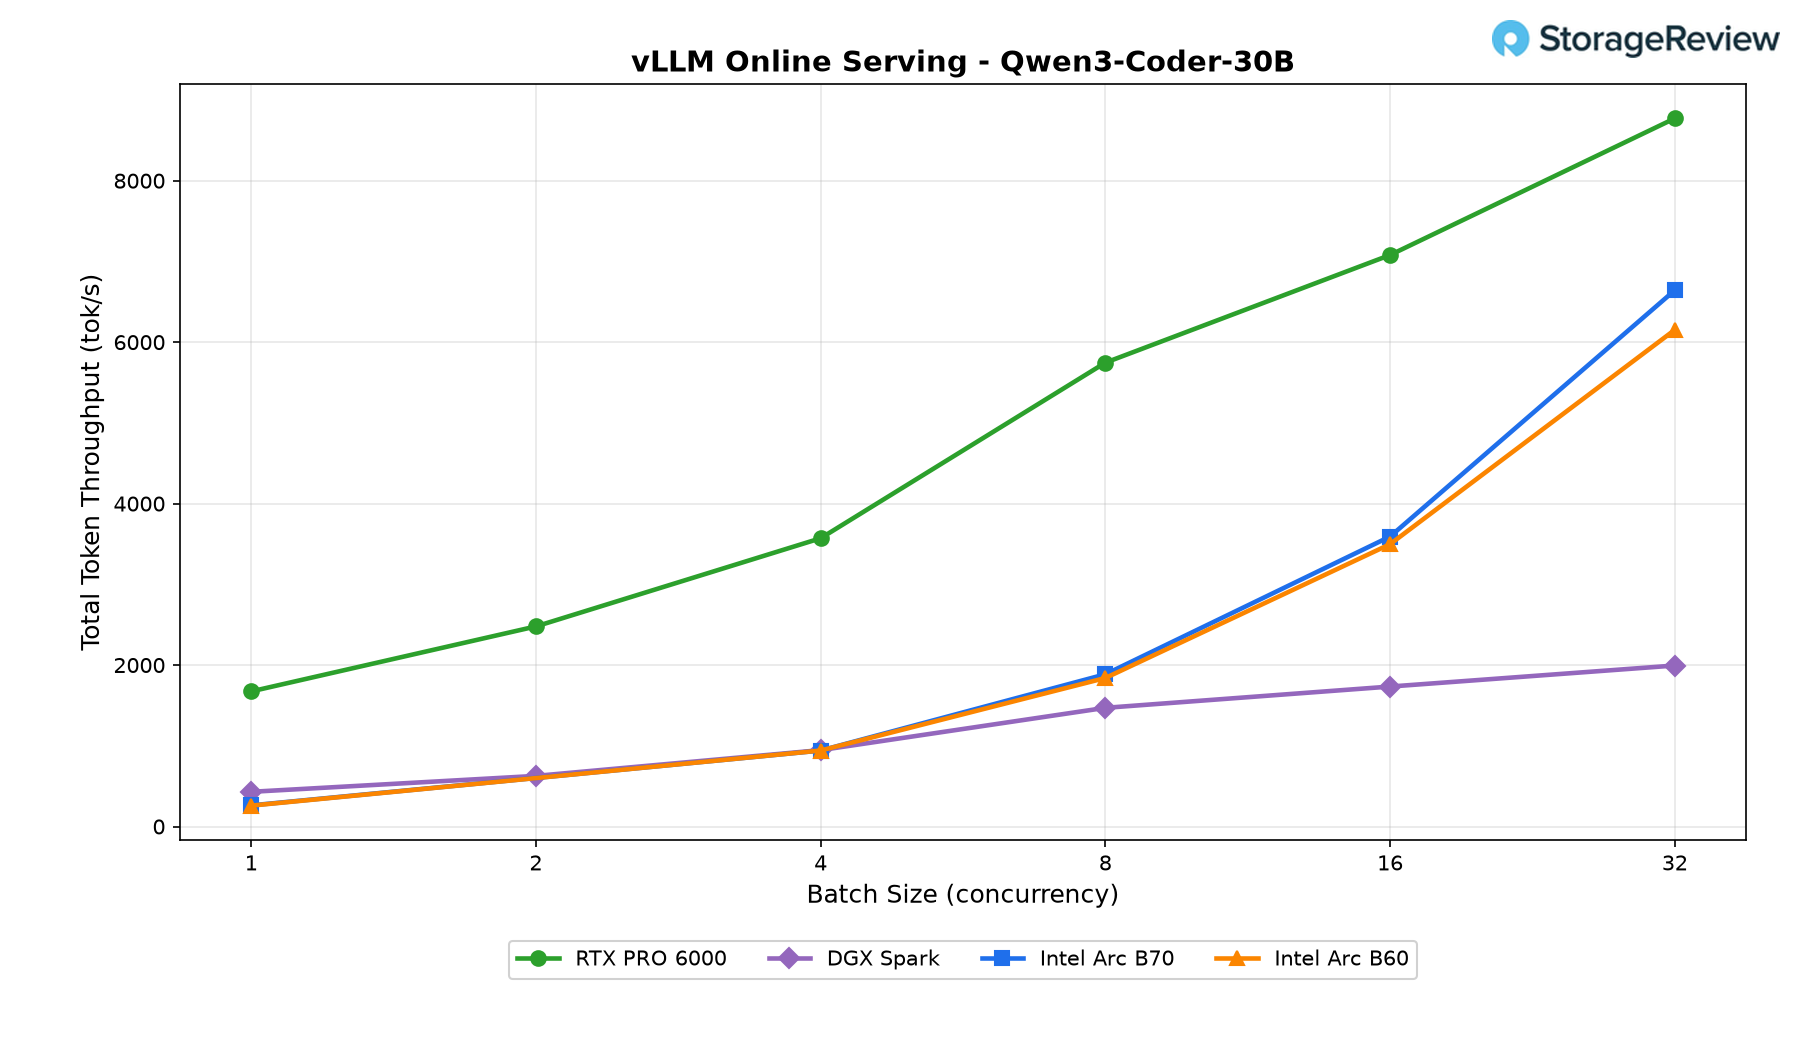
Qwen3-Coder-30B favored the RTX PRO 6000, which maintained the highest throughput across all concurrency levels, finishing at 8,772 tok/s. The Intel Arc Pro B70 nevertheless scaled well, reaching 6,643 tok/s at a batch size of 32 while maintaining a small but consistent advantage over the Arc Pro B60, finishing roughly 8% faster. Although it could not match the RTX PRO 6000 in this developer-oriented workload, the B70 still delivered more than three times the throughput of the DGX Spark at maximum concurrency, highlighting its ability to handle a larger number of simultaneous inference requests efficiently.
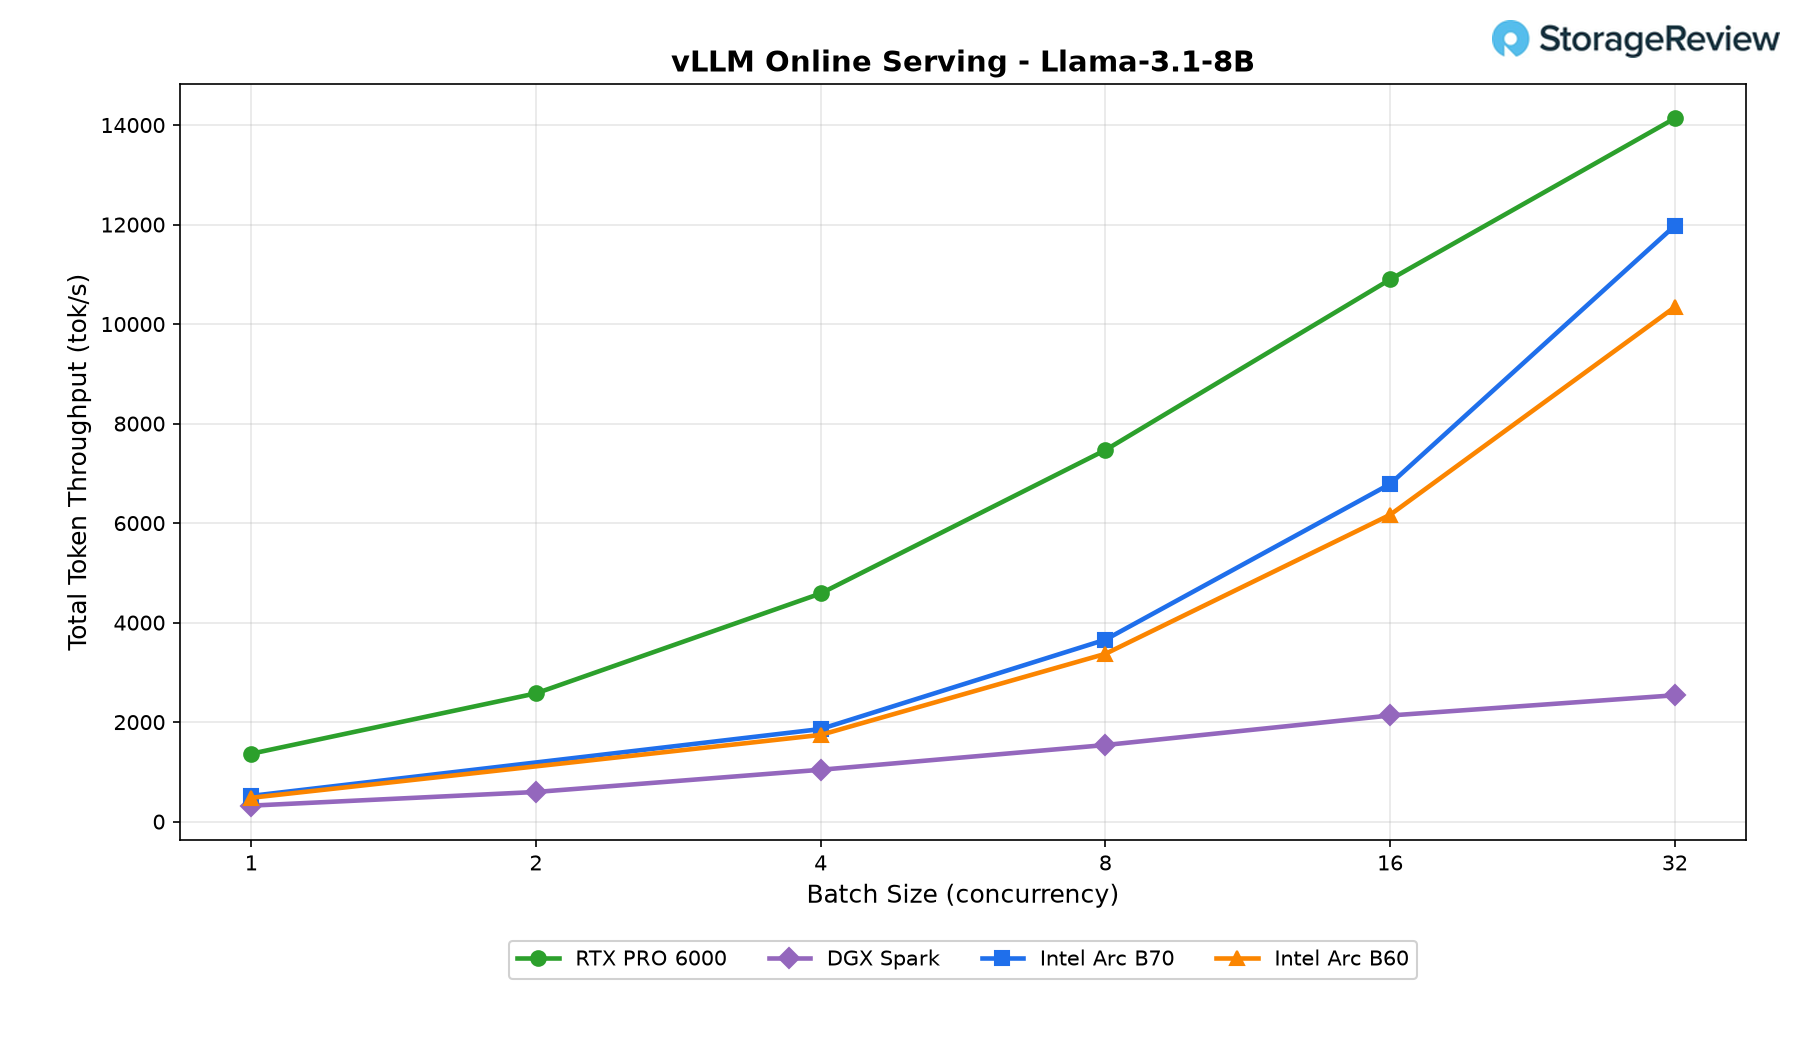
Llama 3.1 8B
With the smaller Llama-3.1-8B model, all of the discrete GPUs scaled aggressively as concurrency increased, though the RTX PRO 6000 remained the clear performance leader. The Intel Arc Pro B70 climbed to nearly 12,000 tok/s by batch size 32, placing it approximately 16% ahead of the Arc Pro B60 while reaching about 85% of the RTX PRO 6000’s throughput. The gap over the DGX Spark continued to widen as concurrency increased, with the B70 producing roughly 4.7 times the throughput at the highest batch size. The results also demonstrate that the B70 benefits substantially from larger request queues, allowing it to capitalize on available GPU resources.
GPT OSS 20B
The GPT-OSS-20B benchmark again placed the RTX PRO 6000 at the top of the chart, finishing at nearly 16,900 tok/s. The Intel Arc Pro B70 reached just over 10,000 tok/s, maintaining a small but measurable lead over the Arc Pro B60 across the scaling curve, ending about 7% faster at batch size 32. While it trailed NVIDIA’s flagship workstation GPU by roughly 40%, it still delivered nearly three times the throughput of the DGX Spark. The nearly linear scaling beyond batch size 8 also suggests the B70 remains well utilized as concurrent requests increase.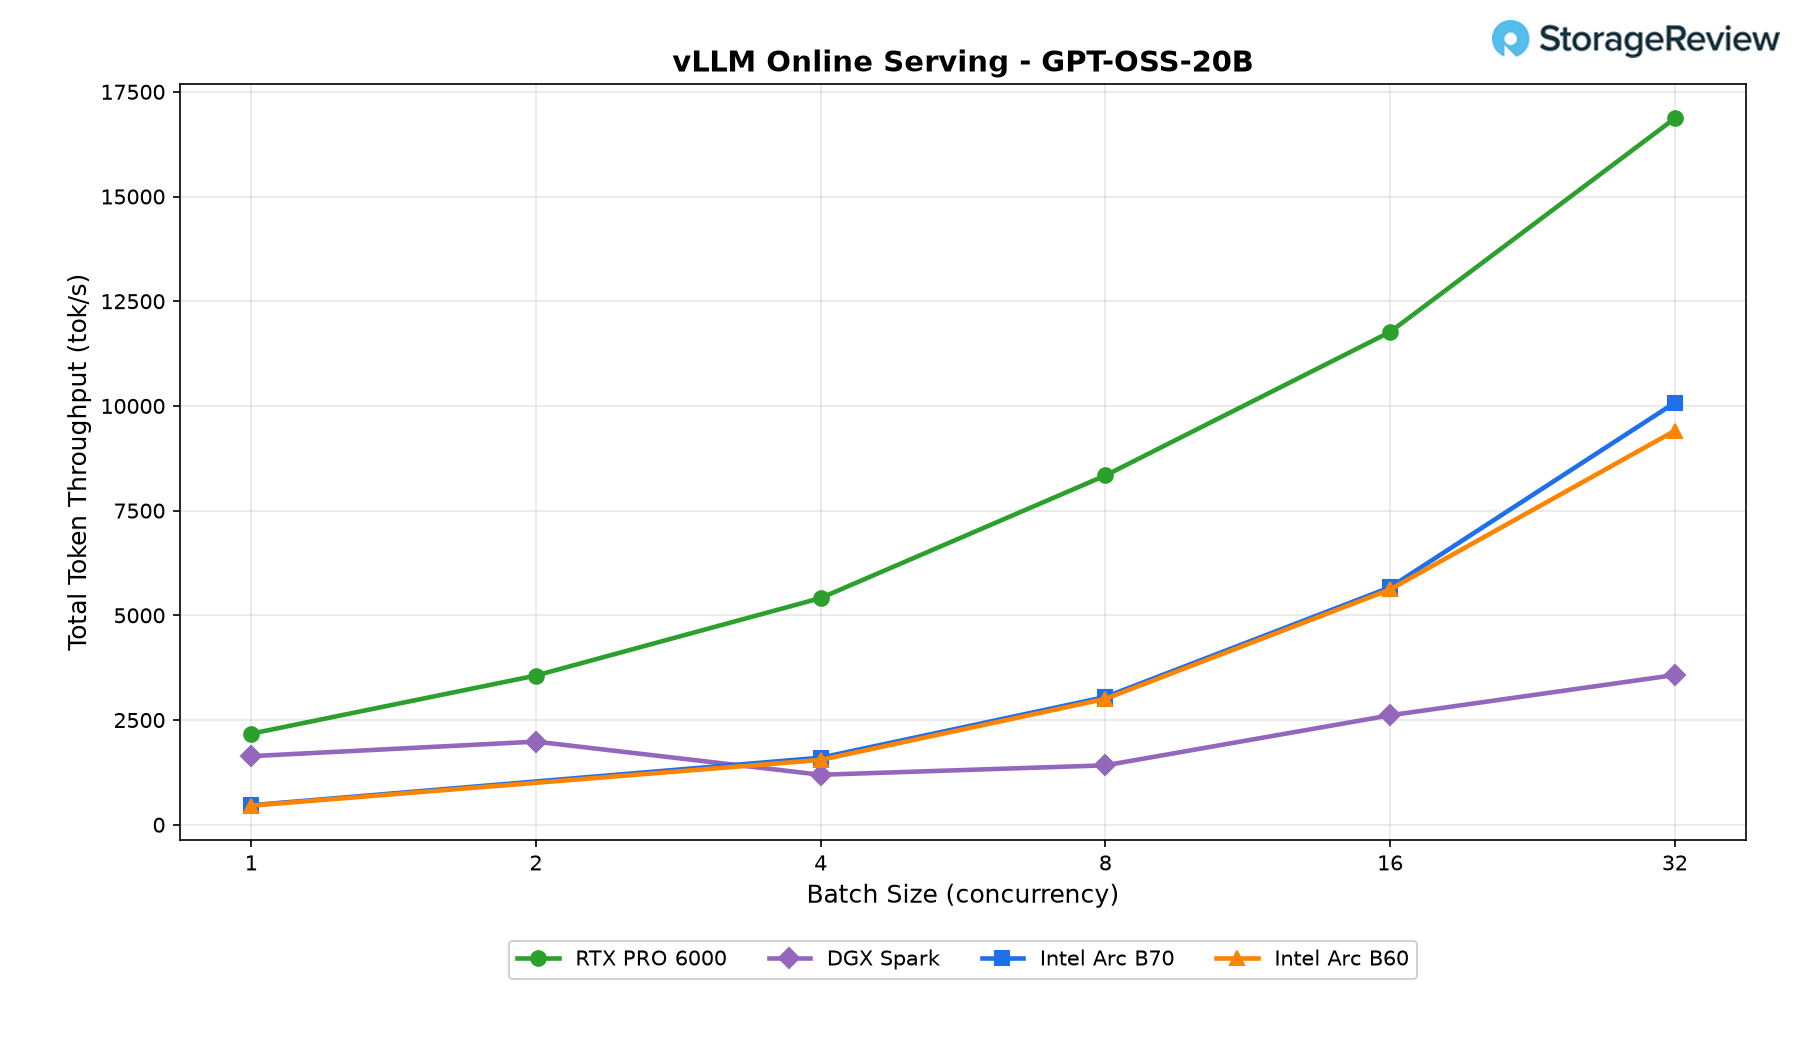
GPT OSS 120B
The largest model in the group proved more demanding across all platforms, yet the Intel Arc Pro B70 continued to scale efficiently. It finished at 6,870 tok/s, approximately 7% ahead of the Arc Pro B60 while achieving about three-quarters of the RTX PRO 6000’s throughput. The DGX Spark reached 2,175 tok/s at the same concurrency level, giving the B70 a roughly 3.2× advantage. While the RTX PRO 6000 maintained its overall lead, the B70 demonstrated it remains highly competitive for serving larger language models, particularly when higher concurrency keeps the hardware fully occupied.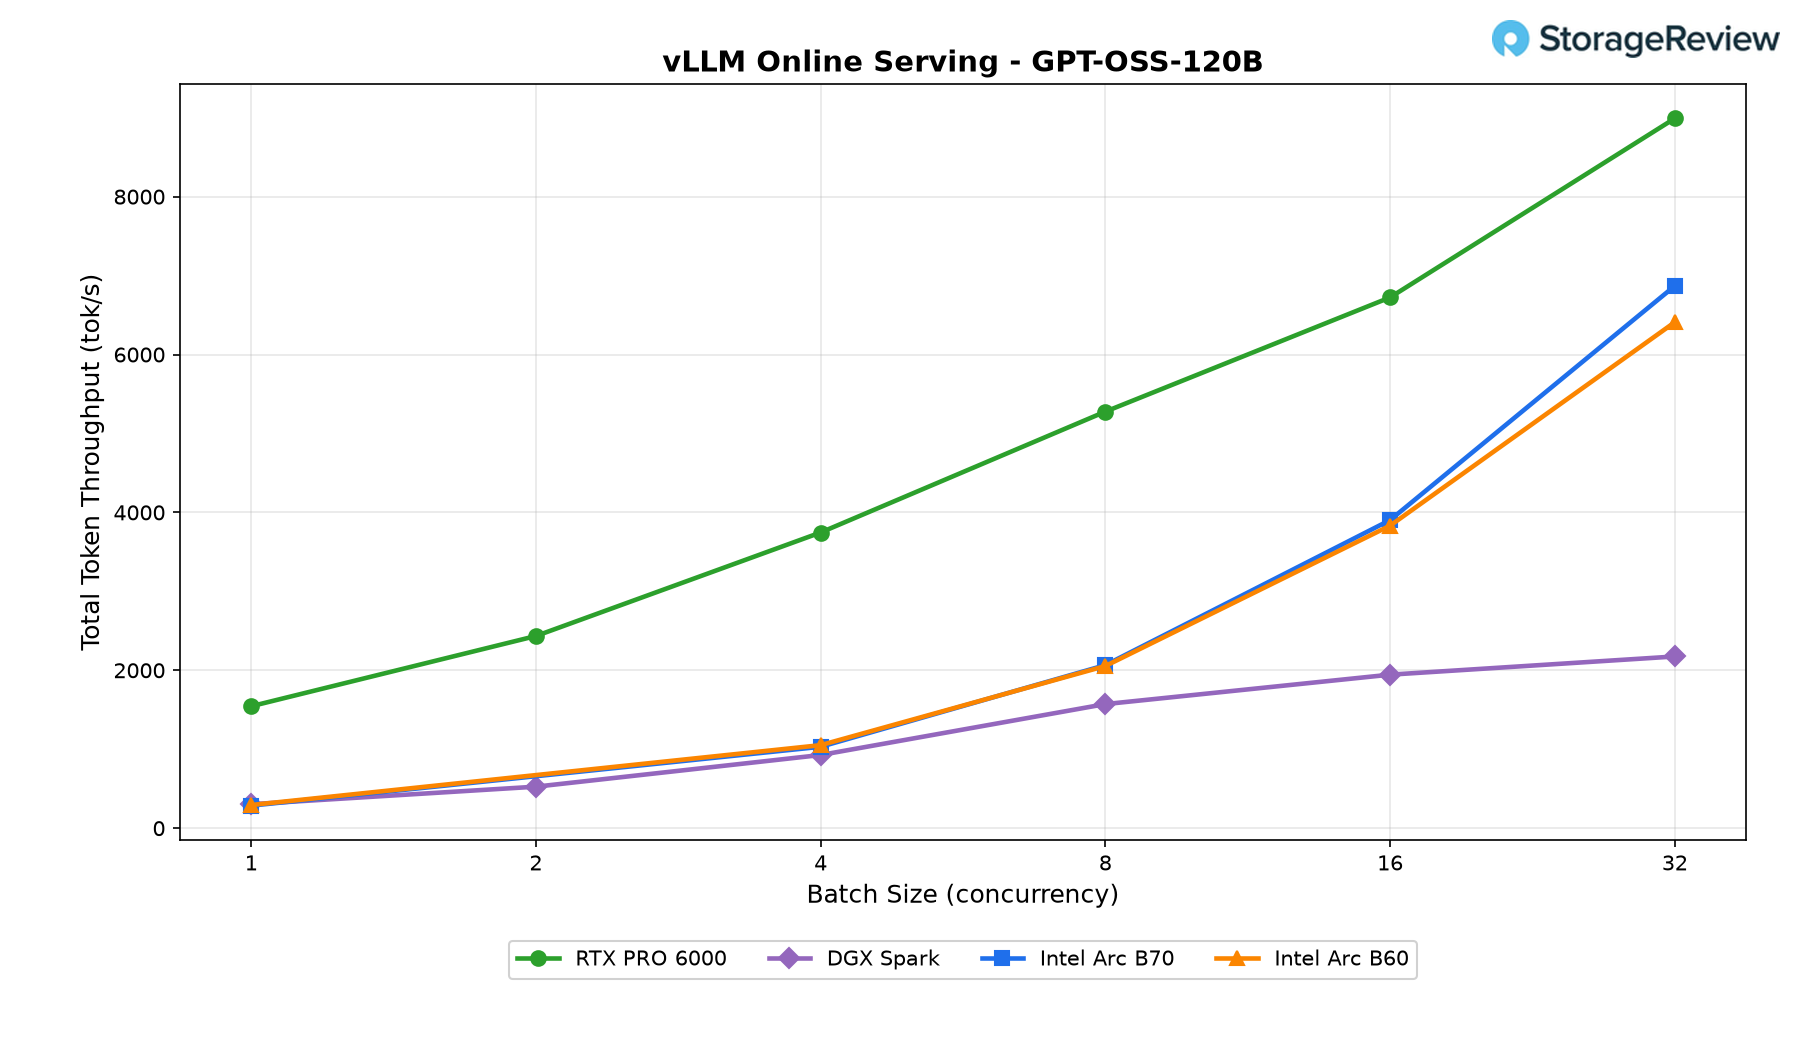
Conclusion
The Intel Arc Pro B70 is one of the most compelling workstation AI GPUs Intel has released to date. At its $949 launch MSRP, it carved out a unique position by pairing 32GB of ECC GDDR6 with performance that, in many AI and professional workloads, exceeded similarly priced consumer GPUs while significantly undercutting workstation-class NVIDIA alternatives. Even with current market pricing pushing the card above $1,100, the value proposition remains attractive compared to products like the RTX Pro 4000, especially for users who need large local models or multi-GPU deployments, where memory capacity is the limiting factor rather than raw compute.
From a hardware standpoint, the Intel Arc Pro B70 delivered: it effectively tied the RTX 5060 Ti in Stable Diffusion 1.5 image generation, posted respectable rendering results, and served modern language models at rates that make it a legitimate option for local AI infrastructure, reaching nearly 12,000 tok/s in Llama 3.1 8B and, with four cards, beating our single RTX Pro 6000 reference by 65% in Mistral Small 24B at full concurrency. Four B70s in a single workstation provide 128GB of VRAM for roughly $3,800 at list, well under the price of a single high-end workstation GPU.
The biggest challenge facing the Arc Pro B70 isn’t the silicon; it’s the software ecosystem surrounding it. Driver quality and framework support continue to trail both NVIDIA’s CUDA ecosystem and AMD’s increasingly mature ROCm stack. While Intel has made meaningful progress with oneAPI, OpenVINO, and its Battlemage-enabled vLLM development work, users should still expect occasional compatibility issues, limited model support, and a greater willingness to troubleshoot than they would with competing platforms. Those looking for a turnkey GPU that “just works” across virtually every AI framework and application will still find NVIDIA and AMD the safer choices.
Ultimately, the Arc Pro B70 is easy to recommend for buyers who value VRAM capacity, workstation features, and AI performance per dollar, provided they understand what they’re buying into. It is an outstanding piece of hardware backed by aggressive pricing, but its long-term success depends almost entirely on Intel’s commitment to continuing software development and expanding ecosystem support. If Intel can sustain that investment, the B70 has the hardware foundation to become one of the stronger values in consumer and professional AI acceleration. If not, it risks remaining a card with tremendous potential that never quite achieves the effortless usability of its NVIDIA and AMD competitors.


 Amazon