

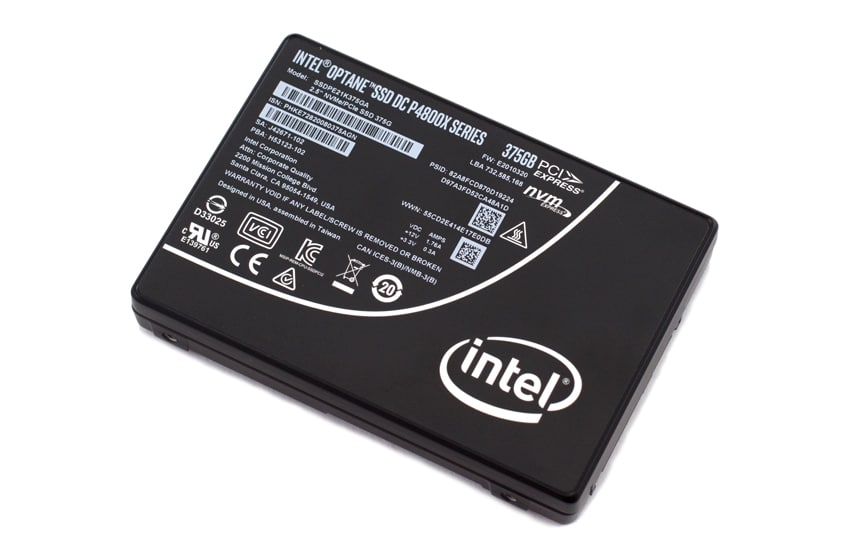
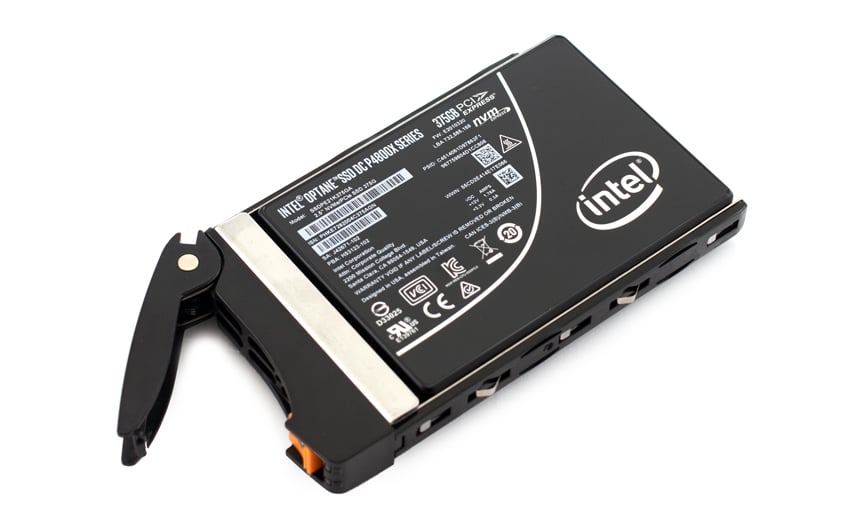
Intel’s Optane SSD DC P4800X series was launched back in March of 2017 with the promise of bringing a new storage class memory (SCM) media called 3D XPoint (Intel branded as Optane) to market. The P4800X launched as both a traditional 2.5″ NVMe drive (U.2) as well as a PCIe add-in card. Initial capacities started out at 375GB with plans to get to 1.5TB by the end of 2017. That capacity goal didn’t come to fruition, but Intel did launch 750GB Optane models in November. Regardless of capacity, the P4800X has one job and that is to deliver the highest-speed storage possible to latency-sensitive applications in the data center.
Given the smaller capacity of the drives, it’s less likely that the enterprise will fill up JBODs with P4800X SSDs to use for primary storage. Though that’s certainly possible as a point solution for applications that can benefit from faster storage like small analytics data sets and BI use cases. The enterprise array vendors also haven’t rushed to embrace Optane in quantity in their system designs, again largely because of the capacity limitations. HPE has, however, explored the use of Optane as a cache for 3PAR systems and others are certainly looking to integrate this class of storage into their systems as the technology matures. There are, however, an immediate set of excellent use cases for Optane-based SSDs in the world of software-defined storage where designs have more flexibility to account for this new class of storage.
VMware vSAN is perhaps the most visible in this space as they offered day 0 support for the P4800X and have a commanding lead in the HCI space. vSAN is also uniquely well positioned to take advantage of these smaller drives because they operate in a two-tier architecture. vSAN storage is coordinated into disk groups, with a tier for all incoming write activity as well as a capacity-oriented read tier. Currently vSAN only leverages up to 600GB per drive in the write tier, so the smaller capacities of the P4800X aren’t really a limitation. For vSAN users, this means that for deployments with the P4800X acting as a cache drive, writes are going at the fastest possible speed to vSAN clusters.
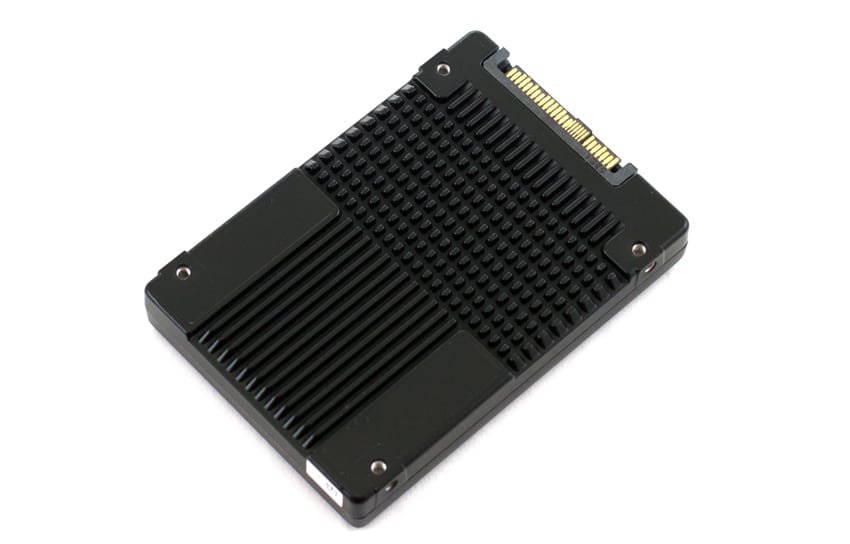
This review is of the P4800X in 375GB U.2 form factor. While largely working as part of a disk group for our upcoming vSAN review, we were able to run a subset of our normal enterprise SSD tests to give a more complete picture as to the P4800X’s performance profile.
Intel Optane SSD DC P4800X Specifications
| Form factor | AIC HHHL, U.2 |
| Capacity | 375GB, 750GB |
| Interface | PCIe 3×4, NVMe |
| Latency | <10μs |
| QoS | |
| 4KB Random, Queue Depth 1, Read/Write | <60/100μs |
| 4KB Random, Queue Depth 16, R/W | <150/200μs |
| Throughput | |
| 4KB Random, Queue Depth 16, R/W | up to 550/500K IOPS |
| 4KB Random, Queue Depth 16, Mixed 70/30 R/W | up to 500K IOPS |
| Endurance | |
| DWPD | 30 |
| Petabytes Written | |
| 375GB | 20.5PBW |
| 750GB | 41PBW |
Performance
Testbed
Our Enterprise SSD reviews leverage a Lenovo ThinkSystem SR850 for application tests and a Dell PowerEdge R740xd for synthetic benchmarks. The ThinkSystem SR850 is a well-equipped quad-CPU platform, offering CPU power well in excess of what’s needed to stress high-performance local storage. Synthetic tests that don’t require a lot of CPU resources use the more traditional dual-processor server. In both cases, the intent is to showcase local storage in the best light possible that aligns with storage vendor maximum drive specs.
Lenovo ThinkSystem SR850
- 4 x Intel Platinum 8160 CPU (2.1GHz x 24 Cores)
- 16 x 32GB DDR4-2666Mhz ECC DRAM
- 2 x RAID 930-8i 12Gb/s RAID Cards
- 8 NVMe Bays
- VMware ESXI 6.5
Dell PowerEdge R740xd
- 2 x Intel Gold 6130 CPU (2.1GHz x 16 Cores)
- 16 x 16GB DDR4-2666MHz ECC DRAM
- 1x PERC 730 2GB 12Gb/s RAID Card
- Add-in NVMe Adapter
- Ubuntu-16.04.3-desktop-amd64
Testing Background and Comparables
The StorageReview Enterprise Test Lab provides a flexible architecture for conducting benchmarks of enterprise storage devices in an environment comparable to what administrators encounter in real deployments. The Enterprise Test Lab incorporates a variety of servers, networking, power conditioning, and other network infrastructure that allows our staff to establish real-world conditions to accurately gauge performance during our reviews.
We incorporate these details about the lab environment and protocols into reviews so that IT professionals and those responsible for storage acquisition can understand the conditions under which we have achieved the following results. None of our reviews are paid for or overseen by the manufacturer of equipment we are testing. Additional details about the StorageReview Enterprise Test Lab and an overview of its networking capabilities are available on those respective pages.
Comparables for this review:
- Memblaze PBlaze5 3.2TB
- Intel P4510 2TB
- Samsung PM1725a 1.6TB
- Huawei ES3000 V5 3.2TB
- Toshiba PX04 1.6TB
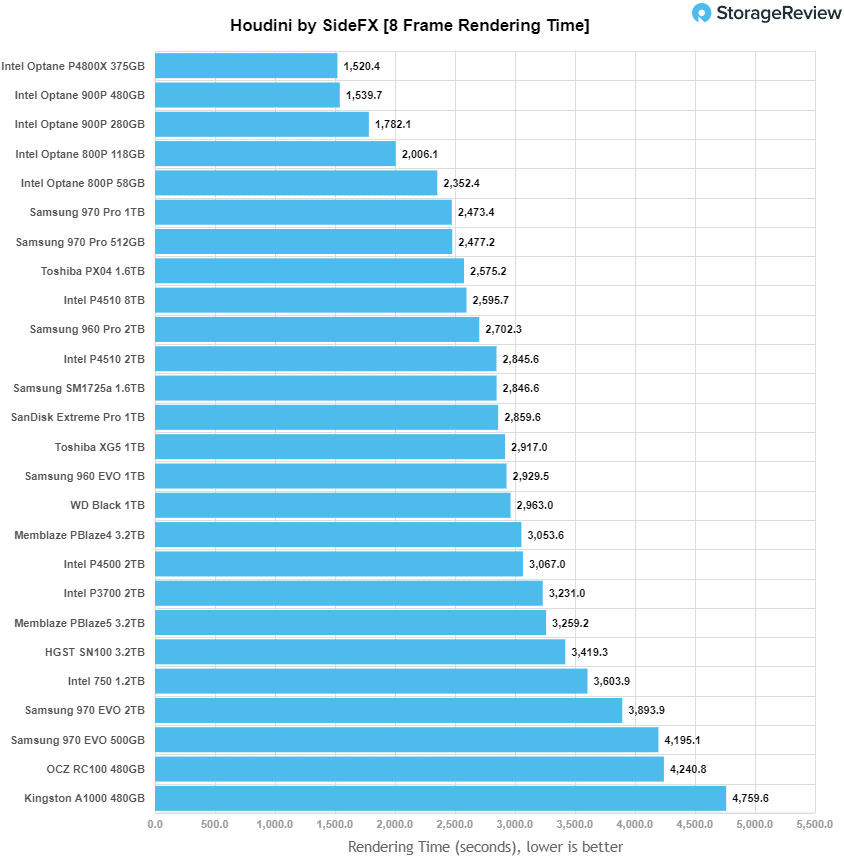
Houdini by SideFX
The Houdini test is specifically designed to evaluate storage performance as it relates to CGI rendering. The test bed for this application is a variant of the core Dell PowerEdge R740xd server type we use in the lab with dual Intel 6130 CPUs and 64GB DRAM. In this case, we installed Ubuntu Desktop (ubuntu-16.04.3-desktop-amd64) running bare metal. Output of the benchmark is measured in seconds to complete, with fewer being better.
The Maelstrom demo represents a section of the rendering pipeline that highlights the performance capabilities of storage by demonstrating its ability to effectively use the swap file as a form of extended memory. The test does not write out the result data or process the points in order to isolate the wall-time effect of the latency impact to the underlying storage component. The test itself is composed of five phases, three of which we run as part of the benchmark, which are as follows:
- Loads packed points from disk. This is the time to read from disk. This is single threaded, which may limit overall throughput.
- Unpacks the points into a single flat array in order to allow them to be processed. If the points do not have dependency on other points, the working set could be adjusted to stay in-core. This step is multi-threaded.
- (Not Run) Processes the points.
- Repacks them into bucketed blocks suitable for storing back to disk. This step is multi-threaded.
- (Not Run) Writes the bucketed blocks back out to disk.
The Intel Optane SSD DC P4800X took the top spot in the Houdini test with 1,520.4 seconds. The P4800X had the best performance of any of the Optane drives, as well as best overall.
VDBench Workload Analysis
When it comes to benchmarking storage devices, application testing is best, and synthetic testing comes in second place. While not a perfect representation of actual workloads, synthetic tests do help to baseline storage devices with a repeatability factor that makes it easy to do “apples-to-apples” comparison between competing solutions. These workloads offer a range of different testing profiles ranging from “four corners” tests, common database transfer size tests, to trace captures from different VDI environments. All of these tests leverage the common vdBench workload generator, with a scripting engine to automate and capture results over a large compute testing cluster. This allows us to repeat the same workloads across a wide range of storage devices, including flash arrays and individual storage devices. Our testing process for these benchmarks fills the entire drive surface with data, then partitions a drive section equal to 25% of the drive capacity to simulate how the drive might respond to application workloads. This is different than full entropy tests which use 100% of the drive and take them into steady state. As a result, these figures will reflect higher-sustained write speeds.
Profiles:
- 4K Random Read: 100% Read, 128 threads, 0-120% iorate
- 4K Random Write: 100% Write, 64 threads, 0-120% iorate
- 64K Sequential Read: 100% Read, 16 threads, 0-120% iorate
- 64K Sequential Write: 100% Write, 8 threads, 0-120% iorate
- Synthetic Database: SQL and Oracle
- VDI Full Clone and Linked Clone Traces
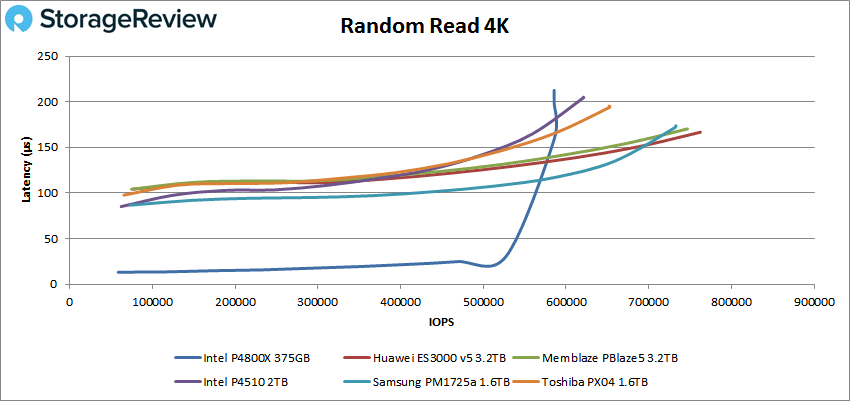
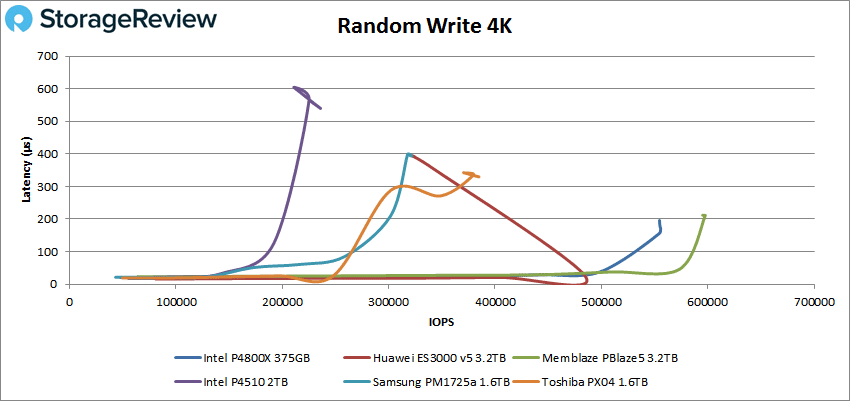
For 4K peak random performance, the Intel Optane SSD DC P4800X (referred to as the P4800X from here on) started off with much lower latency than the other drives before spiking up just after 500K IOPS and finishing last with 585,754 IOPS with a latency of 213μs.
With 4K peak write performance, the P4800X had a better showing, finishing second with a peak performance of roughly 554K IOPS and a latency of only 155μs.
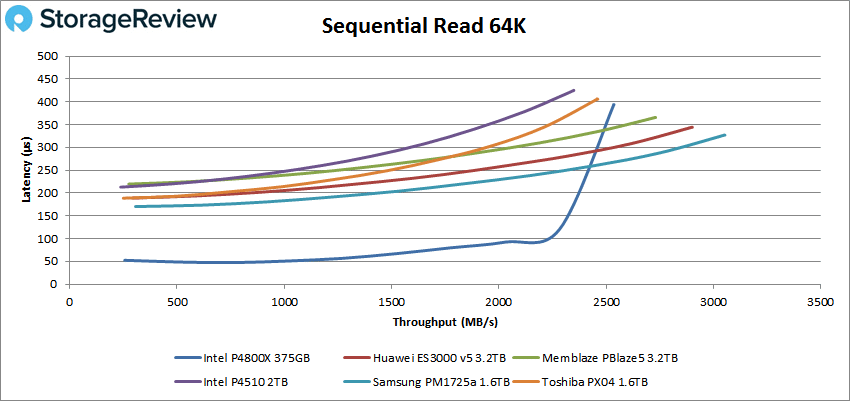
Switching over to sequential workloads, in our 64K read we saw a similar pattern to the 4K read. The P4800X started off with much lower latency than the other drives before spiking up at about 35K IOPS and peaking at 40,558 IOPS or 2.53GB/s at a latency of 394μs. This placed the drive at fourth overall.
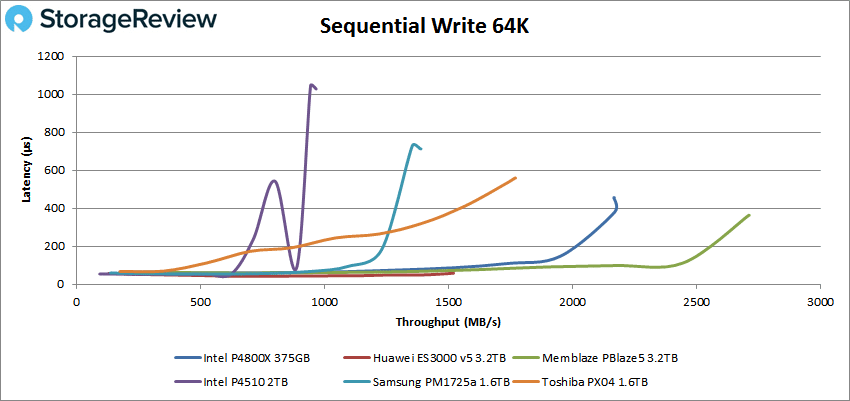
For the 64K write, the P4800X came in second with a peak performance of roughly 34,700 IOPS or 2.17GB/s at a latency of 380μs before dropping off slightly.
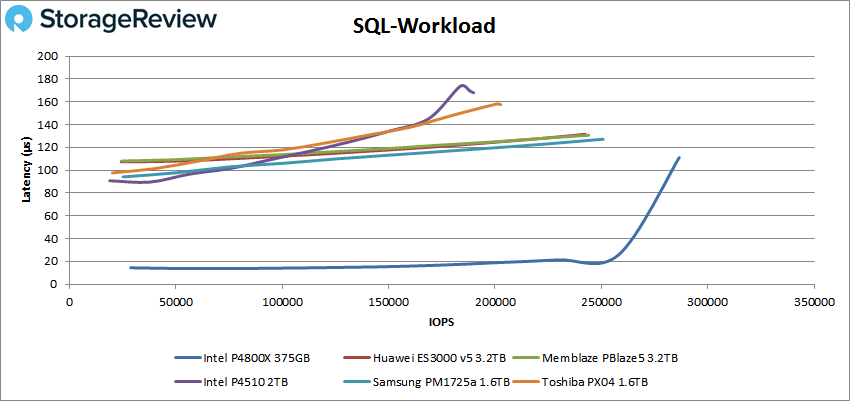
With our SQL workload we see the P4800X leap to the front by a wide margin with a peak score of 286,548 IOPS with a latency of only 111μs.
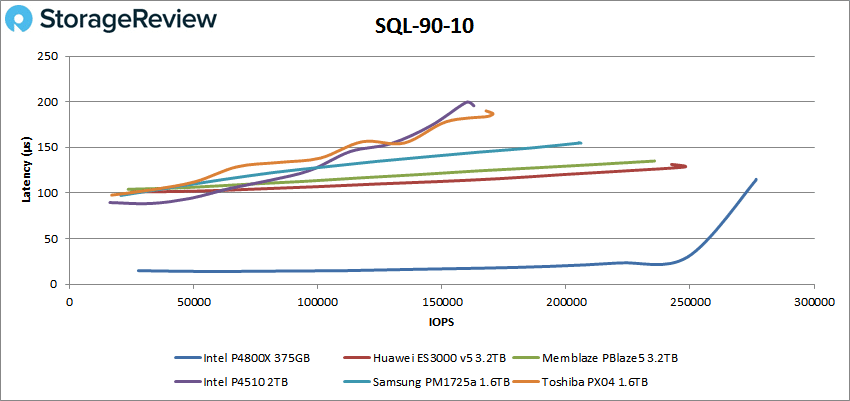
In our SQL90-10, the P4800X continued its reign with a top score of 276,530 IOPS with a latency of 114μs.
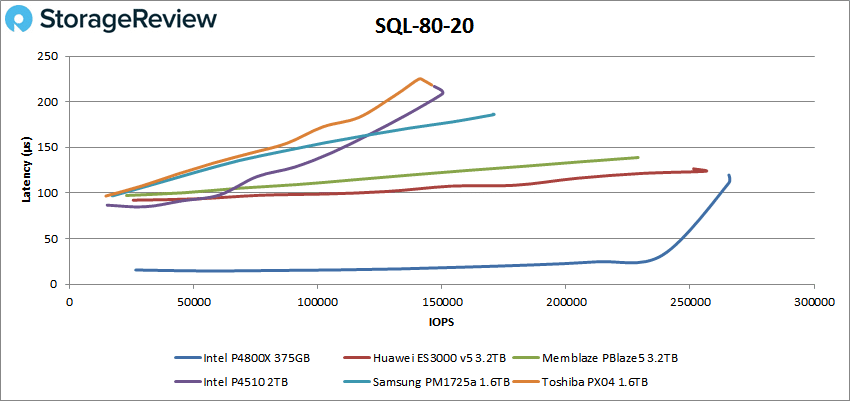
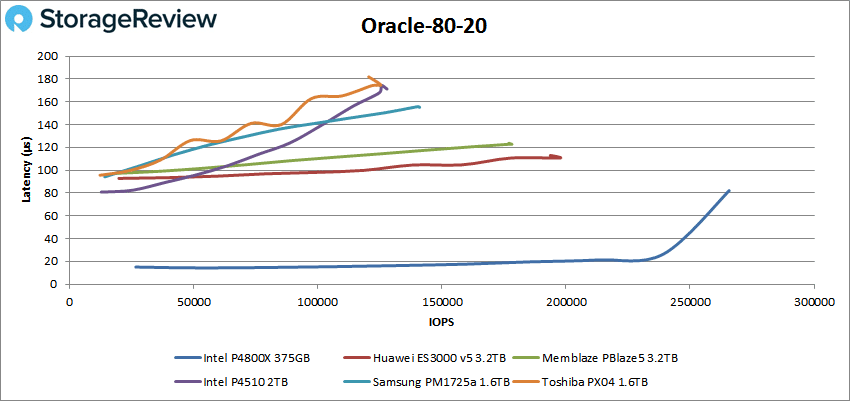
Staying in first place in the SQL 80-20, the P4800X peaked at roughly 266K IOPS with a latency of approximately 111μs before a small drop off.
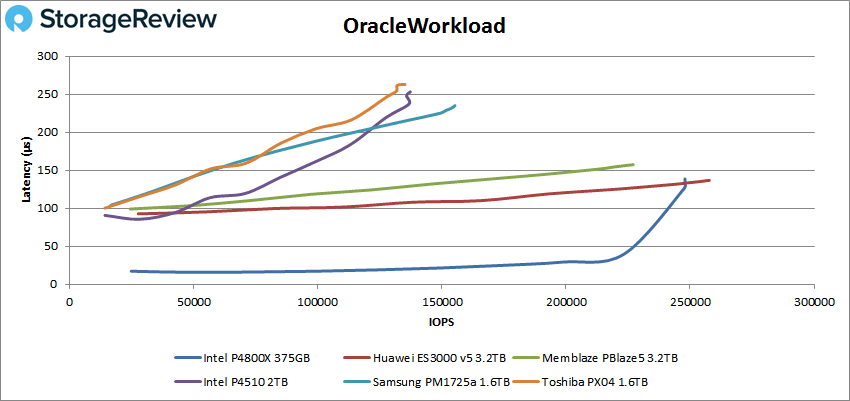
Flipping over to our Oracle workloads, the P4800X took second with a peak score of nearly 248K IOPS and a latency of 127μs.
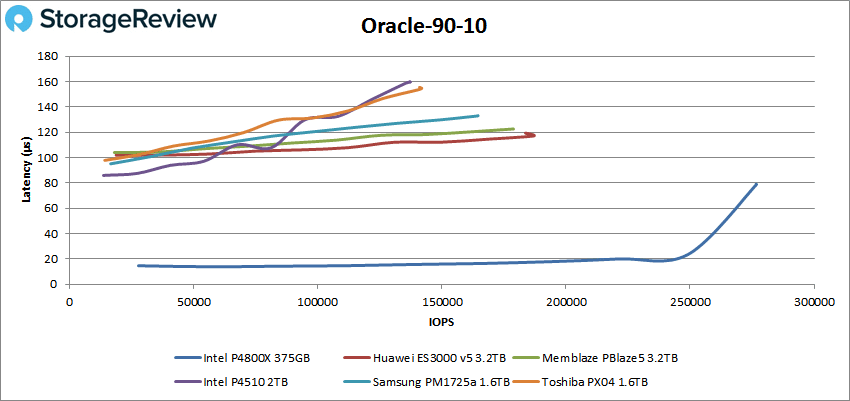
In the Oracle 90-10, the P4800X blew away the other drives with a peak performance of 276,703 IOPS with a latency of only 79μs.
Again in the Oracle 80-20, we saw the P4800X way out in front with 265,769 IOPS and a latency of just 82μs.
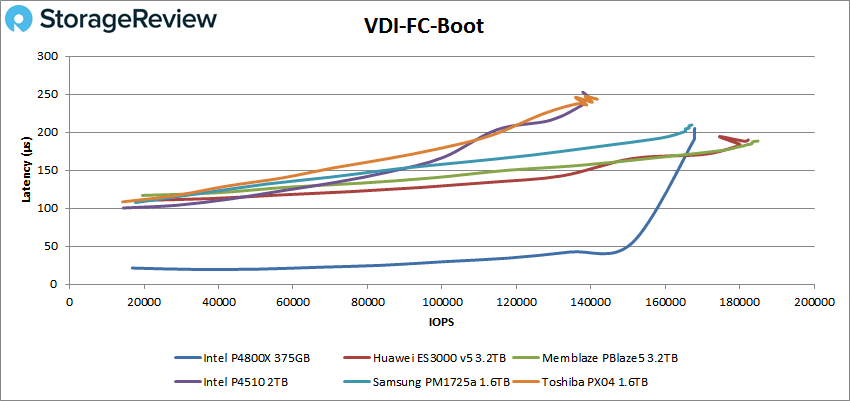
Next, we switched over to our VDI clone test, Full Clone (FC) and Linked Clone (LC). For VDI FC Boot, the P4800X started off extremely strong before jumping up and taking third place with a peak performance of 167,856 IOPS and a latency of 199μs.
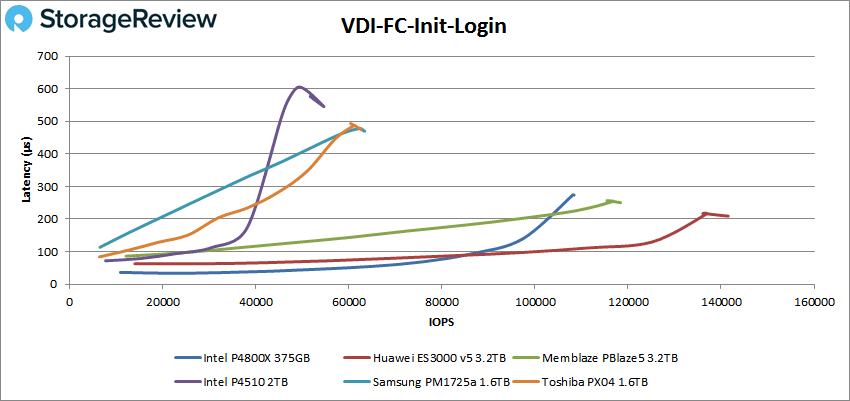
With VDI FC Initial Login, the P4800X took third again with 108,159 IOPS and a latency of 274μs.
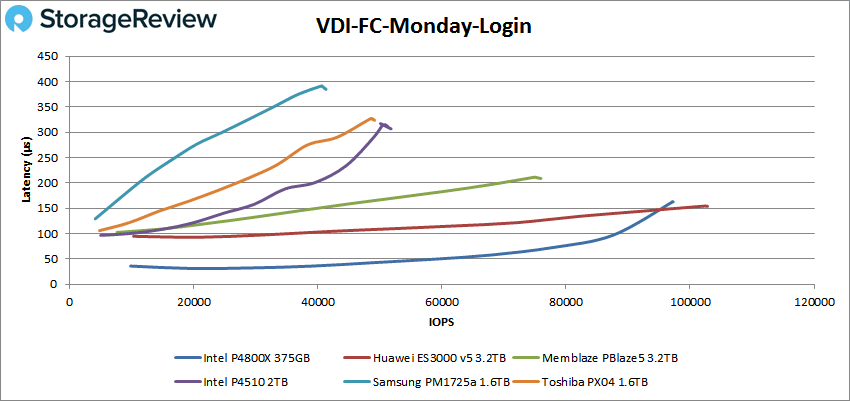
For VDI FC Monday Login, the P4800X jumped to second with a peak performance of 97,198 IOPS and a latency of 163μs.
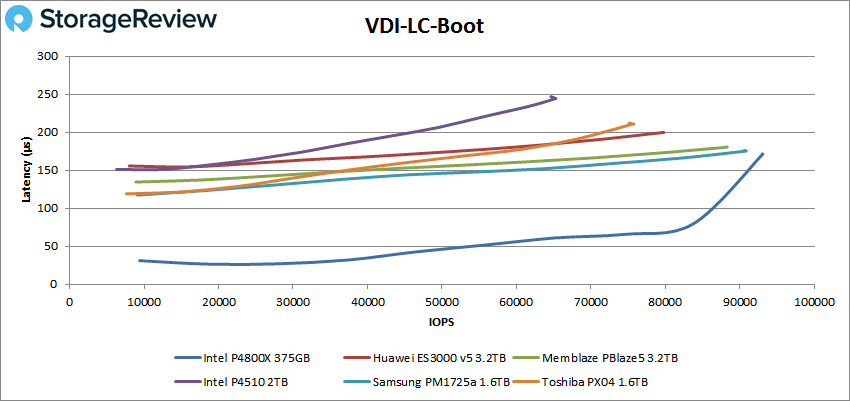
Moving on to VDI LC Boot, the P4800X was able to take the top spot with a score of 93,095 IOPS and a latency of 171μs.
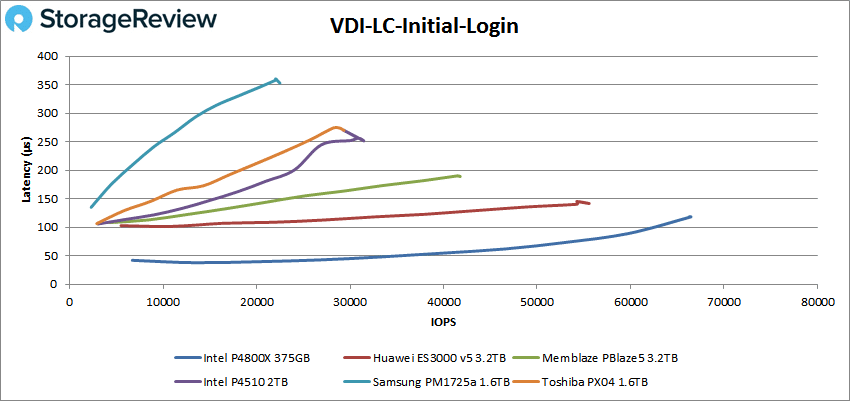
VDI LC Initial Login had another top place finish for the P4800X with a score of 66,463 IOPS and a latency of 118μs.
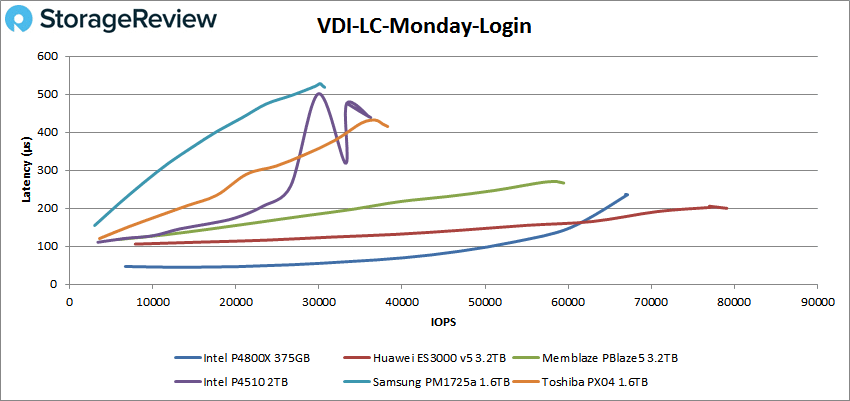
Finally, our VDI LC Monday Login test had the P4800X place second with 67,085 IOPS with a latency of 235μs.
Conclusion
The Intel Optane SSD DC P4800X is yet another drive released with Intel’s 3D XPoint technology. As the name implies, the drive is designed specifically for the data center and comes in common U.2 and AIC HHHL form factors. One of the drawbacks that immediately becomes apparent is that the drive is only offered in 375GB and 750GB capacities. This limits its use cases on one hand, but on the other, its use cases are predominantly geared toward workloads and applications where low latency is paramount versus capacity. In this regard, Optane technology has proven itself in both enterprise and end-user workloads to be the industry leader.
The P4800X’s small capacity is why we have a small hole in our normal barrage of benchmarks. The drive capacity wasn’t large enough to run SQL or Sysbench, so they are absent from this single-drive review. On the first application analysis workload we were able to run, Houdini by SideFX, the P4800X was the overall top performer with 1,520.4 seconds. In our VDBench, the P4800X dominated across the board at low queue depths. Top-end performance was more mixed with the P4800X where some traditional NVMe products surpassed it in performance. However, it did blow away others in areas such as SQL and Oracle 90-10 and 80-20. Highlights of the P4800X include over a half a million IOPS in both 4K tests, 2.53GB/s in 64K read and 2.17GB/s in 64K write. In all three SQL tests, the P4800X was over a quarter million IOPS and at or over 250K IOPS in our Oracle tests. But peak performance aside, the Intel Optane P4800X had extremely low latencies. In every test the latency started off very low, typically much lower than all other drives. And in a few cases, the P4800X had a peak performance with latency as low as 79μs in Oracle 90-10 and 82μs in Oracle 80-20.
For low-latency workloads, there is currently nothing that comes close to the Intel Optane SSD DC P4800X. While there are areas traditional NVMe products can surpass it in overall bandwidth and IOPS, generally speaking, the P4800X wouldn’t fit those use cases based on its price/capacity metrics. It’s exciting, though, to think about the possibilities for Intel Optane technology once the enterprise drives get to the higher capacity points; especially something in the 2TB class which is still a favorite for array vendors, despite 30TB SAS SSDs being commonly available. In our specific use case around vSAN, the P4800X delivers the fastest possible performance for the write cache layer. For anyone wanting the most out of vSAN, the P4800X is the defacto standard.


 Amazon