

Memblaze has released another NVMe SSD series with the PBlaze5. This marks the company’s second generation of NVMe SSD products after the PBlaze4. The new drive comes in two form factors, U.2 and HHHL AIC, and in two series, the 700 and 900 series. The 700 series runs up in capacity to 11TB and is aimed for data center usage. The 900 series has higher endurance and is aimed for enterprise applications.
Both series are designed for the enterprise and have performance claims of up to 6GB/s sequential speeds with read latency as low as 90μs. Where the two series diverge is that the 700 series has a lower cost, lower endurance, and higher capacity. The 900 series, on the other hand, has higher endurance, dual ports for higher availability, and data encryption. These main differences lend themselves to different use cases: databases, cloud, hyperscale, SDS, Big Data, 3D rendering for the 700 series and mission critical database, ERP, SAP HANNA, BOSS, banking, taxing high frequency trading, and online payment for the 900 series.
For this review we will be looking at the 3.2TB, U.2, 900 series PBlaze5.
Memblaze PBlaze5 NVMe SSD 900 series specifications:
| Form Factor | 2.5″ U.2 | HHHL AIC | ||
| Interface | PCIe 3.0 x4 | PCIe 3.0 x 8 | ||
| Protocol | NVMe 1.2a | |||
| NAND | 3D eTLC NAND | |||
| Capacity | 2TB | 3.2TB | 4TB | 8TB |
| Performance | ||||
| Sequential Read (128KB) | Up to 3.2GB/s | Up to 6GB/s | ||
| Sequential Write (128KB) | Up to 2.4GB/s | |||
| Sustained Random Read (4KB/8KB) | Up to 760K IOPS | Up to 1.042 Million IOPS | ||
| Sustained Random Write (4KB) | Up to 304K IOPS | |||
| Latency R/W | 90/15μs | |||
| Endurance | ||||
| DWPD | 3 | |||
| MTBF | 2.1 Million hours | |||
| Silent Bit Error | < 1 sector error per 10^23 bits read | |||
| Uncorrectable Bit Error Rate | < 1 sector error per 10^17 bits read | |||
| Power Consumption | 7~23W | |||
Design and Build
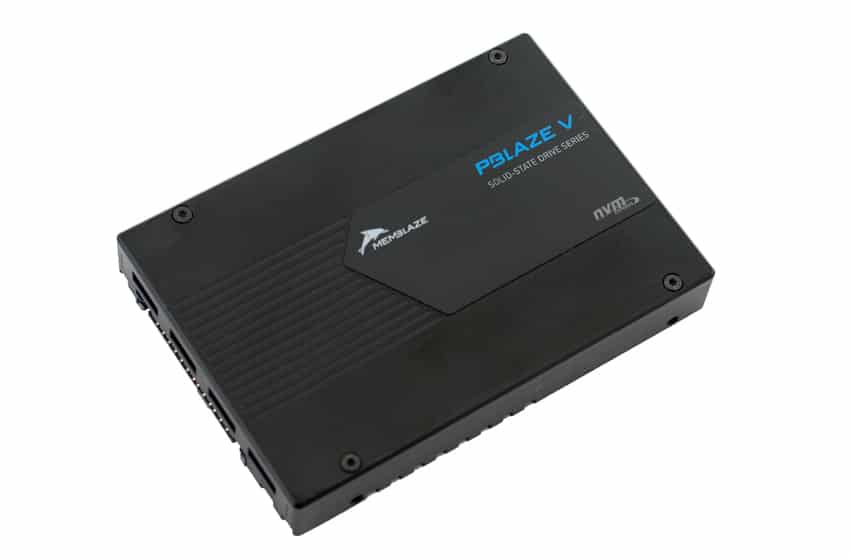
The Memblaze PBlaze5 we are reviewing is a 2.5” U.2 form factor design. The drive has a solid, matt black case. The top of the drive has branding on the right-hand side.
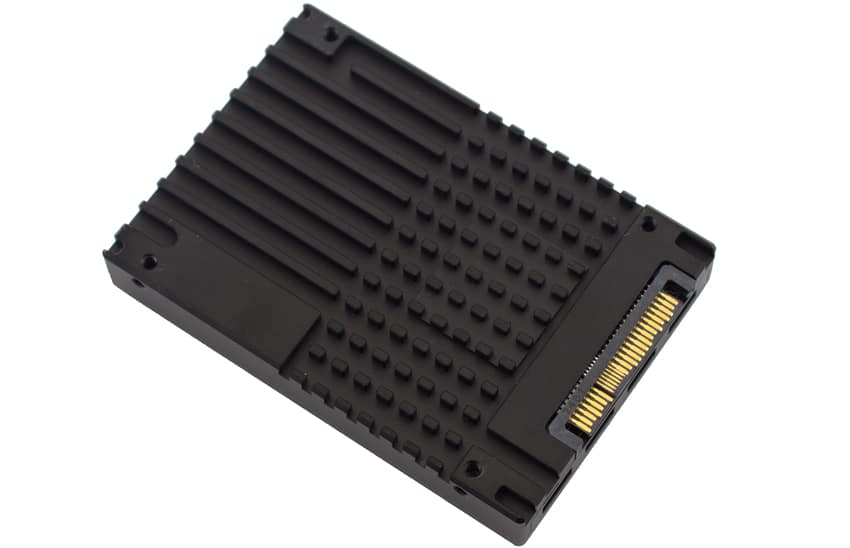
The bottom of the drive is taken up almost entirely by a heat sink.
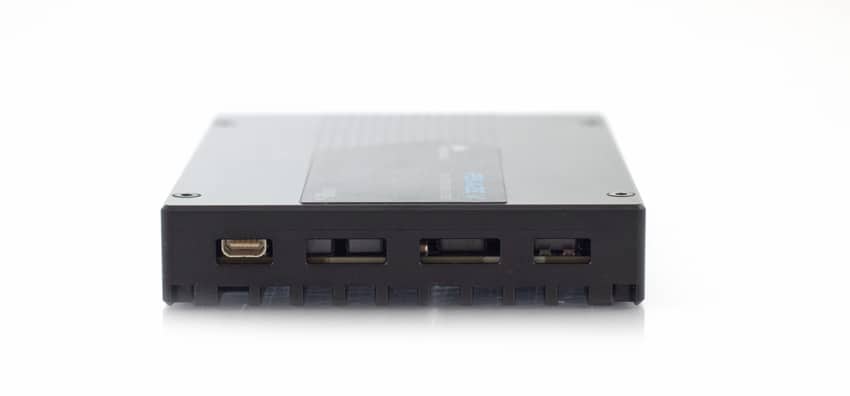
On either end of the drive there are openings to aide in cooling. On the side away from the NVMe interface one can see the second port.
Performance
Testbed
Our Enterprise SSD reviews leverage a Lenovo ThinkSystem SR850 for application tests and a Dell PowerEdge R740xd for synthetic benchmarks. The ThinkSystem SR850 is a well equipped quad-CPU platform, offering CPU power well in excess of what’s needed to stress high-performance local storage. Synthetic tests that don’t require a lot of CPU resources use the more traditional dual-processor server. In both cases, the intent is to showcase local storage in the best light possible that aligns with storage vendor maximum drive specs.
Lenovo ThinkSystem SR850
- 4 x Intel Platinum 8160 CPU (2.1GHz x 24 Cores)
- 16 x 32GB DDR4-2666Mhz ECC DRAM
- 2 x RAID 930-8i 12Gb/s RAID Cards
- 8 NVMe Bays
- VMware ESXI 6.5
Dell PowerEdge R740xd
- 2 x Intel Gold 6130 CPU (2.1GHz x 16 Cores)
- 16 x 16GB DDR4-2666MHz ECC DRAM
- 1x PERC 730 2GB 12Gb/s RAID Card
- Add-in NVMe Adapter
- Ubuntu-16.04.3-desktop-amd64
Testing Background and Comparables
The StorageReview Enterprise Test Lab provides a flexible architecture for conducting benchmarks of enterprise storage devices in an environment comparable to what administrators encounter in real deployments. The Enterprise Test Lab incorporates a variety of servers, networking, power conditioning, and other network infrastructure that allows our staff to establish real-world conditions to accurately gauge performance during our reviews.
We incorporate these details about the lab environment and protocols into reviews so that IT professionals and those responsible for storage acquisition can understand the conditions under which we have achieved the following results. None of our reviews are paid for or overseen by the manufacturer of equipment we are testing. Additional details about the StorageReview Enterprise Test Lab and an overview of its networking capabilities are available on those respective pages.
Comparables for this review:
Application Workload Analysis
In order to understand the performance characteristics of enterprise storage devices, it is essential to model the infrastructure and the application workloads found in live production environments. Our benchmarks for the Memblaze PBlaze5 are therefore the MySQL OLTP performance via SysBench and Microsoft SQL Server OLTP performance with a simulated TCP-C workload. For our application workloads, each drive will be running 2-4 identically configured VMs.
SQL Server Performance
Each SQL Server VM is configured with two vDisks: 100GB volume for boot and a 500GB volume for the database and log files. From a system resource perspective, we configured each VM with 16 vCPUs, 64GB of DRAM and leveraged the LSI Logic SAS SCSI controller. While our Sysbench workloads tested previously saturated the platform in both storage I/O and capacity, the SQL test is looking for latency performance.
This test uses SQL Server 2014 running on Windows Server 2012 R2 guest VMs, and is stressed by Quest’s Benchmark Factory for Databases. StorageReview’s Microsoft SQL Server OLTP testing protocol employs the current draft of the Transaction Processing Performance Council’s Benchmark C (TPC-C), an online transaction-processing benchmark that simulates the activities found in complex application environments. The TPC-C benchmark comes closer than synthetic performance benchmarks to gauging the performance strengths and bottlenecks of storage infrastructure in database environments. Each instance of our SQL Server VM for this review uses a 333GB (1,500 scale) SQL Server database and measures the transactional performance and latency under a load of 15,000 virtual users.
SQL Server Testing Configuration (per VM)
- Windows Server 2012 R2
- Storage Footprint: 600GB allocated, 500GB used
- SQL Server 2014
- Database Size: 1,500 scale
- Virtual Client Load: 15,000
- RAM Buffer: 48GB
- Test Length: 3 hours
- 2.5 hours preconditioning
- 30 minutes sample period
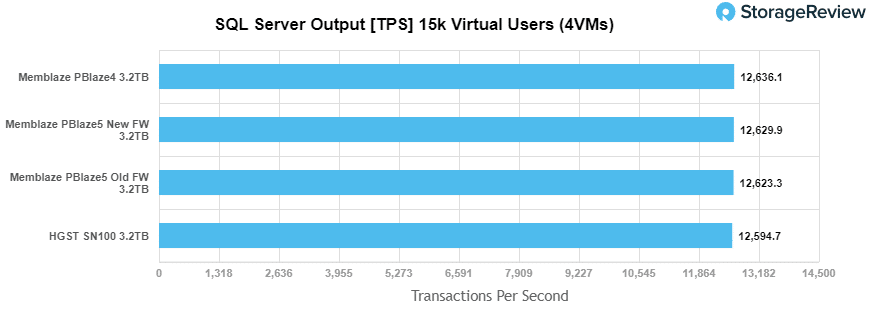
For our SQL Server transactional benchmark, the Memblaze PBlaze5 landed in second behind the PBlaze4 with 12,6239.9 TPS. Though it should be noted that the difference in results from the lowest, HGST SN100, to the highest, Memblaze PBlaze4, was only 41.4 TPS. It should also be noted that the memblaze was ran with the original firmware and then updated firmware throughout our tests and can be seen in the results.
For SQL average latency, the PBlaze5 came in second once more with 7.5ms latency, with the PBlaze4 only having 5ms.

Sysbench Performance
The next application benchmark consists of a Percona MySQL OLTP database measured via SysBench. This test measures average TPS (Transactions Per Second), average latency, and average 99th percentile latency as well.
Each Sysbench VM is configured with three vDisks: one for boot (~92GB), one with the pre-built database (~447GB), and the third for the database under test (270GB). From a system resource perspective, we configured each VM with 16 vCPUs, 60GB of DRAM and leveraged the LSI Logic SAS SCSI controller.
Sysbench Testing Configuration (per VM)
- CentOS 6.3 64-bit
- Percona XtraDB 5.5.30-rel30.1
- Database Tables: 100
- Database Size: 10,000,000
- Database Threads: 32
- RAM Buffer: 24GB
- Test Length: 3 hours
- 2 hours preconditioning 32 threads
- 1 hour 32 threads
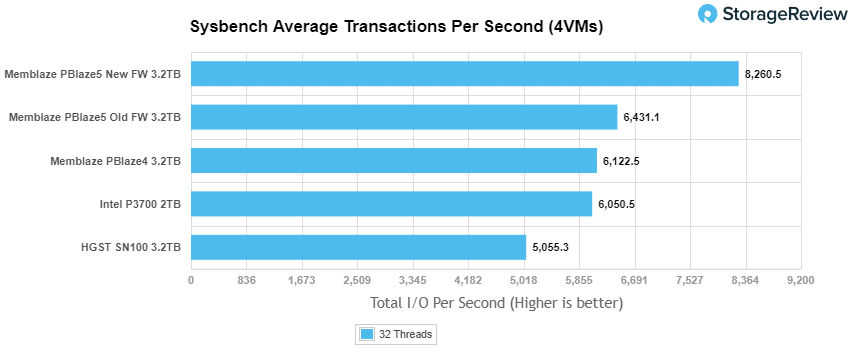
With the Sysbench transactional benchmark, we saw the Memblaze PBlaze5 take the top spot with 8,260.5 TPS.
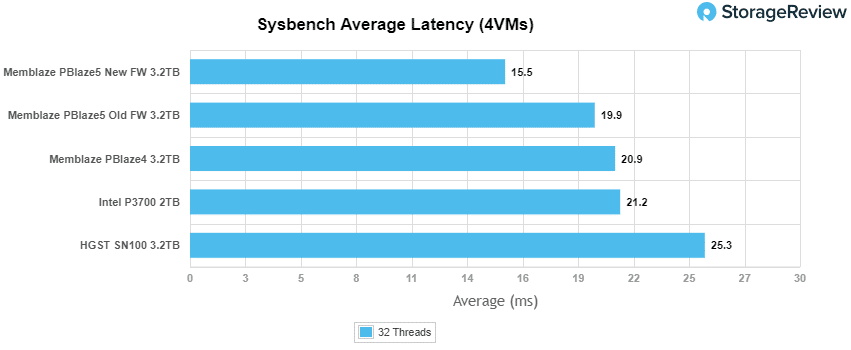
Looking at Sysbench average latency, the PBlaze5 again had the best score with 15.5ms.
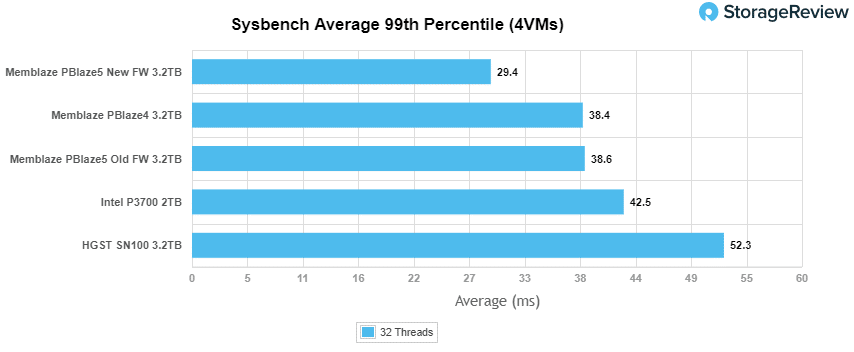
In terms of our worst-case MySQL latency scenario (99th percentile latency), the PBlaze5 took the top spot with 29.4ms.
Houdini by SideFX
The Houdini test is specifically designed to evaluate storage performance as it relates to CGI rendering. The test bed for this application is a variant of the core Dell PowerEdge R740xd server type we use in the lab with dual Intel 6130 CPUs and 64GB DRAM. In this case, we installed Ubuntu Desktop (ubuntu-16.04.3-desktop-amd64) running bare metal. Output of the benchmark is measured in seconds to complete, with fewer being better.
The Maelstrom demo represents a section of the rendering pipeline that highlights the performance capabilities of storage by demonstrating its ability to effectively use the swap file as a form of extended memory. The test does not write out the result data or process the points in order to isolate the wall-time effect of the latency impact to the underlying storage component. The test itself is composed of five phases, three of which we run as part of the benchmark, which are as follows:
- Loads packed points from disk. This is the time to read from disk. This is single threaded, which may limit overall throughput.
- Unpacks the points into a single flat array in order to allow them to be processed. If the points do not have dependency on other points, the working set could be adjusted to stay in-core. This step is multi-threaded.
- (Not Run) Process the points.
- Repacks them into bucketed blocks suitable for storing back to disk. This step is multi-threaded.
- (Not Run) Write the bucketed blocks back out to disk.
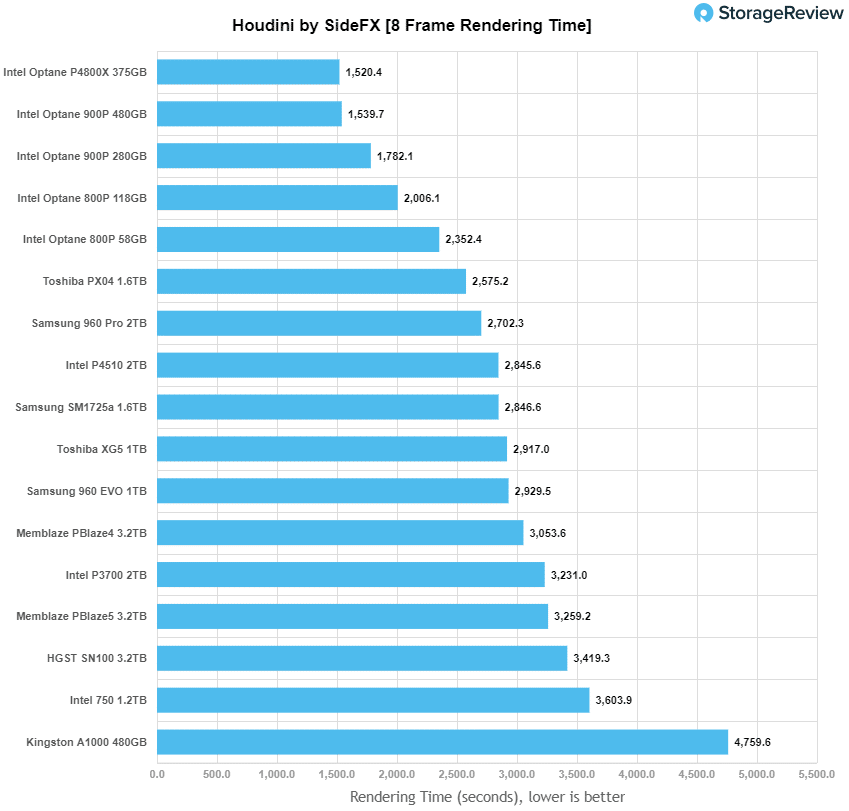
In our Houdini workload, the Memblaze PBlaze5 lagged behind the PBlaze4 and others in the NVMe group, with an 8-frame rendering time of 3,259 seconds.
VDBench Workload Analysis
When it comes to benchmarking storage devices, application testing is best, and synthetic testing comes in second place. While not a perfect representation of actual workloads, synthetic tests do help to baseline storage devices with a repeatability factor that makes it easy to do apples-to-apples comparison between competing solutions. These workloads offer a range of different testing profiles ranging from “four corners” tests, common database transfer size tests, to trace captures from different VDI environments. All of these tests leverage the common vdBench workload generator, with a scripting engine to automate and capture results over a large compute testing cluster. This allows us to repeat the same workloads across a wide range of storage devices, including flash arrays and individual storage devices. Our testing process for these benchmarks fills the entire drive surface with data, then partitions a drive section equal to 25% of the drive capacity to simulate how the drive might respond to application workloads. This is different than full entropy tests which use 100% of the drive and take them into steady state. As a result these figures will reflect higher sustained write speeds.
Profiles:
- 4K Random Read: 100% Read, 128 threads, 0-120% iorate
- 4K Random Write: 100% Write, 64 threads, 0-120% iorate
- 64K Sequential Read: 100% Read, 16 threads, 0-120% iorate
- 64K Sequential Write: 100% Write, 8 threads, 0-120% iorate
- Synthetic Database: SQL and Oracle
- VDI Full Clone and Linked Clone Traces
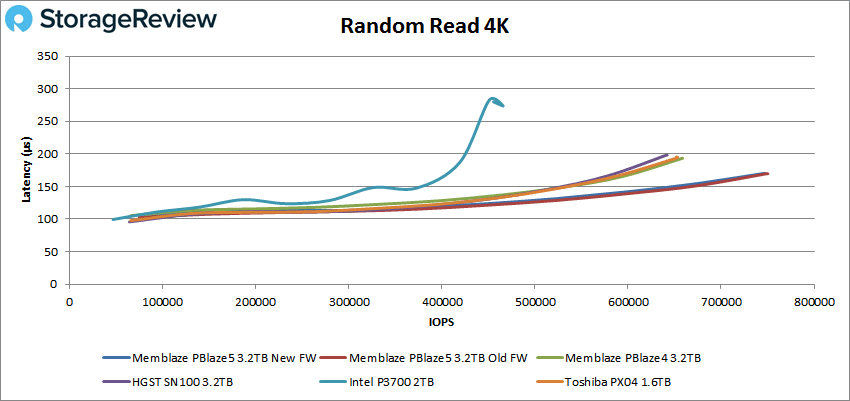
In our first VDBench Workload Analysis, we looked at random 4K read performance. All drives tested had sub-millisecond latency throughout the benchmark. The Memblaze PBlaze5 peaked at 748,510 IOPS with a latency of 170μs, making it the top performer by far.
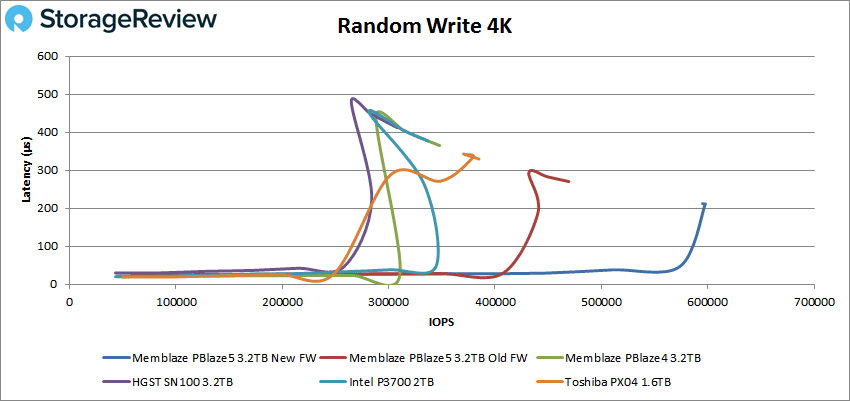
Next we looked at 4K write performance, and here the PBlaze5 peaked at 597,647 IOPS and 211μs latency, again the top performance by a wide margin.
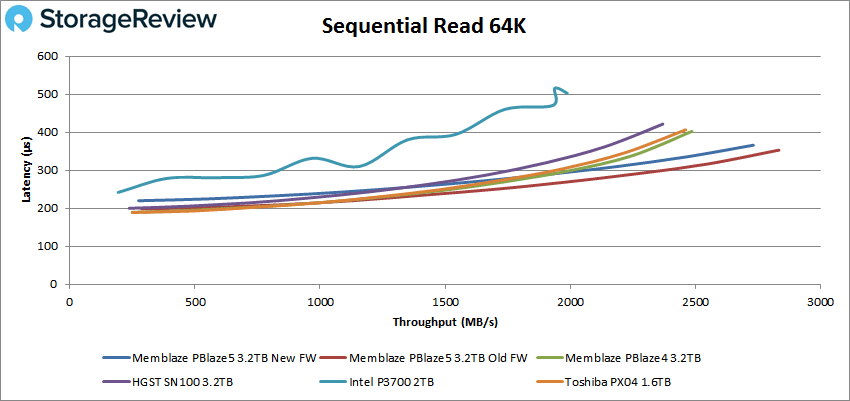
Moving to sequential performance, we looked at our 64K benchmarks. With 64K sequential read, the PBlaze5 peaked at 43,653 IOPS or 2.72GB/s with a latency of 366μs, again taking the top spot.
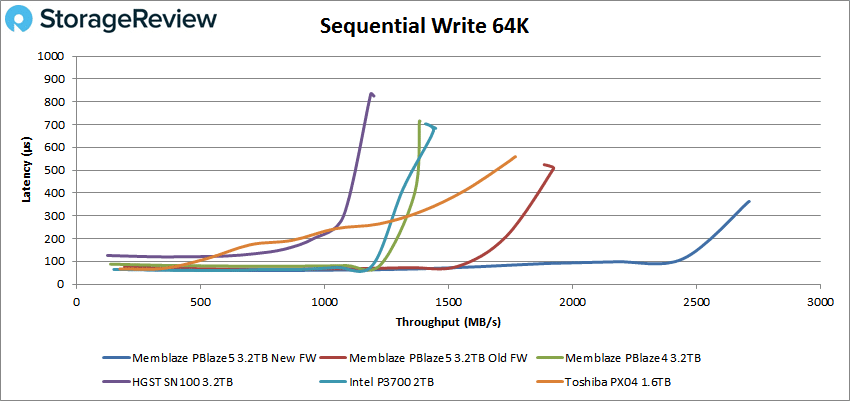
For 64K sequential write, the PBlaze5 led the pack, peaking at 43,352 IOPS or 2.71GB/s with a latency of 363μs.
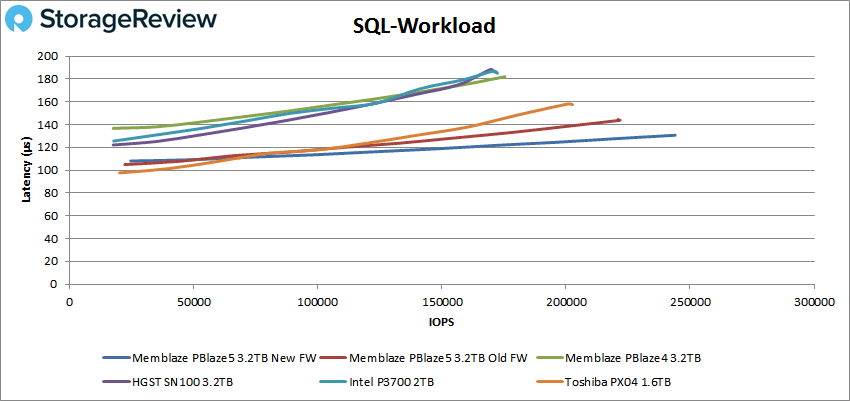
Next we looked at our SQL workloads where again no drive went over 1ms latency. The Memblaze PBlaze5 peaked at 243,899 IOPS with a latency of 131μs.
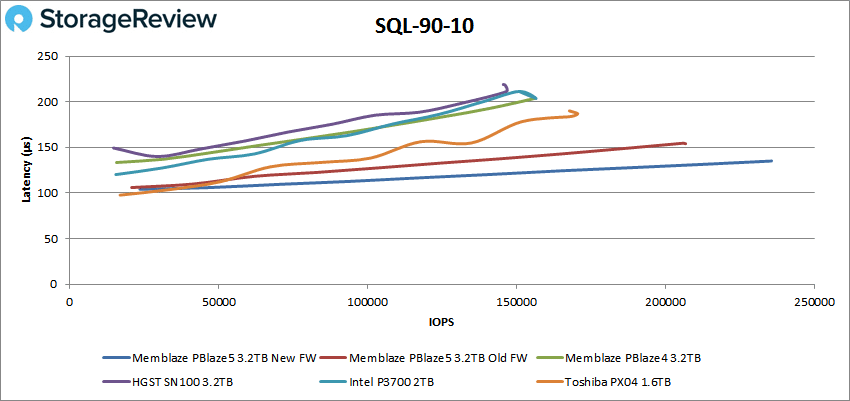
In our SQL 90-10, the PBlaze5 continued to dominate with a peak score of 235,428 IOPS and a latency of 135μs.
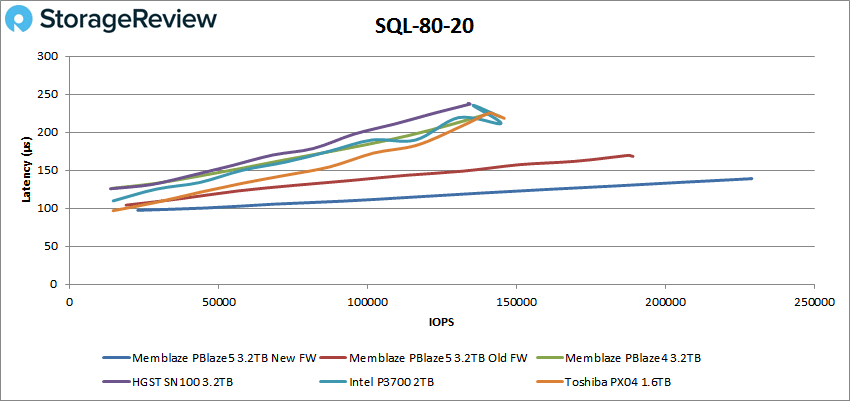
The SQL 80-20 showed the PBlaze5 in the lead by the widest margin so far with a peak score of 229,029 IOPS with a latency of 139μs.
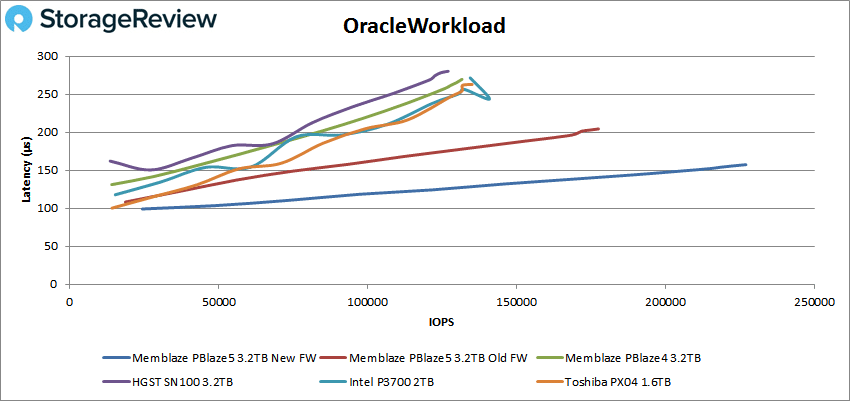
The Oracle workloads again showed all drives with sub-millisecond performance. In the Oracle workload, the PBlaze5 peaked at 277,100 IOPS with a latency of 157μs.
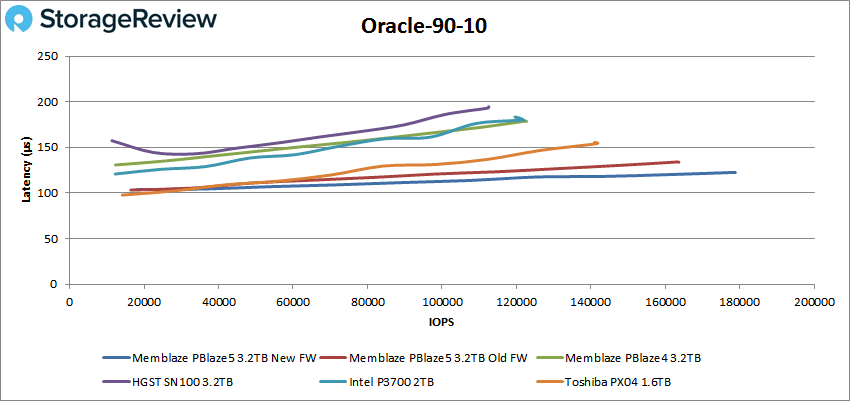
With Oracle 90-10, the PBlaze5 took the top spot with 178,747 IOPS and a latency of 123μs.
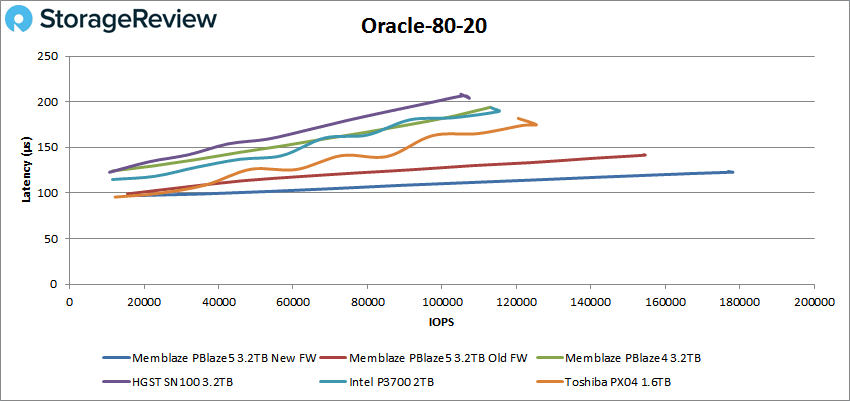
Our last Oracle benchmark, 80-20, showed the PBlaze5 with the best peak score of 177,851 IOPS and a latency of 123μs.
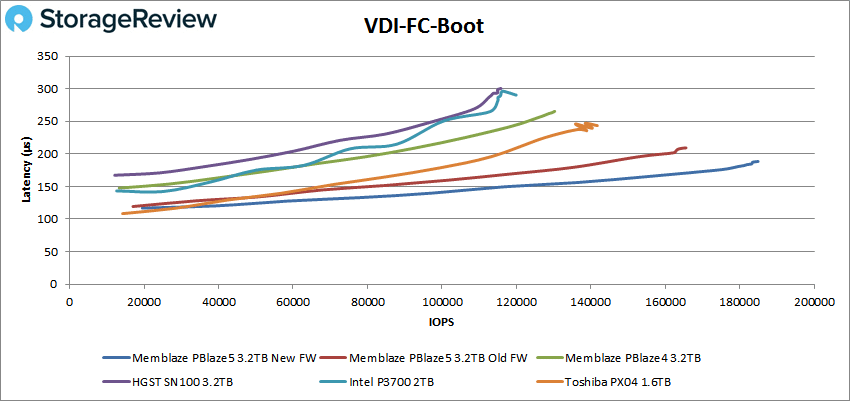
Next we switched over to our VDI clone test, Full and Linked. For VDI Full Clone Boot, the PBlaze5 once again took the top spot with a peak of 184,936 IOPS with a latency of 189μs.
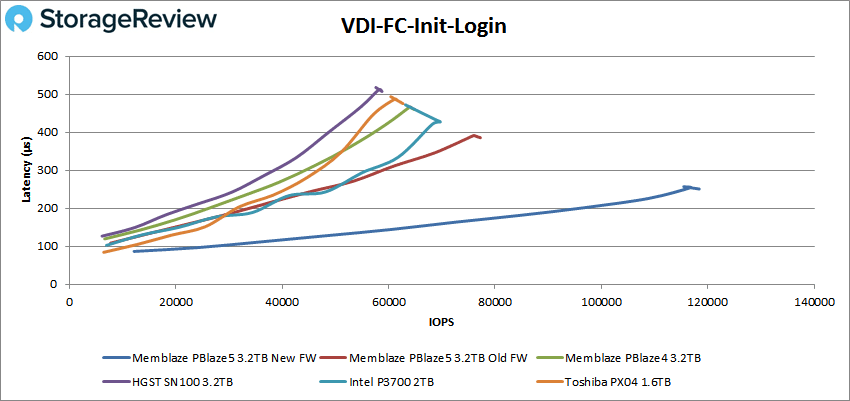
For VDI FC Initial Login, the PBlaze5 led the other drives with a peak of 118,389 IOPS and a latency of 251μs.
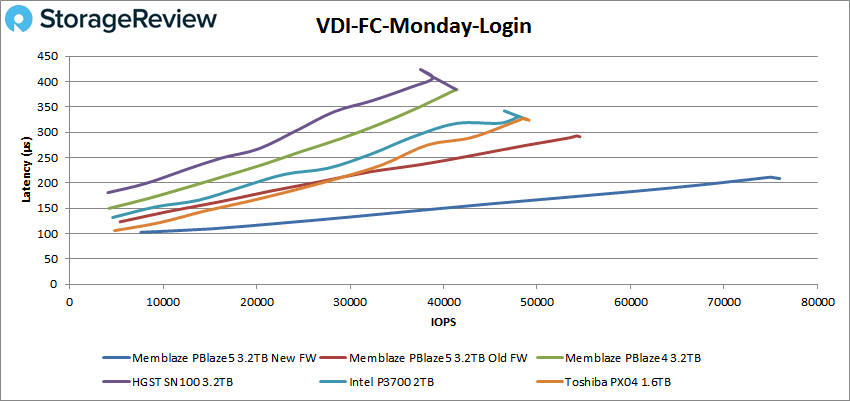
With VDI FC Monday Login, the PBlaze5 had a peak performance of 75,691 IOPS and a latency of 209μs.
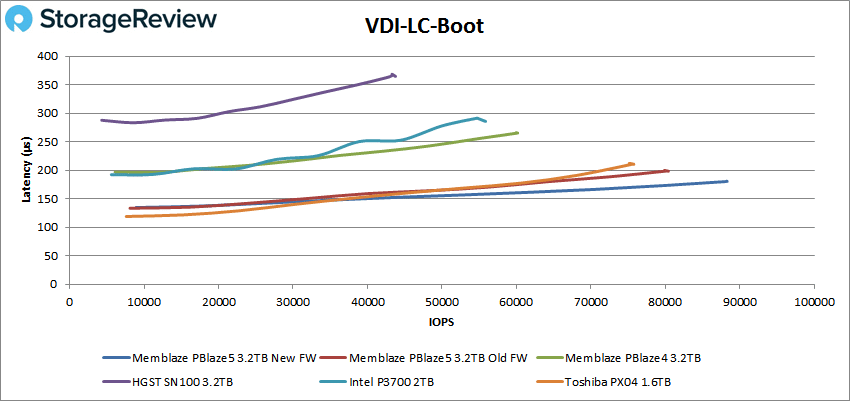
On the VDI LC Boot test, we saw that the Toshiba PX04 ran much closer to the PBlaze5 than any other drive had to up to this point. The PBlaze5 still came out on top with a peak score of 88,179 IOPS and a latency of 180μs.
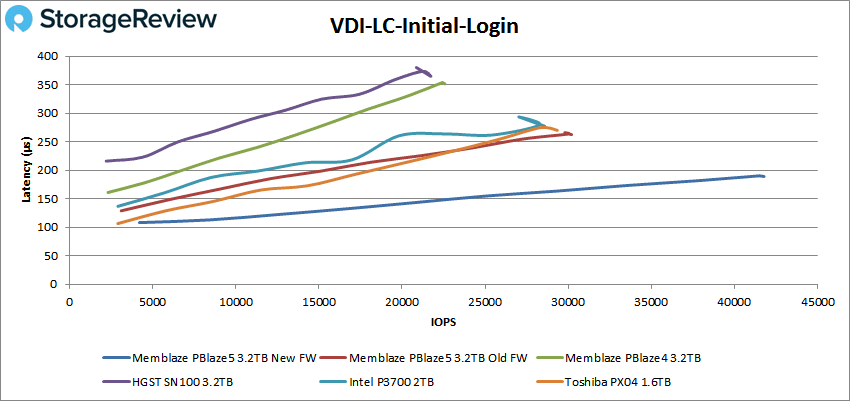
The VDI LC Initial Login again saw the PBlaze5 break away with a peak score of 41,657 IOPS and 189μs latency.
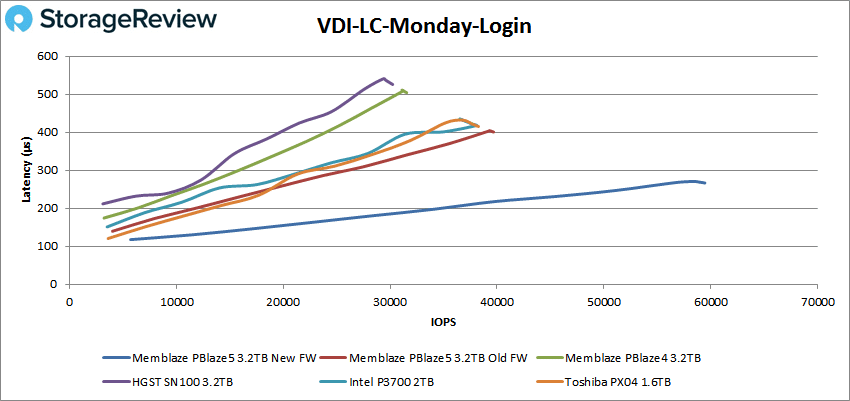
Our final test, the VDI LC Monday Login, had the PBlaze5 peaking at 59,449 IOPS and 267μs latency.
Conclusion
The Memblaze PBlaze5 NVMe SSD is the company’s second-generation NVMe enterprise drive. The drive comes with a maximum capacity of 11TB (for the 700 series) and quotes speeds of 6GB/s, over 1 million IOPS, and latency as low as 15μs. The drive comes in two form factors: a hot-swappable 2.5” U.2 and a HHHL AIC. The drive is also offered with two series: the lower endurance, lower cost, higher capacity 700 series and the higher endurance, higher availability, and encrypted 900 series. For our review we measured the performance of the 900 series.
Looking at performance, in our application workload analysis, the Memblze PBlaze5 put up good numbers in SQL Server, with 12,629.9 TPS and an average latency of 7.5ms; however, the PBlaze4 was able to beat it by 2.5ms. In Sysbench, the PBlaze5 had the top score in the transactional test, 8,260.5 TPS, and average latency, 15.5ms, and worst-case scenario, 29.4ms. In our Houdini workload, the PBlaze5 fell behind the prior generation drive and other NVMe enterprise SSDs.
In our VDbench test, the PBlaze5 dominated every test, and at times by a wide margin. In our 4K tests, the PBlaze5 was able to hit nearly 750K IOPS with a 170μs latency for read and over 597K IOPS with 211μs latency. For 64K sequential, the drive hit 2.71GB/s with a latency of 363μs in write and 2.73GB/s with a latency of 365μs in read. The PBlaze5 continued to impress moving into SQL tests with peak scores of roughly 244K IOPS, 235K IOPS for 90-10, and 229K IOPS for 80-20. Oracle showed the drive with scores of roughly 227K IOPS, 178K IOPS for 90-10, and 178K IOPS for 80-20. And during our VDI Clone tests, the PBlaze5 led the way, though some of the other drives gave it a run for its money in one of the Linked Clone tests.
The Bottom Line
The Memblaze PBlaze5 NVMe SSD offers a nice progressive update over the prior-gen, while setting a capacity mark of 11TB, which is very high for NVMe interface SSDs.


 Amazon