

The Kingston SSDNow E100 represents Kingston’s first SSD offering designed specifically for the burgeoning entry enterprise market that relies on enterprise MLC NAND to offer a lower-cost enterprise drive designed for largely read intensive workloads. Don’t let the lower-cost target fool you though, the E100 is very much enterprise-grade throughout. Kingston uses a SandForce SF-2500 enterprise SSD controller to power the drive and Toshiba’s eMLC Toggle NAND. The E100 also features power-fail support to ensure data in-flight makes it to the NAND safely and roughly 20% NAND over provisioning which benefits both SSD endurance and performance.
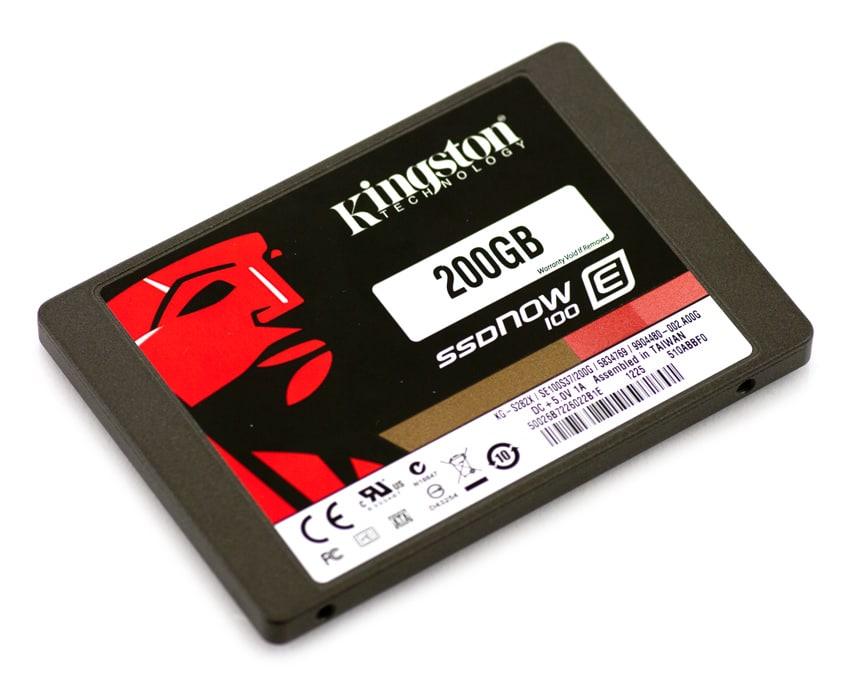
The E100 uses a standard 2.5″ body with SATA interface, though it comes in at only 7mm, making it ideal for not only servers with SFF bays, but also applications like telco equipment and other devices where the drives need to fit within a confined space. Kingston offers the drives in three capacities, 100GB, 200GB and 400GB, each offering burst speeds of up to 535MB/s sequential read and 500MB/s sequential write. More important though are sustained speeds, which Kingston quotes at 59,000 IOPS random 4k read and 72,000 IOPS random 4k write for our 200GB review model.
Kingston is one of the few who not only discloses supported drive endurance, but also shares that data point within the SMART output. As these SSDs are going to be used largely in read environments, the endurance may be a lesser concern, but even so, we’re happy to see Kingston disclose it. The 100GB, 200GB and 400GB support a total bytes written (TBW) of 428TB, 857TB and 1714TB respectively. Kingston provides a three year warranty of the E100, which generally speaking is light for the enterprise, where five year warranties are the norm, even in the entry enterprise SSD space.
Kingston SSDNow E100 Specifications
- Capacities
- 100GB – SE100S37/100G
- Sequential Reads – 535MB/s
- Sequential Writes – 500MB/s
- Sustained Random 4k Read/Write – 47,000/81,000 IOPS
- Power – 0.5W (TYP) Idle / 1.2W (TYP) Read / 2.7W (TYP) Write
- Total Bytes Written (TBW) – 428TB
- 200GB – SE100S37/200G
- Sequential Reads – 535MB/s
- Sequential Writes – 500MB/s
- Sustained Random 4k Read/Write – 59,000/72,000 IOPS
- Power – 0.5W (TYP) Idle / 1.2W (TYP) Read / 3.1W (TYP) Write
- Total Bytes Written (TBW) – 857TB
- 400GB – SE100S37/400G
- Sequential Reads – 535MB/s
- Sequential Writes – 500MB/s
- Sustained Random 4k Read/Write – 52,000/37,000 IOPS
- Power – 0.5W (TYP) Idle / 1.2W (TYP) Read / 5.0W (TYP) Write
- Total Bytes Written (TBW) – 1714TB
- 100GB – SE100S37/100G
- SandForce SF-2500 Controller
- Toshiba eMLC NAND (30,000 P/E cycles)
- Enterprise SMART Tools: Reliability Tracking, Usage Statistics, Life Remaining, Wear Leveling, Temperature, Drive Life Protection
- Form factor: 2.5″, 7mm
- Interface: SATA Rev. 3.0 (6Gb/s)
- Three year warranty and technical support
- Dimensions: 69.85mm x 100mm x 7mm
- Storage temperature: -40 ~ 85°C
- Operating temperature: 0 ~ 70°C
- TRIM: Not supported
- MTBF: 10,000,000 Hrs
Video Overview
Design and Dissassembly
The Kingston SSDNow E100 comes in a 7mm-tall form factor, which gives it excellent compatibility with workstations and enterprise severs designed for SFF drives. The thin case also gives it a leg up in applications where ultra-dense SSD storage is required, such as the EchoStreams 48-bay flash array.

From the front the Kingston SSDNow E100 includes a standard SATA port, although on a warning sticker you must pull off to connect it, Kingston tells you to only connect it to HBAs and RAID cards, not standard onboard SATA connections.

Inside the E100, we find thermal pads which are common-place on most every Kingston SSD. These are designed to draw heat away from active components such as the NAND and SandForce controller. Kingston includes these in almost all consumer SSDs as well, which is not common in the industry.
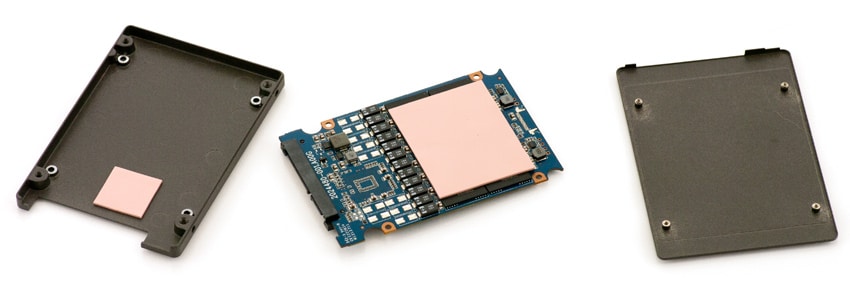
To protect in-flight data, Kingston includes capacitors which are used to flush data to NAND in the event of a power failure. These are found on most enterprise drives that use some form of write-caching.

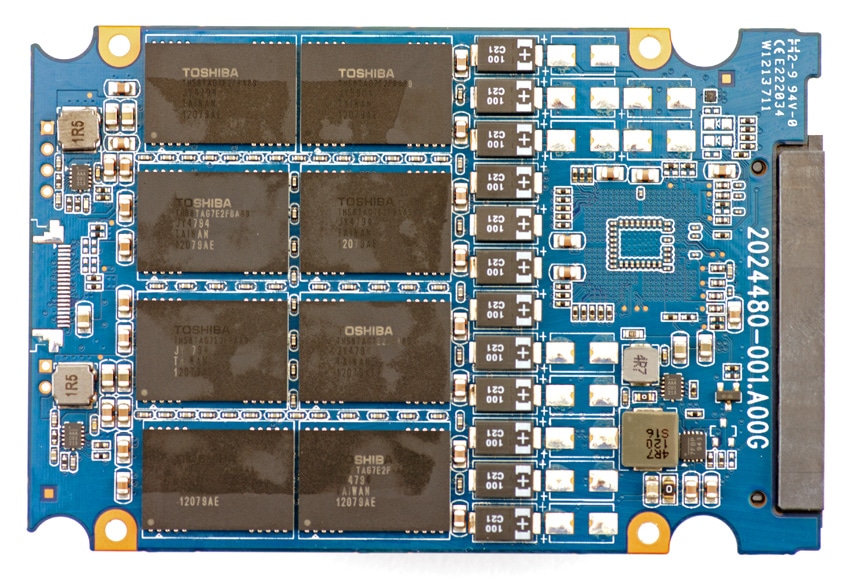
Inside the Kingston SSDNow E100 Enterprise SSD we find Toshiba eMLC Toggle NAND, as well as a SandForce SF-2500 controller. The NAND configuration on the circuit board is setup where eight 16GB pieces are soldered to the top, and an additional 16 GB pieces are soldered to the bottom.
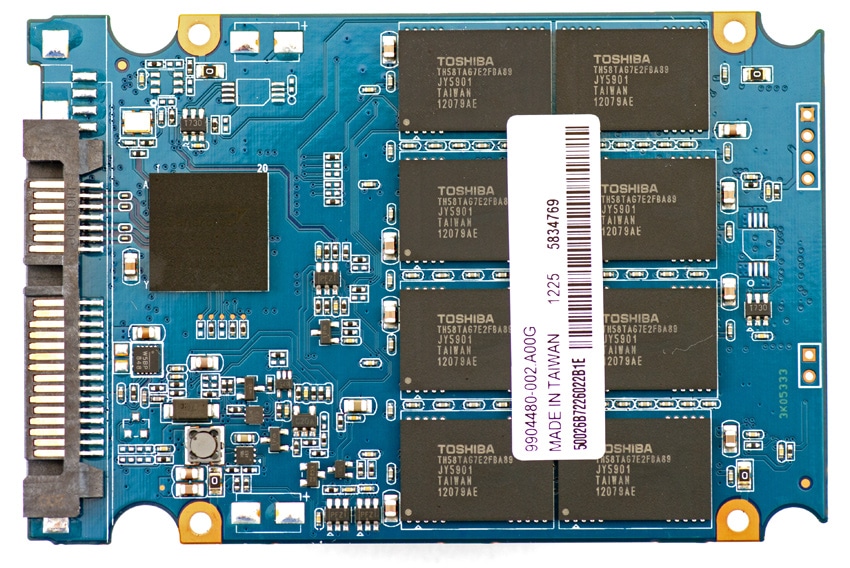
The bottom includes 128GB of RAW NAND, as well as the capacitors required to support the power-fail features on the E100 SSD.
Testing Background and Comparables
Our Kingston 200GB SSDNow E100 SSD uses a SandForce SF-2500 controller and Toshiba 24nm eMLC NAND with a SATA 3.0 interface. Manufacturers continue to bring eMLC devices to market, and with a wide selection of comparables in our lab we are able benchmark drives like the SSDNow E100 against similarly-specified SSDs.
Comparables for this review:
- Intel SSD 710 (200GB, Intel PC29AS21BA0 controller, Intel 25nm eMLC NAND, 3.0Gb/s SATA)
- Samsung SM825 (200GB, Samsung S3C29MAX01-Y330 controller, Samsung 30nm eMLC NAND, 3.0Gb/s SATA)
- Hitachi SSD400M (400GB, Intel EW29AA31AA1 controller, Intel 25nm eMLC NAND, 6.0Gb/s SAS)
- PureSi Kage S1 (200GB, SandForce SF-2500 controller, Toshiba 24nm eMLC NAND, 6.0Gb/s SATA)
All enterprise SSDs are benchmarked on our enterprise testing platform based on a Lenovo ThinkServer RD240. The ThinkServer RD240 is configured with:
- 2 x Intel Xeon X5650 (2.66GHz, 12MB Cache)
- Windows Server 2008 Standard Edition R2 SP1 64-Bit and CentOS 6.2 64-Bit
- Intel 5500+ ICH10R Chipset
- Memory – 8GB (2 x 4GB) 1333Mhz DDR3 Registered RDIMMs
- LSI 9211 SAS/SATA 6.0Gb/s HBA
Enterprise Synthetic Workload Analysis
Flash performance varies throughout the preconditioning phase of each storage device. Our enterprise storage benchmark process begins with an analysis of the way the drive performs during a thorough preconditioning phase. Each of the comparable drives are secure erased using the vendor’s tools, preconditioned into steady-state with the same workload the device will be tested with under a heavy load of 16 threads with an outstanding queue of 16 per thread, and then tested in set intervals in multiple thread/queue depth profiles to show performance under light and heavy usage.
Preconditioning and Primary Steady-State Tests:
- Throughput (Read+Write IOPS Aggregate)
- Average Latency (Read+Write Latency Averaged Together)
- Max Latency (Peak Read or Write Latency)
- Latency Standard Deviation (Read+Write Standard Deviation Averaged Together)
Our Enterprise Synthetic Workload Analysis includes four profiles based on real-world tasks. These profiles have been developed to make it easier to compare to our past benchmarks as well as widely-published values such as max 4K read and write speed and 8K 70/30, which is commonly used for enterprise drives. We also included two legacy mixed workloads, the traditional File Server and Webserver, each offering a wide mix of transfer sizes.
- 4K
- 100% Read or 100% Write
- 100% 4K
- 8K 70/30
- 70% Read, 30% Write
- 100% 8K
- File Server
- 80% Read, 20% Write
- 10% 512b, 5% 1k, 5% 2k, 60% 4k, 2% 8k, 4% 16k, 4% 32k, 10% 64k
- Webserver
- 100% Read
- 22% 512b, 15% 1k, 8% 2k, 23% 4k, 15% 8k, 2% 16k, 6% 32k, 7% 64k, 1% 128k, 1% 512k
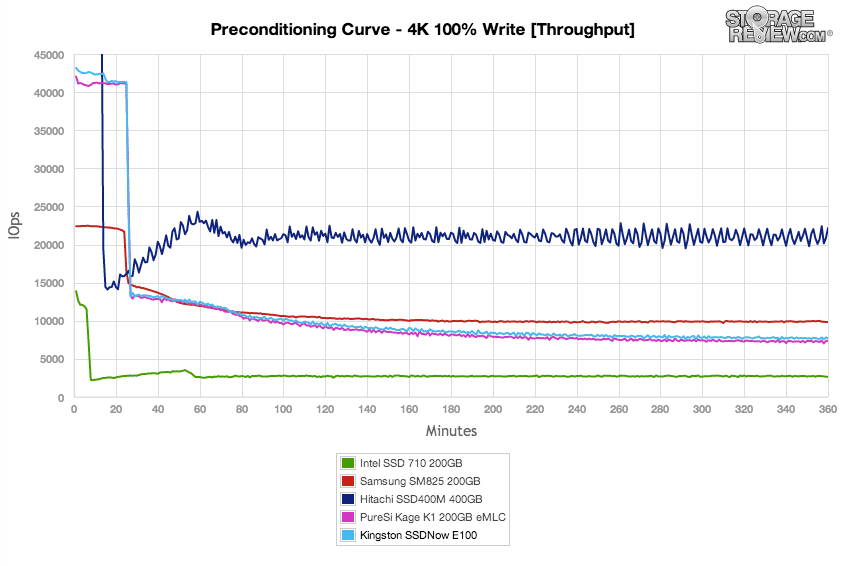
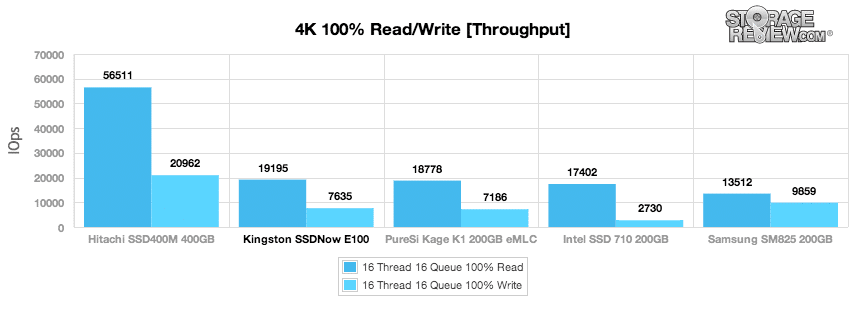
In our first test looking at a complete saturation of 4K random write activity, the Kingston SSDNow E100 comes in at the middle of the pack, edging out slightly faster than the similar-spec PureSi Kage K1.
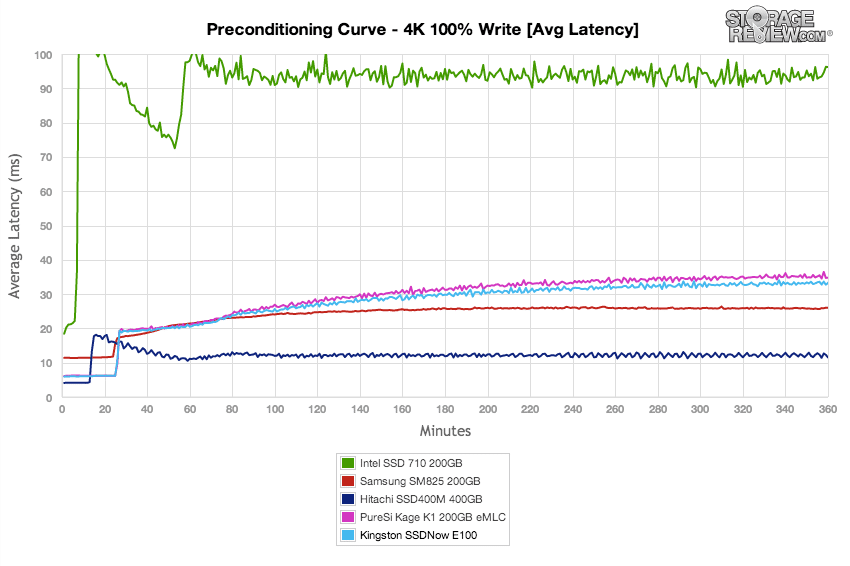
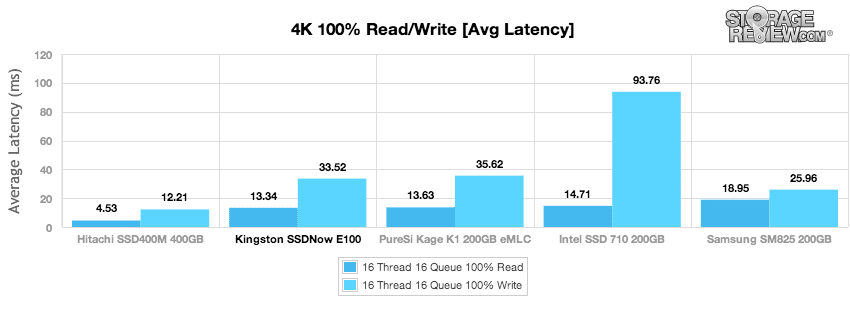
Switching to a view in latency, the eMLC-based Kingston E100 sits slightly faster in response times compared to the PureSi.
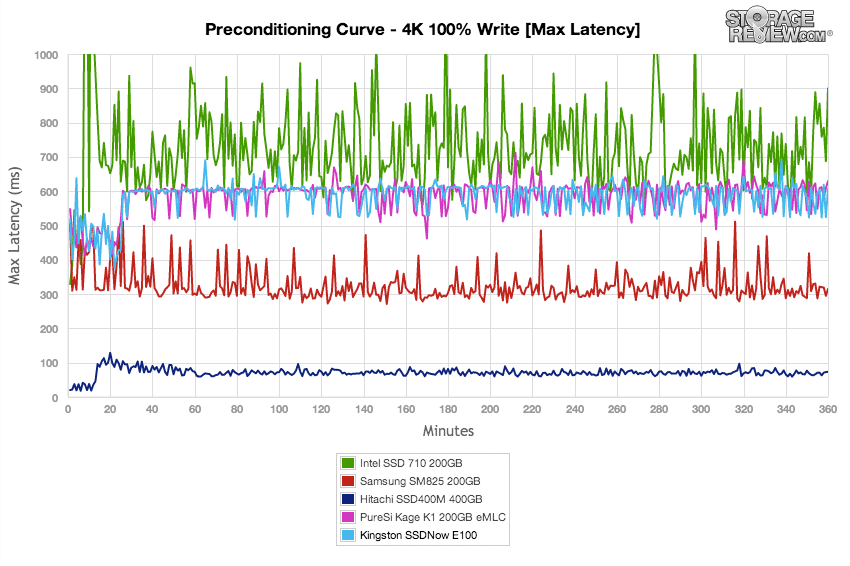
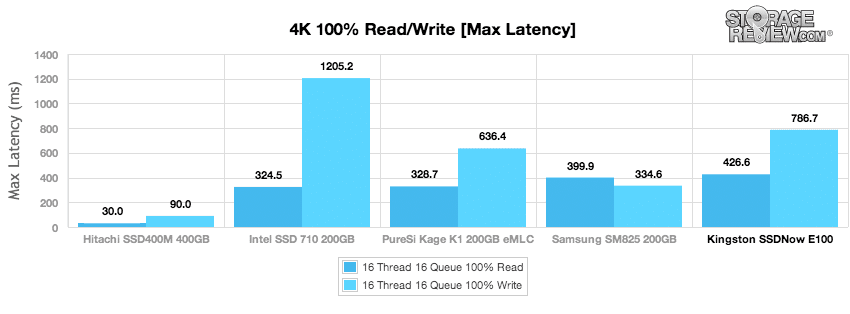
Given both the Kingston SSDNow E100 and PureSI KAge K1 SSDs are SandForce SF-2500 and eMLC-based, it was no surprise to see both of them offering a mirror image in our max latency 4K test.
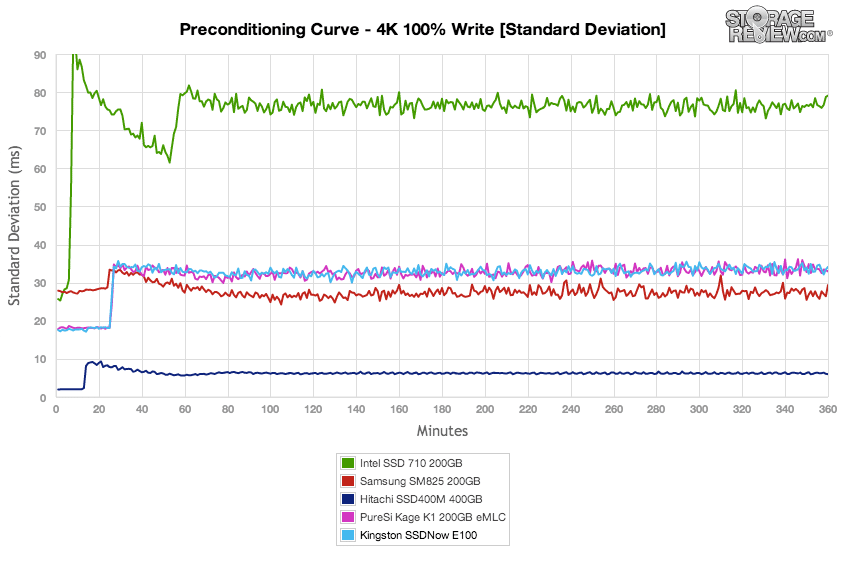
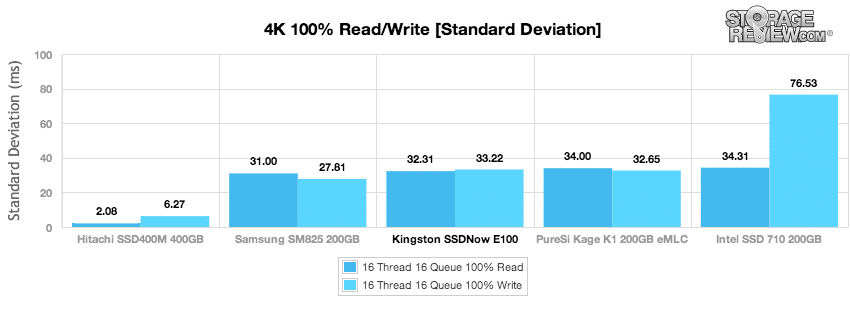
Standard deviation on both of the Kingston E100 and Kage K1 are near identical, coming in below the Samsung SM825 and Hitachi SSD400M, but above the Intel SSD 710.
After our preconditioning process, our final average speed of the Kingston SSDNow E100 yielded a result of 19,195 IOPS 4K read and 7,635 IOPS 4K write.
Average latency during our full saturation test measured 13.34ms read and 33.52ms write.
Max latency on the Kingston E100 measured the highest in the group for read activity with 426.6ms, although 2nd to highest in write latency with 786.7ms.
While max latency shows the absolute worst response times over the duration of the testing period, looking instead at standard deviation paints a better picture for how consistent the response times were from the Kingston E100. Overall the E100 came in middle of the pack, right up against the Kage K1.
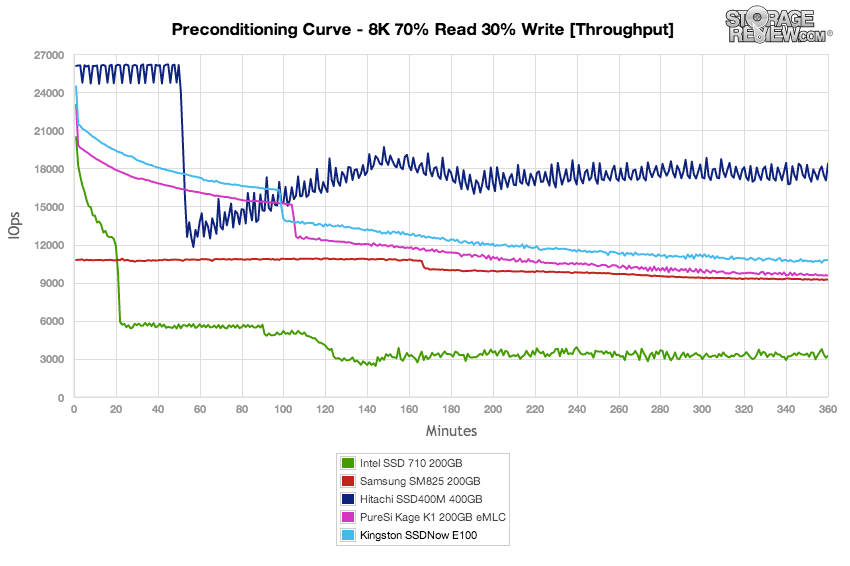
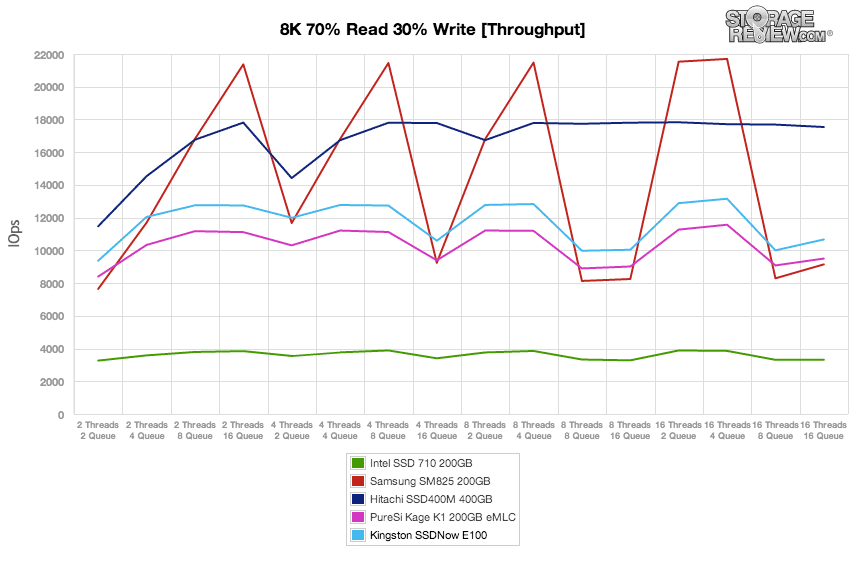
Our next test shifts from a 4K random write workload to an 8K 70/30 Read/Write mix. As we look at total throughput in an over-saturation preconditioning test, the Kingston E100 came out on top of the Kage K1, Samsung SM825, as well as the Intel SSD 710. It only came up behind the Hitachi SSD400M.
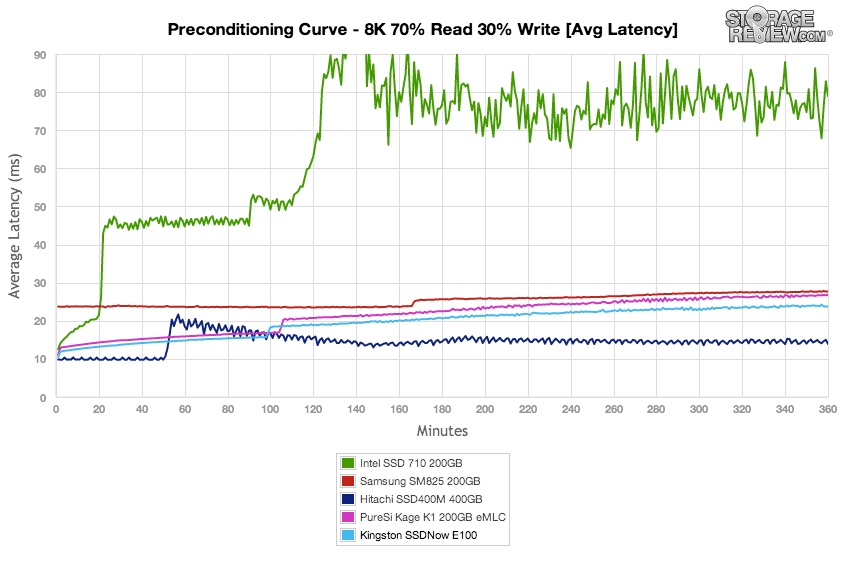
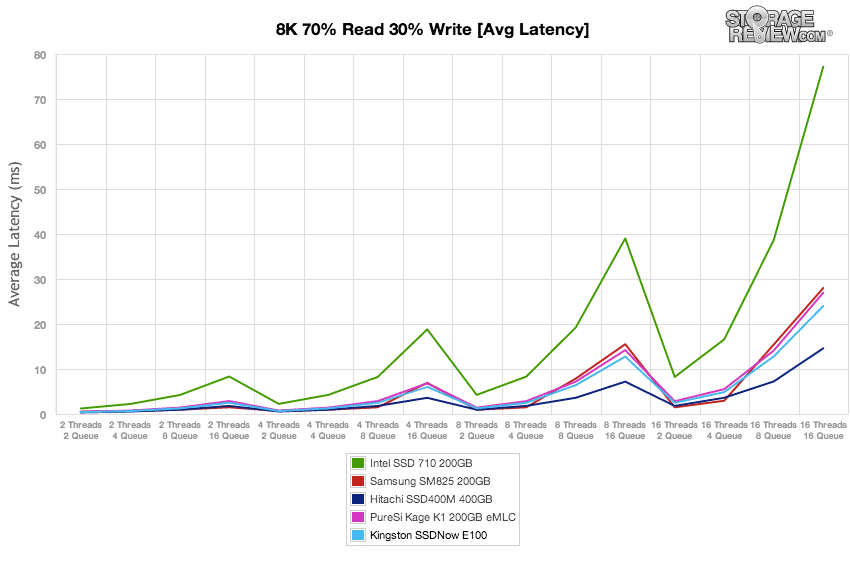
The Kingston performed well in average latency on our 8K 70/30 test, coming in faster than the Kage K1, SM825, and SSD 710.
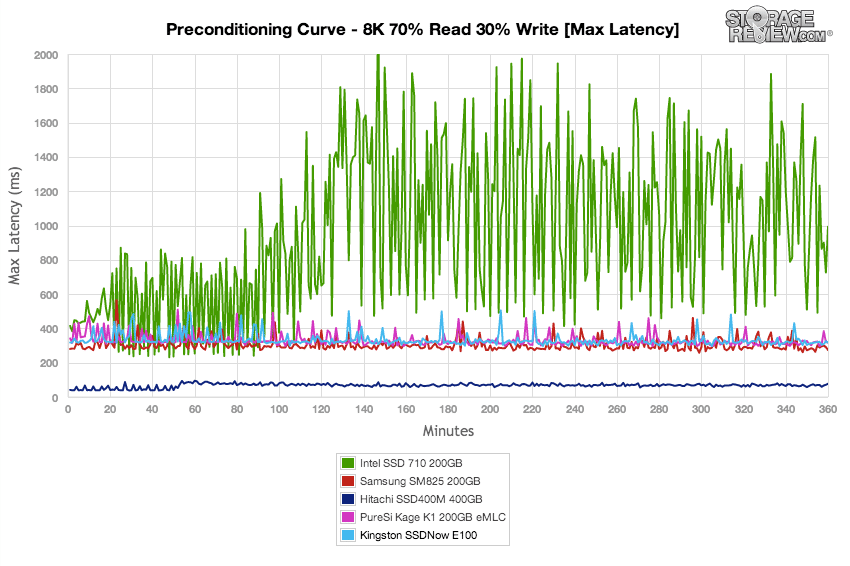
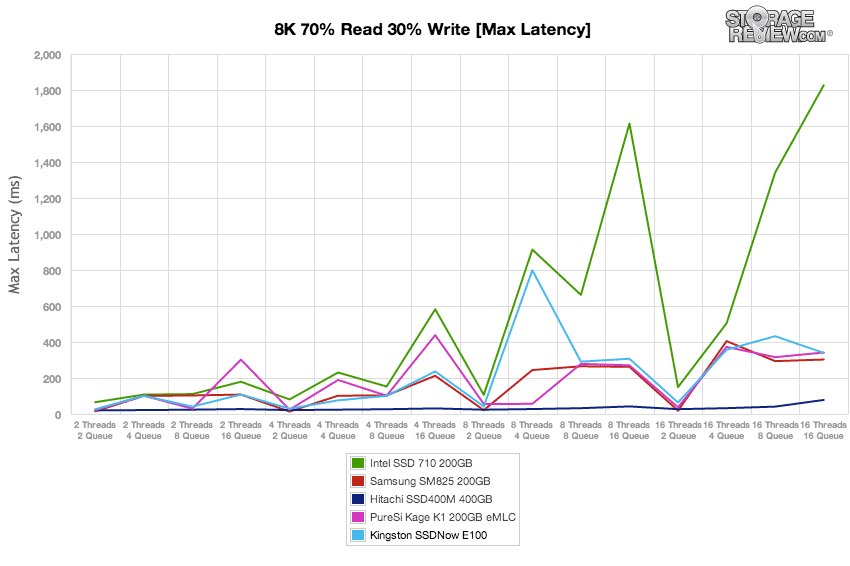
Comparing max latency in our 8K 70/30 preconditioning workload, the two SandForce and Samsung eMLC SSDs had a similar spread in peak latency, ranging between 300-500ms.
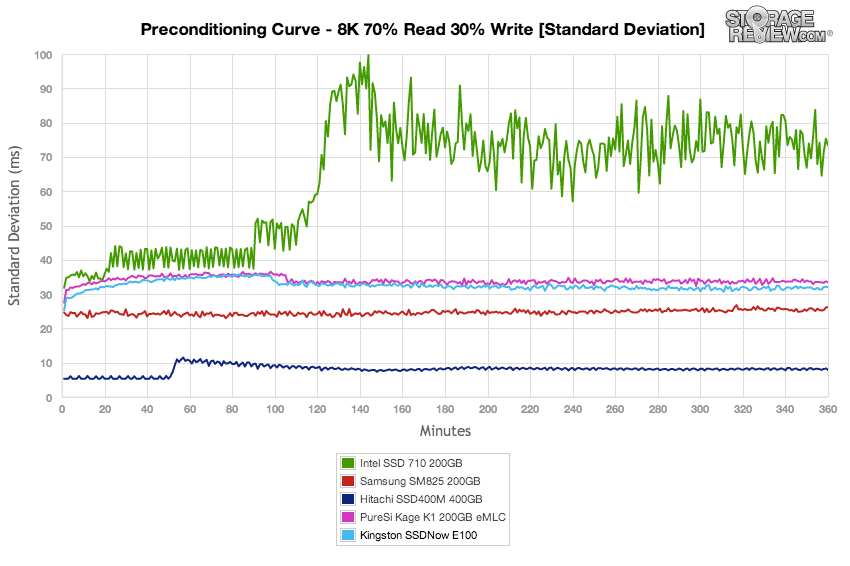
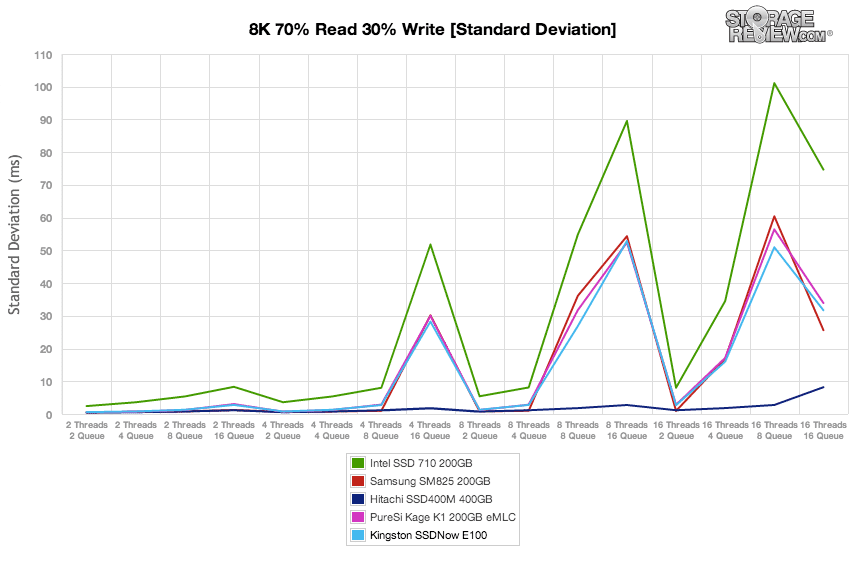
Looking at the standard deviation of each of the eMLC SSDs, the Hitachi and SM825 came out on top with the most consistent spread of latency, followed by the E100 and Kage K1 and then the SSD 710.
After finishing our preconditioning process with our 8K 70/30 workload, we progress right into a varying workload test, where we take samples with loads varying from 2T/2Q to 16T/16Q. In this area the Kingston offered a boost in performance compared to the Kage K1 SSD, following an identical performance curve. The two SandForce eMLC models came in at the middle of the pack, below the SM825 and SSD400M, but well above the Intel SSD 710.
The E100 was able to keep average latency suppressed at load levels lower than an effective queue depth of 32, where the queue depth limit of the SATA interface came in. This affected all drives except the SAS-based Hitachi SSD400M.
Throughout most of our individual tests the E100 kept peak response times under 300ms, except for one higher blip to 800ms at 8T/4Q.
Standard deviation on the E100 was consistent on all effective queue depths below 32, although it was still able to keep latency in check compared to the Intel SSD 710.
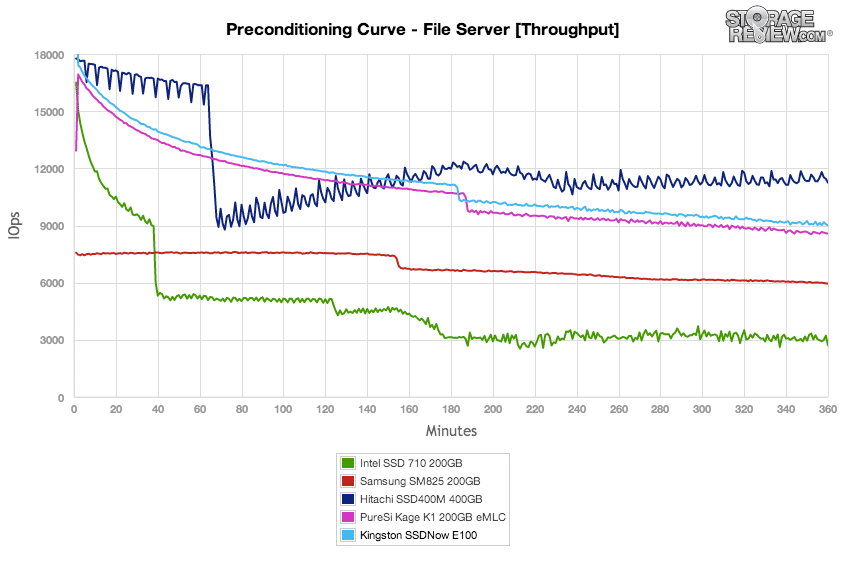
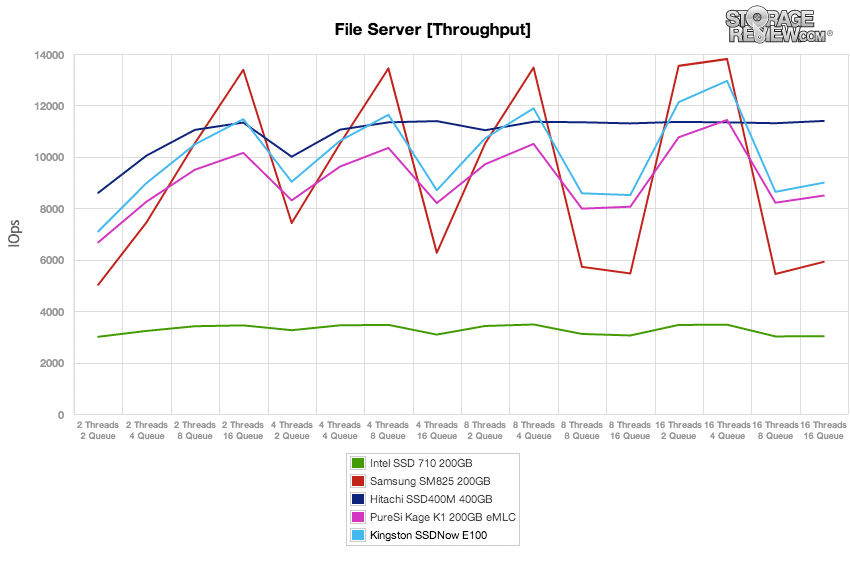
Our next workload covers a File Server profile, which the Kingston E100 comes in second place, below the Hitachi SSD400M. It offers a slight lead over the KAge K1 throughout the entire preconditioning phase.
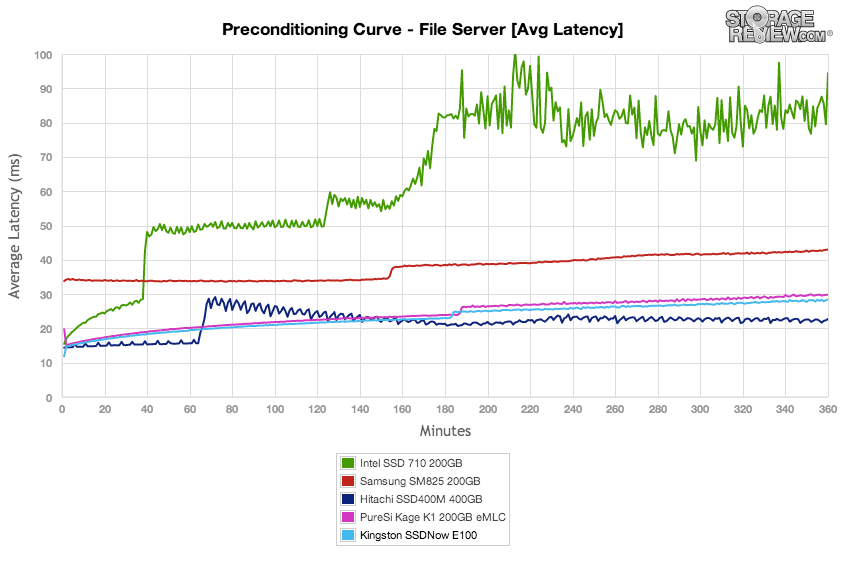
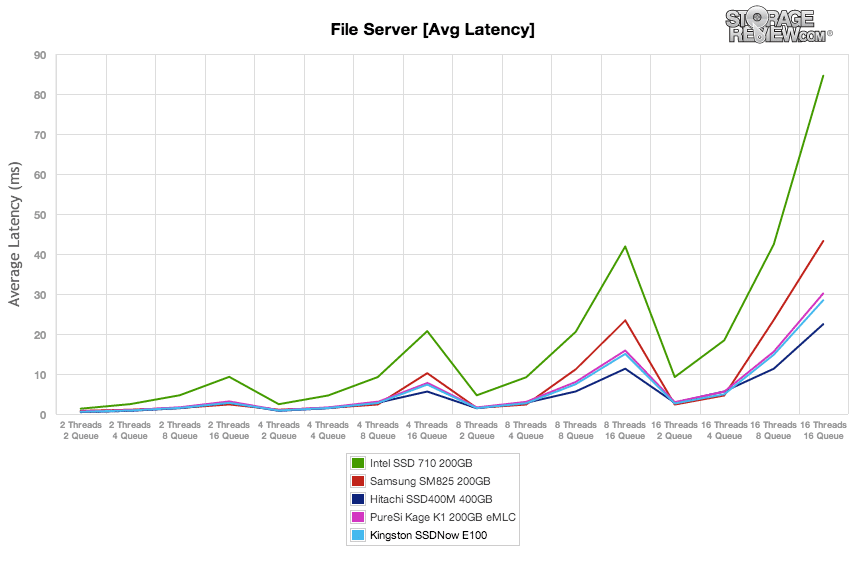
Average latency over the duration of the File Server preconditioning process had the Kingston E100 with a small edge over the Kage K1.
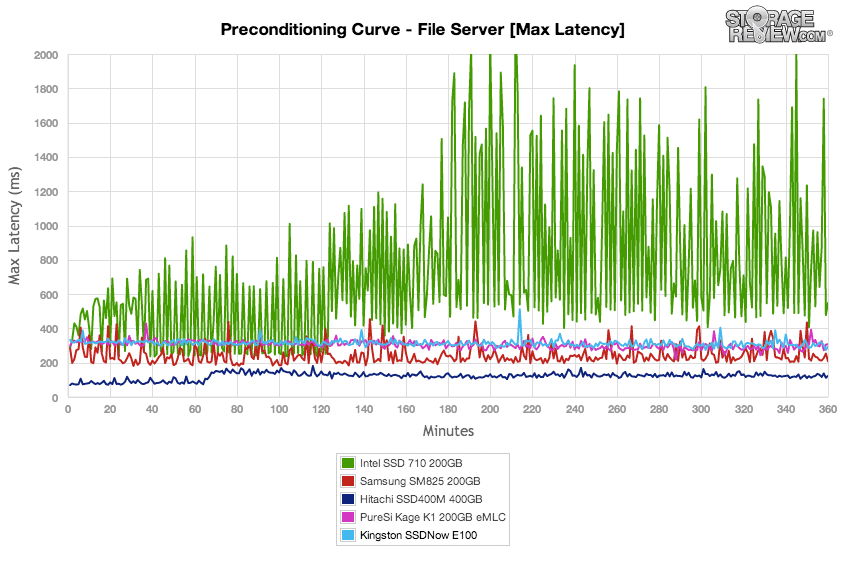
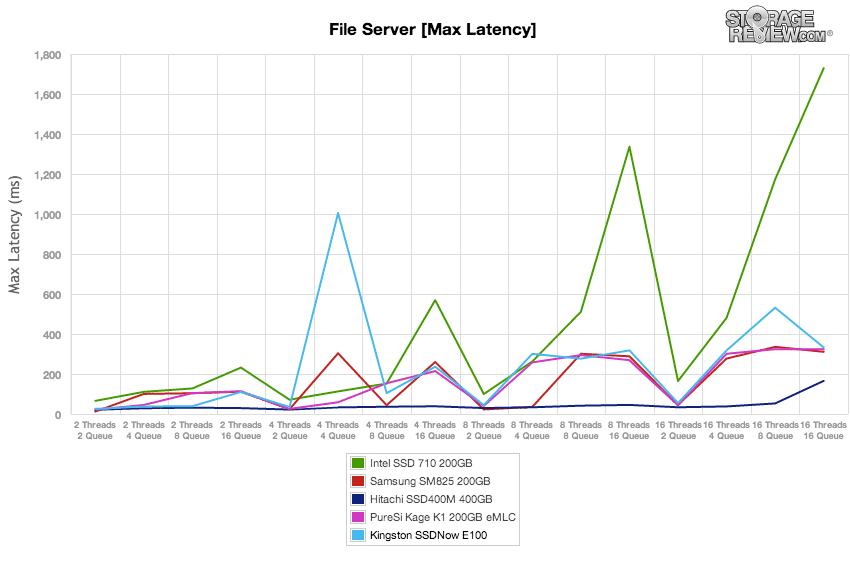
Similar to the 4K and 8K 70/30 workloads, the Kingston E100 offers a mirror image to the Kage K1 in max latency over the duration of the preconditioning process. These two drives come in towards the bottom-middle of the pack, in front of the Intel SSD 710, but behind the Hitachi SSD400M and Samsung SM825.
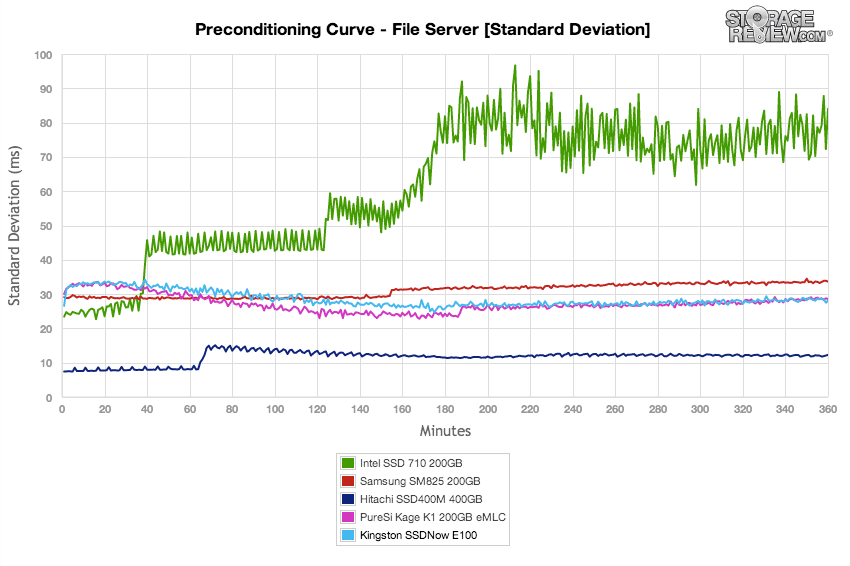
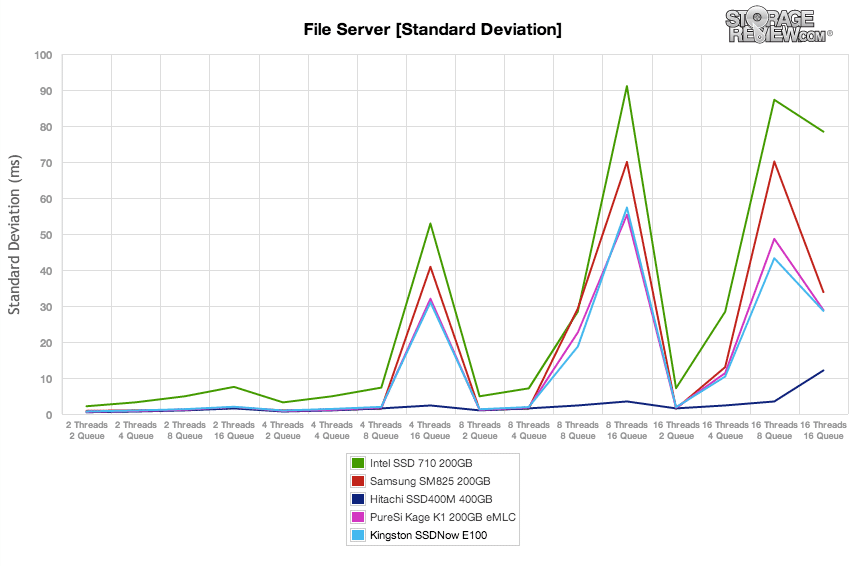
Comparing standard deviation, the two SandForce SF-2500-powered SSDs slipped ahead of the Samsung SM825 towards the latter half of the preconditioning phase.
Switching from a static 16T/16Q workload to a varying load between 2T/2Q and 16T/16Q, we find the Kingston E100 comes in at the top of the pack in performance. Under a midrange load, the E100 offers strong performance in our File Server workload, coming in with peaks above the SSD400M, coming up below the Samsung SM825.
The E100 was able to keep average latency suppressed at load levels lower than an effective queue depth of 32, where the queue depth limit of its SATA interface came into play. At higher peaks, it offered lower latency than the Intel SSD 710 or Samsung SM825, but higher latency than the SAS-based Hitachi SSD400M.
Throughout most of our individual tests the E100 kept peak response times under 500ms, except for one higher blip to 1,000ms at 4T/4Q.
Switching focus to standard deviation, the Kingston E100 kept latency consistent upwards to an effect queue depth of 32, where it went up dramatically. The Hitachi SSD400M was the only SSD to perform consistently across this test, with its SAS interface.
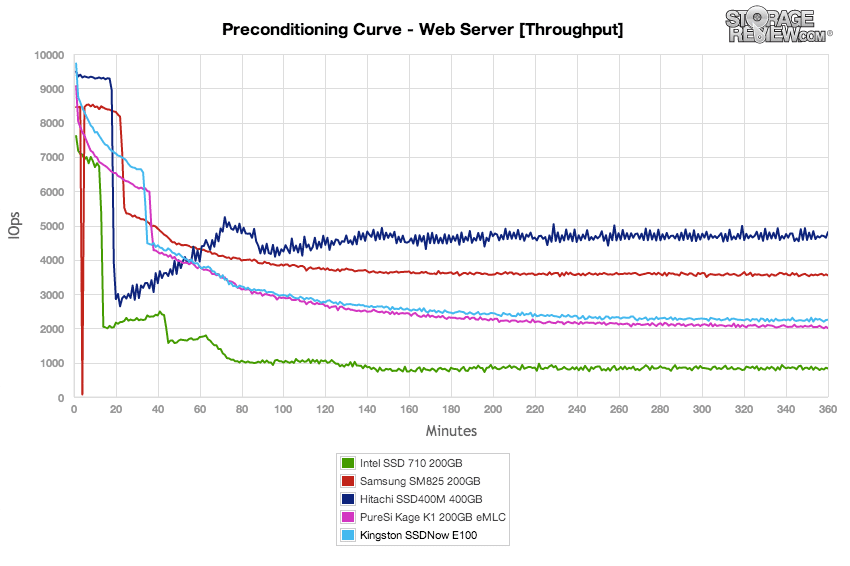
Our next preconditioning section is unique from our other workloads, where the main test is 100% read, meaning to precondition the drive for that activity we flip that profile to 100% write. For this reason results will appear much lower in this first section. In total throughput, the SandForce-based Kingston E100 comes in at the middle of the pack, above the Kage K1 and Intel 710, but below the Samsung SM825 and Hitachi SSD400M.
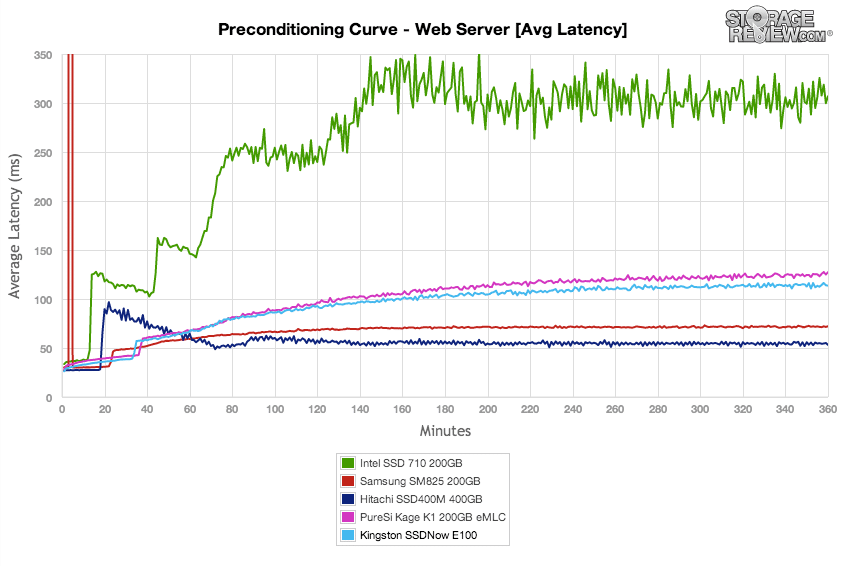
Comparing average latency, we see one large spike from the SM825 early into the test, with the Kingston E100 starting to level off in our saturation test between 4-5 hours in.
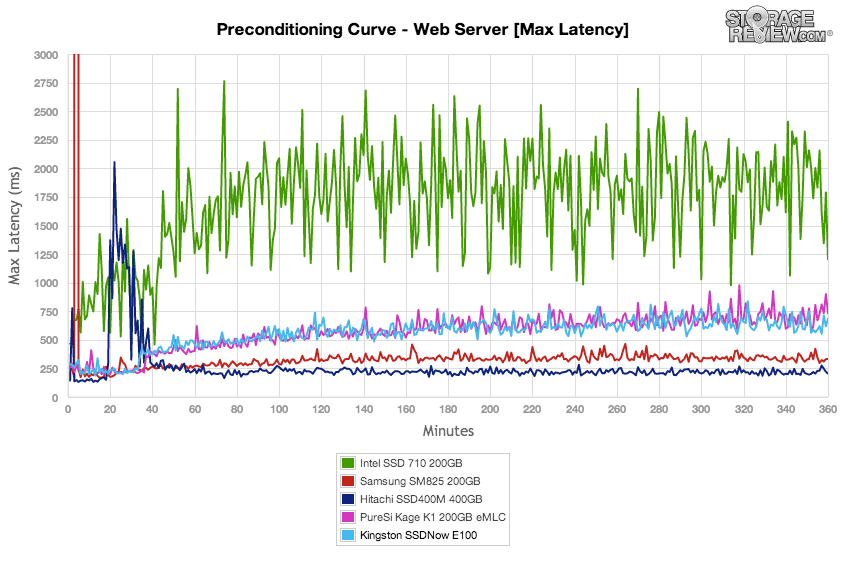
Max latency spikes from both of the eMLC SandForce models came in at the middle of the group, contained in the band between 600-1000ms, whereas the Samsung or Hitachi models measured 250-400ms. The Intel SSD 710 was on the other end of the spectrum, measuring 1000-2750ms once it reached steady state.
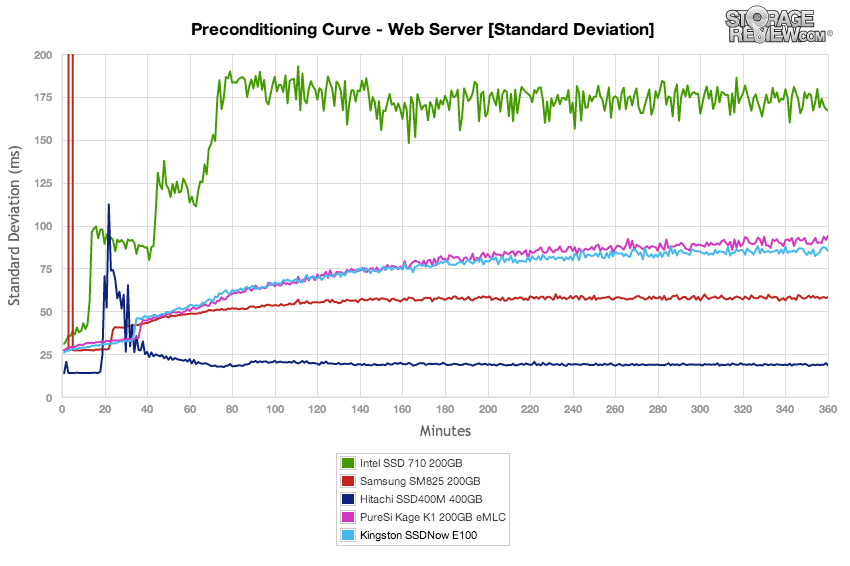
Looking at standard deviation, the Kingston E100 offered a slight edge over the Kage K1, but still came in higher than the SM825 or Hitachi SSD400M.
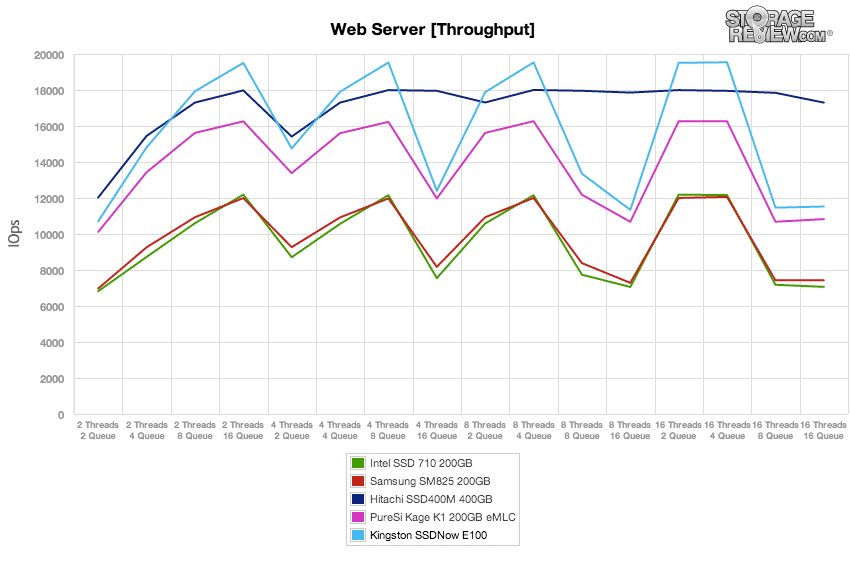
After the preconditioning phase finished and our workloads shifted to 100% read, the Kingston E100 really shined. The E100 offered the highest transfer speeds in conditions where the load stayed at or below an effective queue depth of 32. The SAS Hitachi SSD400M was able to offer consistent performance without getting bottlenecked, but in the areas that were optimal for the SATA interface, the Kingston offered the highest speeds out of the group, in some cases significantly higher than the Kage K1.
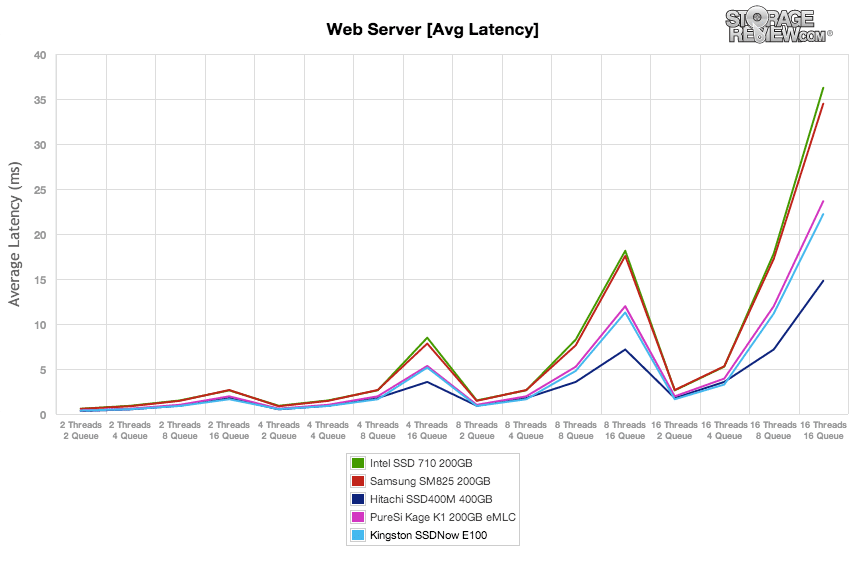
Average latency showed the Kingston E100 maintained its cool fairly well over the different loads, up until the point where it surpassed an effective queue depth of 32. At that stage average latency shot up dramatically, which was the norm for this group.
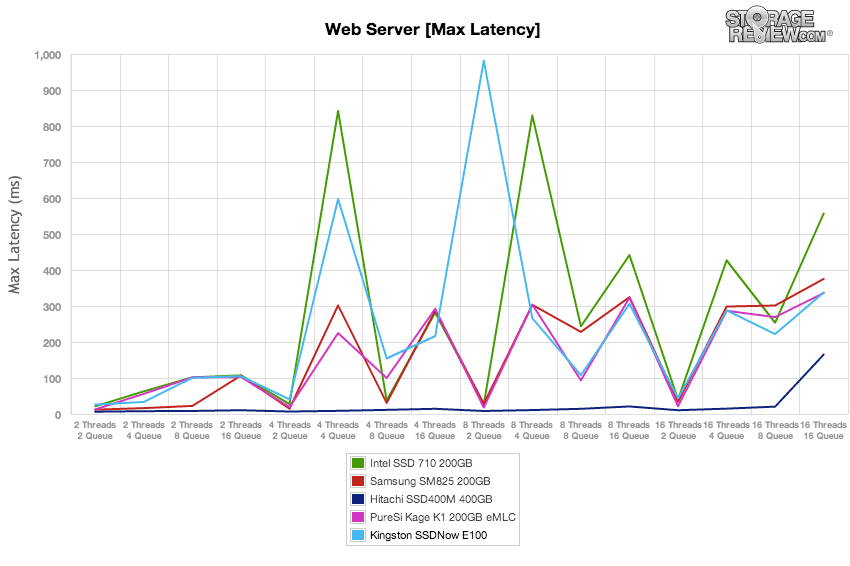
Comparing max latency, the Kingston E100 did had some of the highest peaks on the chart along with the Intel SSD 710, with the highest measuring between 600-1000ms.
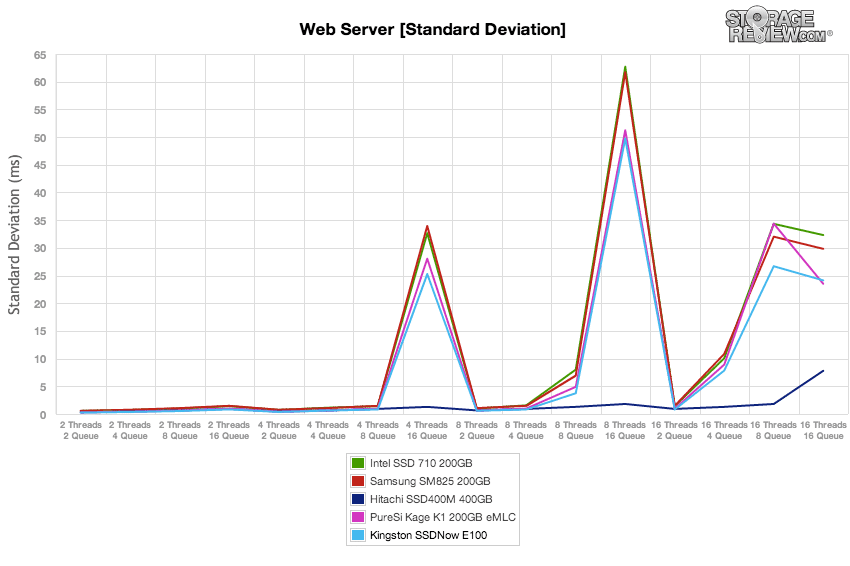
While the dramatic peaks were mildly concerning in our max latency test, looking at standard deviation, the spikes from the E100 were infrequent, with it keeping its response times consistent at levels at or below QD32.
Conclusion
The Kingston SSDNow E100 aims to fill an increasingly competitive entry enterprise space. This market segment is being flooded by a variety of MLC and eMLC SSDs in a land grab to earn key enterprise accounts with a mainstream and budget-friendly SSD. To Kingston’s credit, they’re offering a robust SSD for this category, complete with capacitors for data protection in the event of power loss and thermal pads for transferring NAND and controller heat into the metal case. The only major spec sheet or build knock against the E100 is the three year warranty, which is light in a space where five year warranties are the norm.
When we press the SSDNow E100 with enterprise workloads, we see that it does very well in most categories, especially the read-intensive web server profile where it had the highest transfer speeds in our enterprise eMLC/MLC group. In workloads with a mix of read and write activity, the SandForce-based E100 came in at the upper middle segment of the pack, and offered a surprising boost in performance over the similar spec’d pureSi Kage K1. To be fair though, the E100 gives up endurance to this closely matched competitor, part of the delicate balance that firmware can effect.
The performance/endurance balance is an interesting decision each SSD vendor must make. The E100 trades endurance for performance, but still boasts 30,000 P/E cycles, which is a boatload for a drive destined for heavy read workloads. Depending on the exact deployment, the performance benefit may warrant the decrease in endurance for those who want the performance/endurance equation lean a little more to the throughput side. Another important factor in the entry enterprise space is of course price; the E100 does come in as one of the most affordable SSDs in the enterprise eMLC space with a current going price of under $800 for the 200GB model. That puts it under all comparables, even the geriatric but reliable Intel SSD 710.
Pros
- Sturdy metal chassis with attention to thermals
- Offers an edge in performance over other SandForce-based eMLC SSDs
- Includes power loss data protection
- Most attractive pricing in the enterprise eMLC market
Cons
- Shorter than normal warranty
- Gains in performance may come at a cost of lowered endurance
Bottom Line
The Kingston SSDNow E100 is a complete offering for the higher-end entry enterprise space, offering more in terms of endurance, performance and enterprise-grade features than most other MLC and even eMLC-based offerings. In terms of cost, the Kingston E100 stands out offering the lowest pricing in the eMLC category, which will undoubtedly cause it to gain attention in the rapidly expanding entry enterprise market.
Kingston SSDNow E100 at Amazon.comDiscuss This Review


 Amazon