

The AFF A800 is the top-of-the-line ONTAP all-flash storage array from NetApp, which at launch offered an industry-first, end-to-end NVMe/FC over 32Gb FC, as well as 100GbE connectivity. To date, we have been working our way through the all-flash AFF lineup, starting with the potent A200 (having since been replaced by the A220) as well as the A300. Both of the units we previously reviewed won Editor’s Choice awards. Today we will be looking at the NVMe-based A800 powerhouse that offers the same ONTAP benefits of the previously reviewed models, as well as exponentially faster performance and lower latency. While this initial review focuses on system performance over Fibre Channel, subsequent articles will dive into the A800’s end-to-end NVMe over Fabrics (NVMeoF) support.
Unlike the A200 and A300 that were built for different segments of the midrange market, the A800 is designed for the workloads that demand the most performance (such as AI and Deep Leaning), while also including the robust set of enterprise data services that ONTAP is known for. As a point of clarity, NetApp has a series of truly go-fast storage in the EF all-flash family, like the midrange EF570 we reviewed previously. Back to the A800, NetApp claims the system can hit 1.3 million IOPS at under 500μs latency and throughput of up to 34GB/s with an HA pair. At scale, this means an NAS cluster can deliver up to 11.4M IOPS at 1ms latency and 300 GB/s of throughput. A SAN cluster can deliver up to 7.8M IOPS at 500µs latency and 204GB/s of throughput.
Like the rest of the AFF A-series systems, the NVMe A800 can scale to 24 (12 HA pairs) 4U dual-controller nodes in a cluster in NAS configuration. Because this is an NVMe-based system, there is a little nuance when it comes to drive scaling. The midrange A300, for instance, supports 4608 drives where the A800 tops out at 2880. While not likely to be a functional issue when deployed, we highlight this just to indicate that NVMe-based systems have different engineering challenges when considering JBOD expansion shelves than SAS-based systems, so we can’t just assume as you move up the product line that everything gets bigger. In a SAN configuration, the NVMe A800 scales to 12 nodes (6 HA pairs) with support for 1,440 drives. That said, if users leverage 15.3TB NVMe SSDs, they can scale up to 2.5PB in a 4U footprint. With data efficiencies enabled (assuming 5:1), the A800 supports over 315PB in a 24-node NAS cluster and 160TB in a SAN cluster.
While NetApp has enabled front-end NVMe support in other AFF systems, the A800 offers what is called end-to-end NVMe support. As noted, we’re not going to dive all the way into what this means in this review. Suffice it to say that the A800 is the first all-flash NVMe array to accomplish this. Effectively, what this means is that organizations can take advantage of the emerging wave of NVMeoF capabilities today, while still servicing their more traditional workloads over FC. Previously, organizations wanting to take advantage of NVMeoF were generally relegated to “science project” types of deployments that while fast, had limitations when it came to scale and data services. NetApp’s implementation here addresses those shortcomings, while also providing support for the standard connectivity options in both FC and Ethernet.
Of course, we can’t talk A800 without highlighting cloud connectivity and the NetApp Data Fabric. Inherent to ONTAP is a deep set of connectivity to leading cloud providers, enabling customers to place their data where it makes the most sense, be it locally on the A800 or somewhere else. NetApp supports cloud and multi-cloud connections with Amazon Web Services, Microsoft Azure, Google Cloud Platform, and others. Broad cloud support lets NetApp customers have the flexibility they need when managing their data footprint and the nimbleness to move data around as needed to take advantage of cloud economics, new features or shape types, and so on.
Our particular build consists of an A800 with 24 x 1.92TB NVMe SSDs with two four-port 32Gb FC ports connected per controller (8 ports total) with ONTAP 9.5RC1 installed.
NetApp A800 specifications
| Maximum Scale-out | 2-24 nodes (12 HA pairs) |
| Maximum SSD | 2880 |
| Maximum effective capacity | 316.3PB |
| Per system active-active dual controller | |
| Controller form factor | 4U |
| PCIe expansion slots | 8 |
| FC target ports (32Gb autoranging) | 32 |
| FC target ports (16Gb autoranging) | 32 |
| 100GbE ports (40GbE autoranging) | 20 |
| 10GbE ports | 32 |
| Storage networking supported | NVMe/FC FC iSCSI NFS pNFS CIFS/SMB |
| OS version | ONTAP 9.4 RC1 or later |
| Shelves and media | NVMe Drive Packs |
| Host/client OS supported | Windows 2000 Windows Server 2003 Windows Server 2008 Windows Server 2012 Windows Server 2016 Linux Oracle Solaris AIX HP-UX Mac OS VMware ESX |
Design and Build
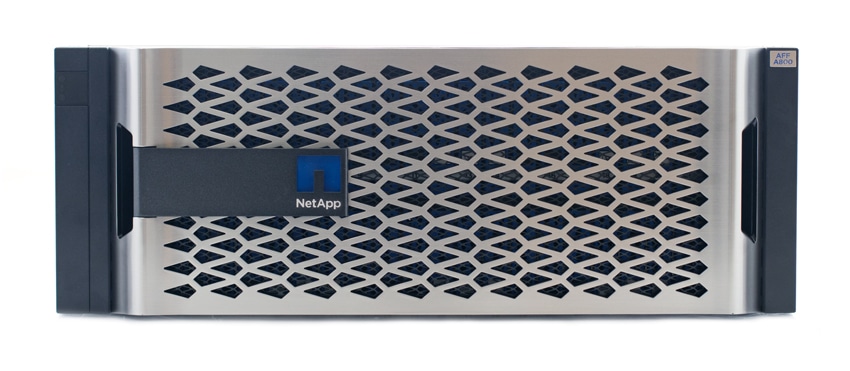
The NetApp AFF A800 is a 4U array that has a very similar look to the rest in the AFF series. Beneath the stylish bezel that contains ventilation and NetApp branding, are two rows of blue 2.5” drive bays for the SSDs.
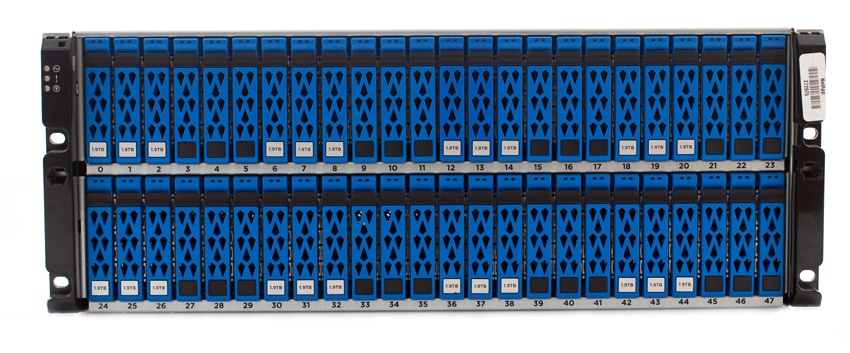
Looking at the NVMe drives themselves, NetApp supports a wide range of capacity options including 1.9TB, 3.8TB, 7.6TB and 15.3TB SSDs. As of this writing, NetApp is shipping all of these drives as self-encrypting (SED) with AES-256 encryption. Additionally, for systems initialized with ONTAP 9.4, fast drive zeroing is enabled.
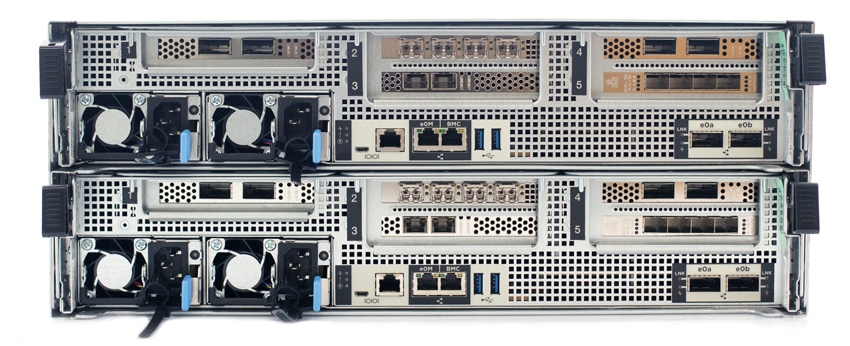
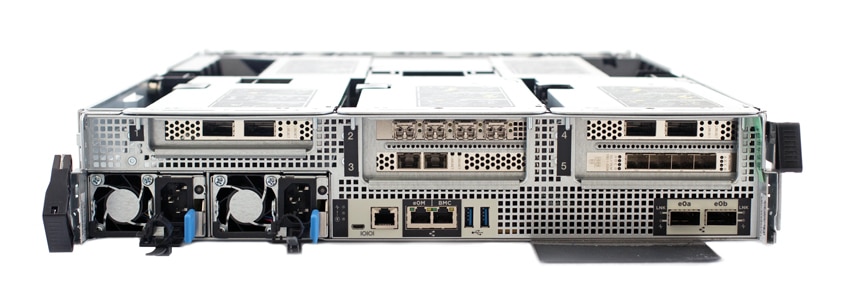
Flipping around to the rear of the device, there are two controllers: one stacked on top of the other like a mirror image. Our configuration includes four different styles of interfaces for connectivity. These four cards are on the right-most and middle PCIe slots. They include a quad-port 32Gb FC card (top left), a dual port 25GbE networking card (bottom left), a dual-port 100GbE networking card (top right) and a quad-port 10GbE networking card (bottom right).
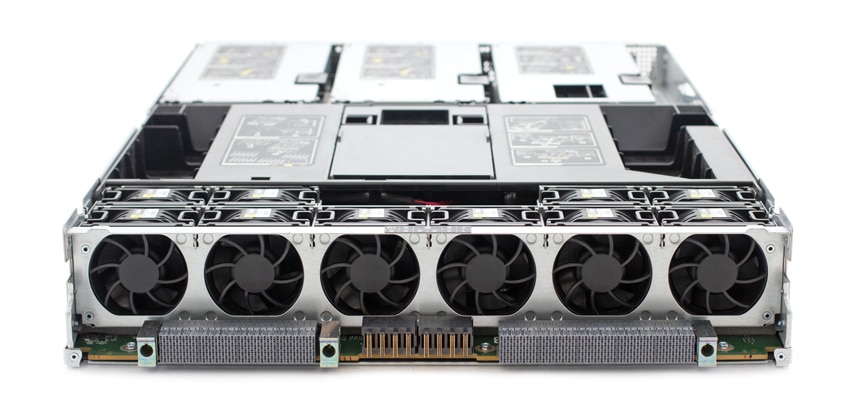
Removing one of the controllers, we can see the connections to the rest of the unit, as well as the fans that line the front of the controller.
Flipping around to the rear controller, the left side has dual redundant PSUs for each controller as well as the HA interconnect ports and cluster interconnect ports. The right bottom of each controller also has 1HA and cluster interconnect ports. The bulk of the rest are taken up with PCIe slots (five) that can be populated with networking ports 100GbE, 10GbE, or 32Gb Fibre channel or some combination of the above as in our configuration. In the middle bottom are the management ports and two USB 3.0 ports.
The controller is incredibly easy to open up, making it very serviceable.
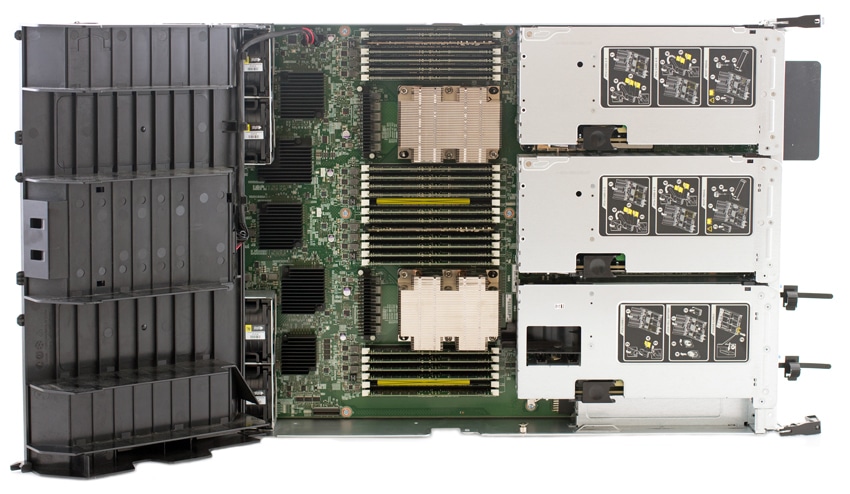
We can see the two CPUs, 20 DIMM slots (populated with 20 x 32GB DIMMs of RAM), and the two NVDIMM slots. The PCIe network AICs are also easily accessible from here.
Management
The ONTAP GUI has come a long way over the years, from a Java-enabled GUI in the 8.2 and older days to the modern and well-designed web-driven ONTAP 9.5. NetApp has made significant enhancements to the GUI, making it more and more usable for more than just day-to-day administration functions.
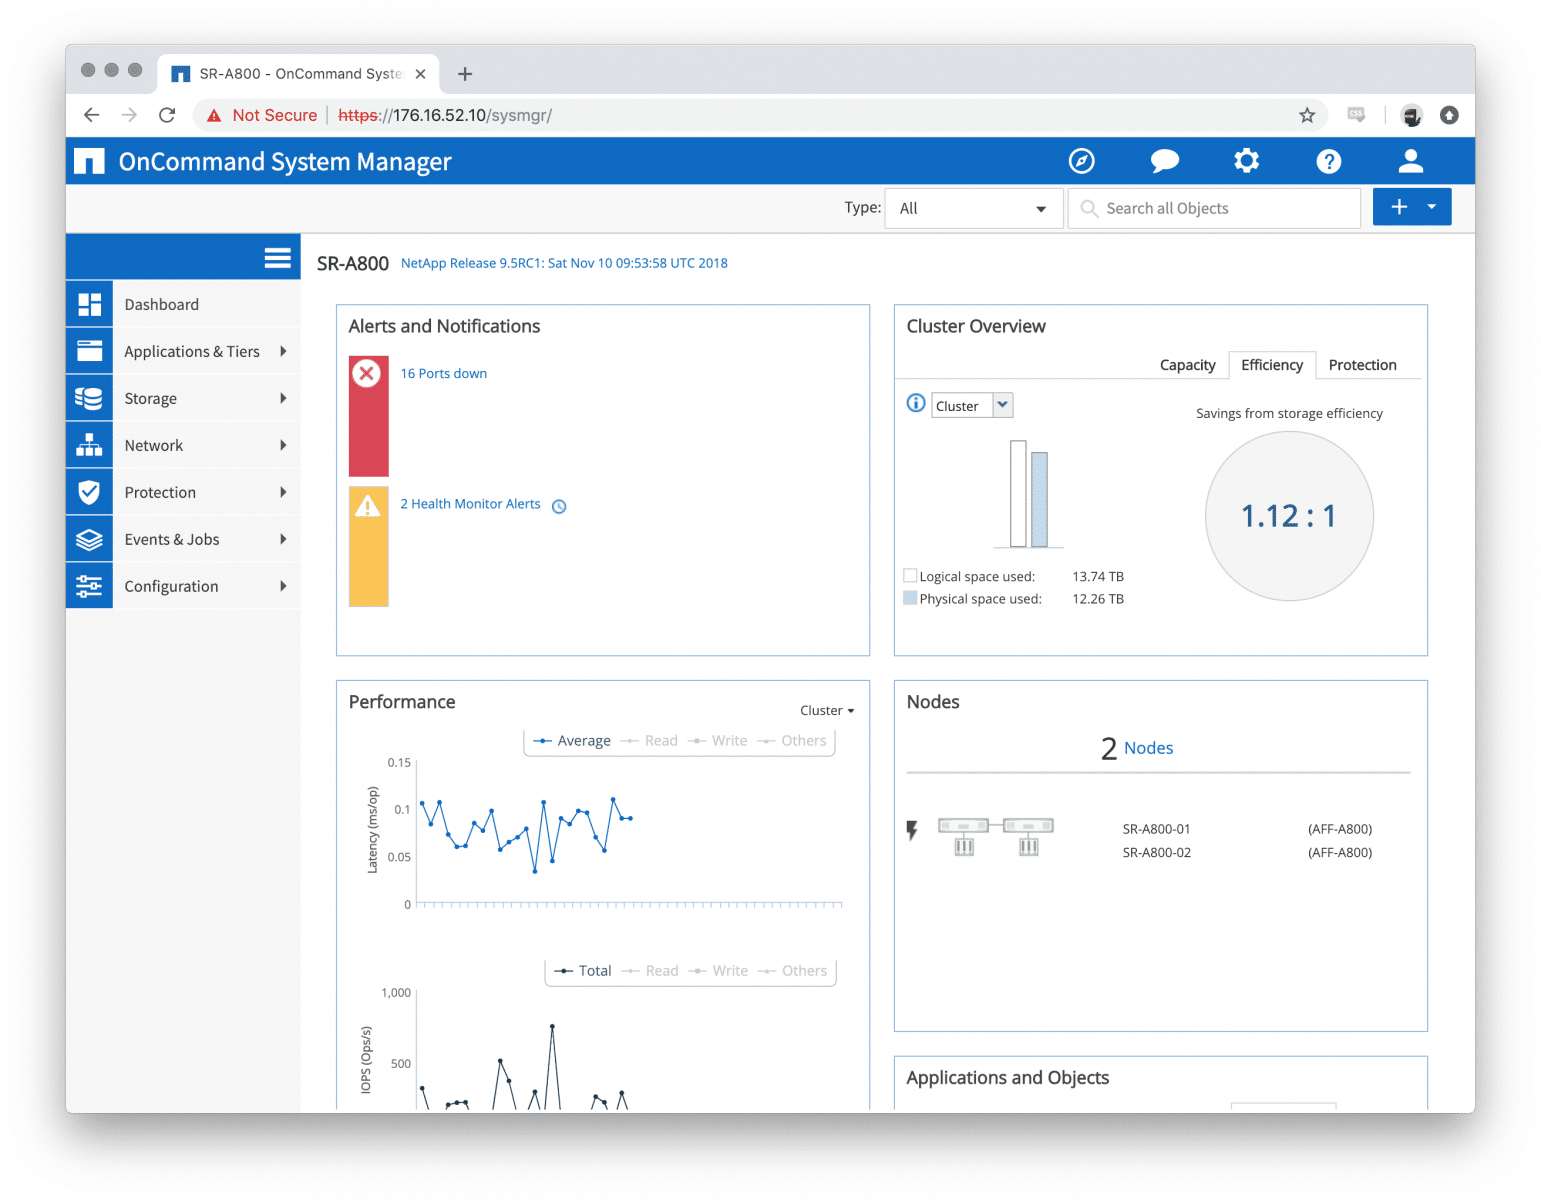
Dashboard:
After logging in, you’re greeted by the dashboard which will give you a quick rundown of what’s happening with the system. The dashboard is pretty straightforward as far as what you’re able to see. Each of the widgets allows for quick glances at alerts, performance, capacity, efficiency and protection. For more detailed viewing and long-term trending, it is recommended to use NetApp’s (free) OnCommand Unified Manager for ONTAP metrics.
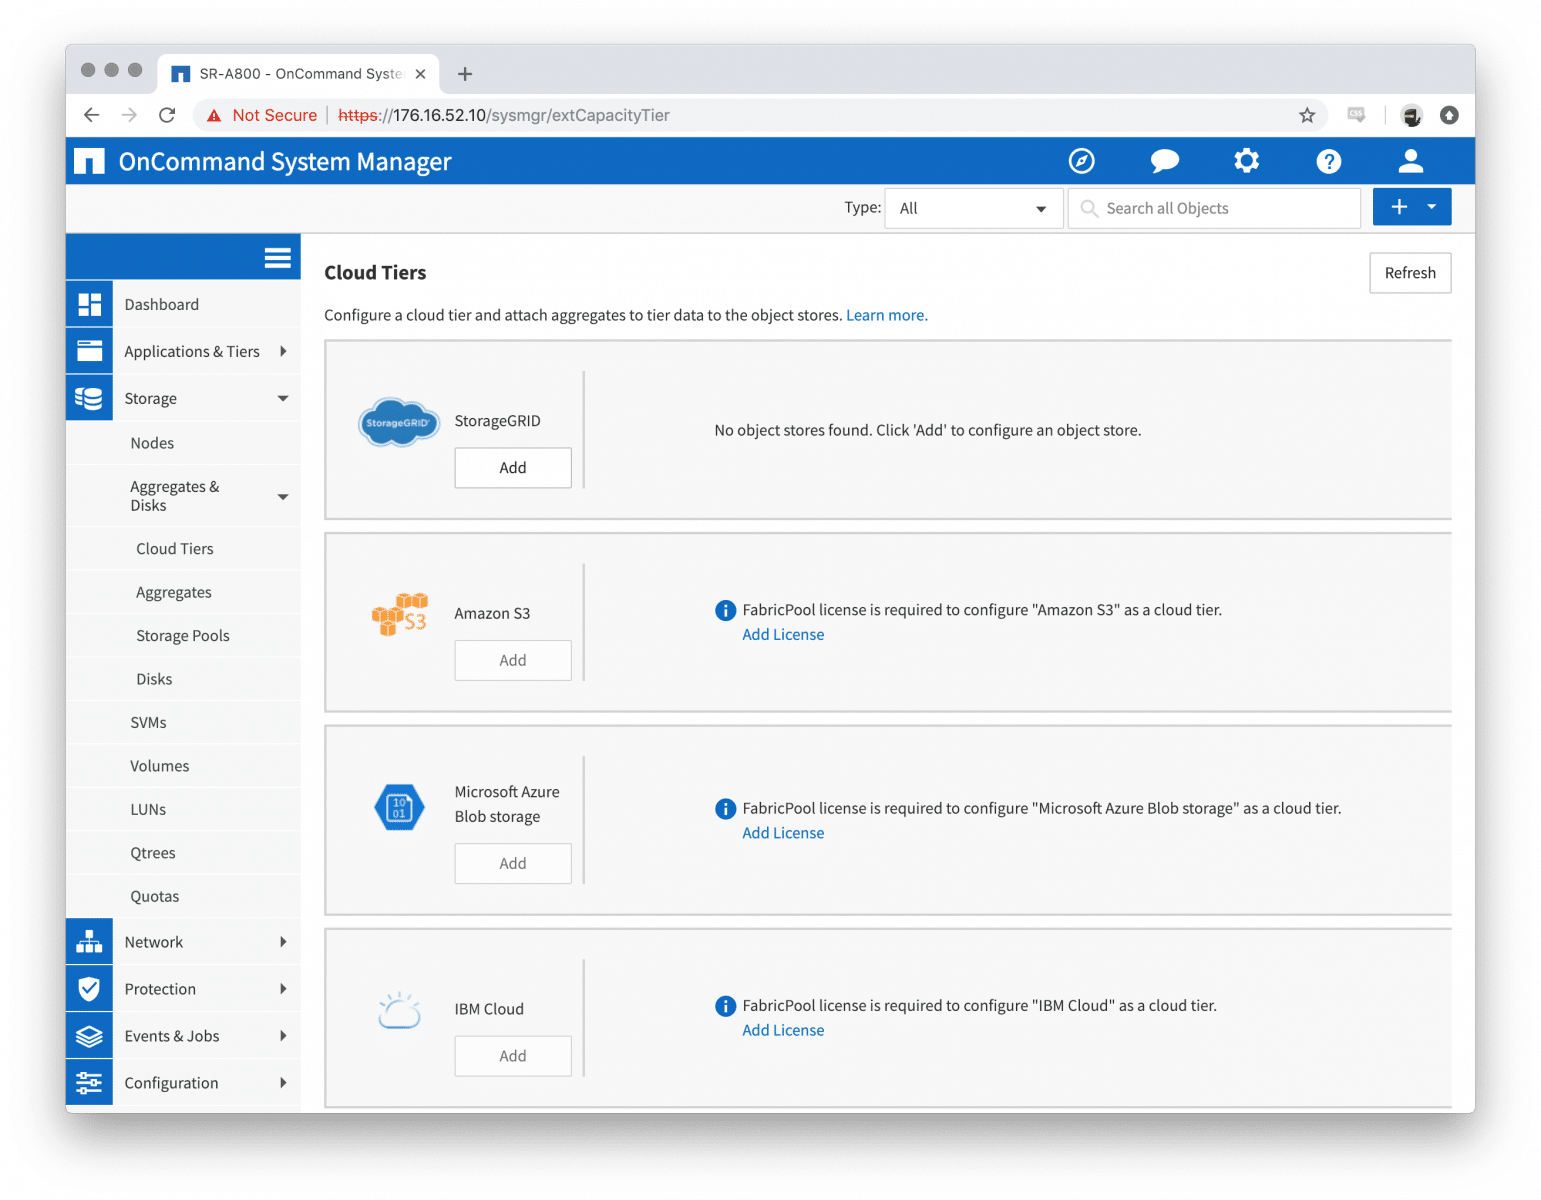
Cloud Tier:
With the addition of NetApp Cloud option Fabric Pool, the GUI makes it simple to connect to public clouds, including NDAS, as well as local StorageGRID.
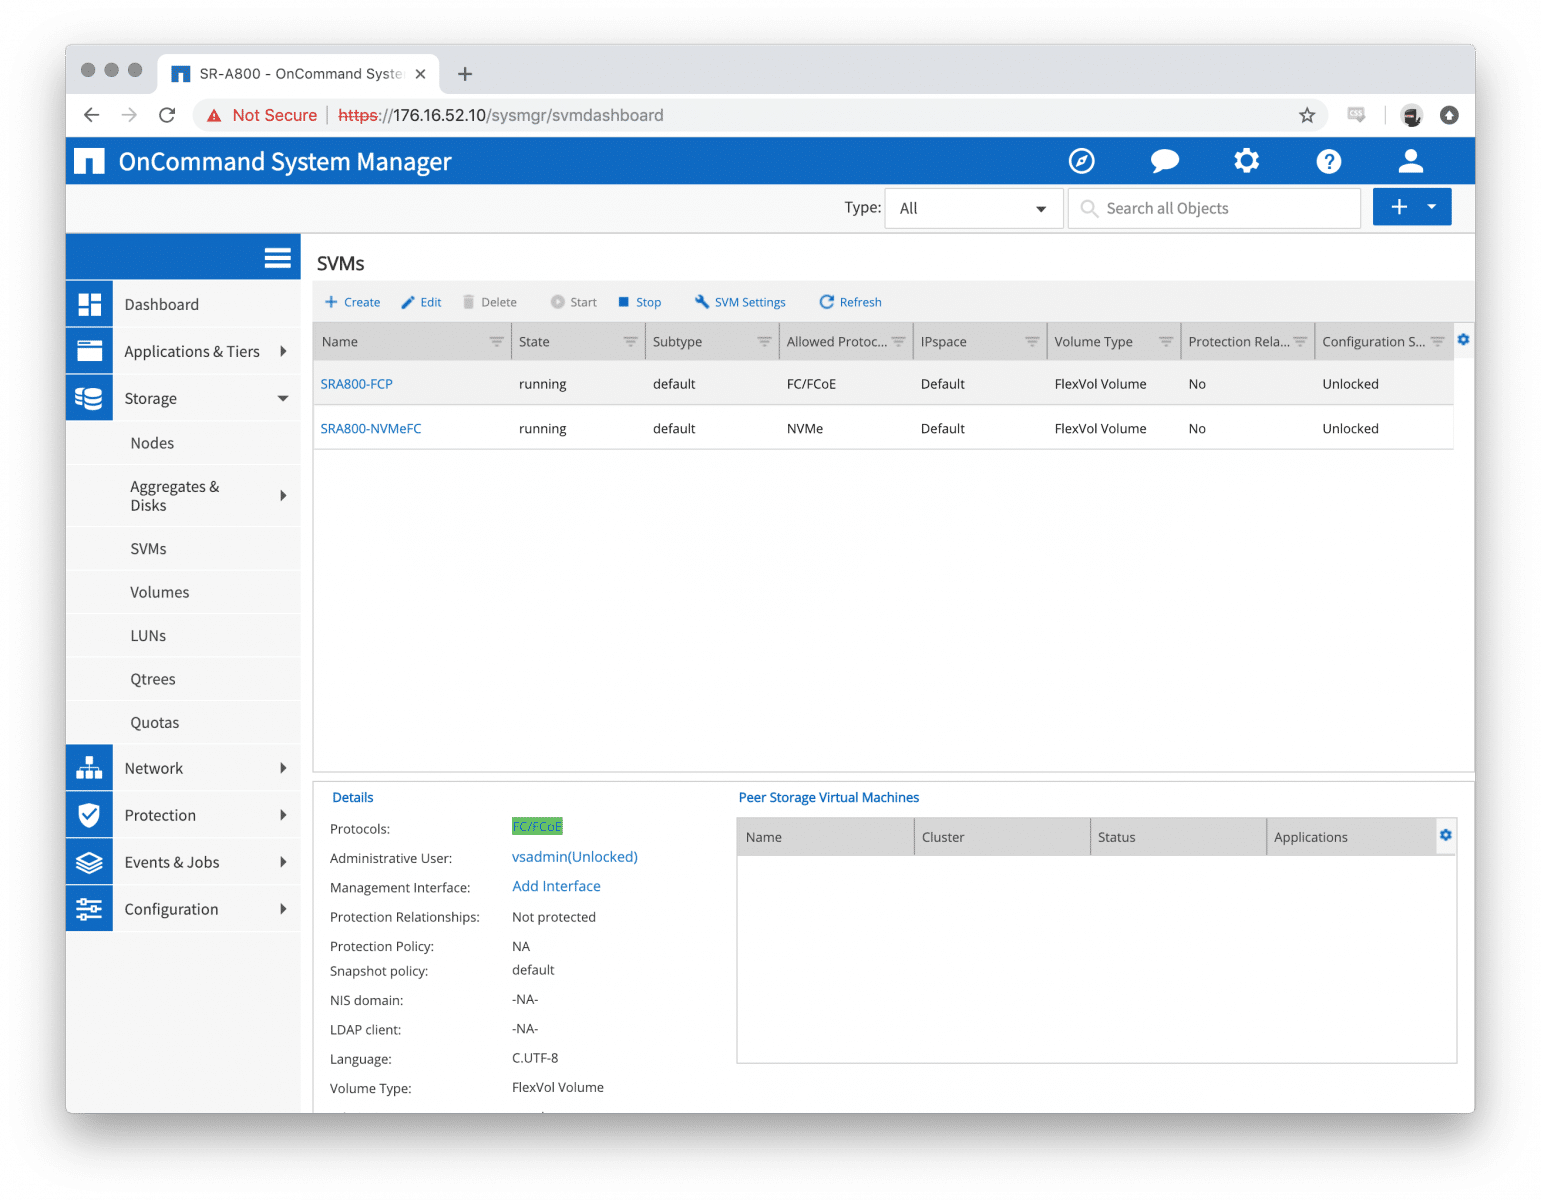
SVMs:
From this tab, you’re able to create, edit, delete and start/stop all of the data protocol SVMs on the ONTAP cluster as well as edit various settings.
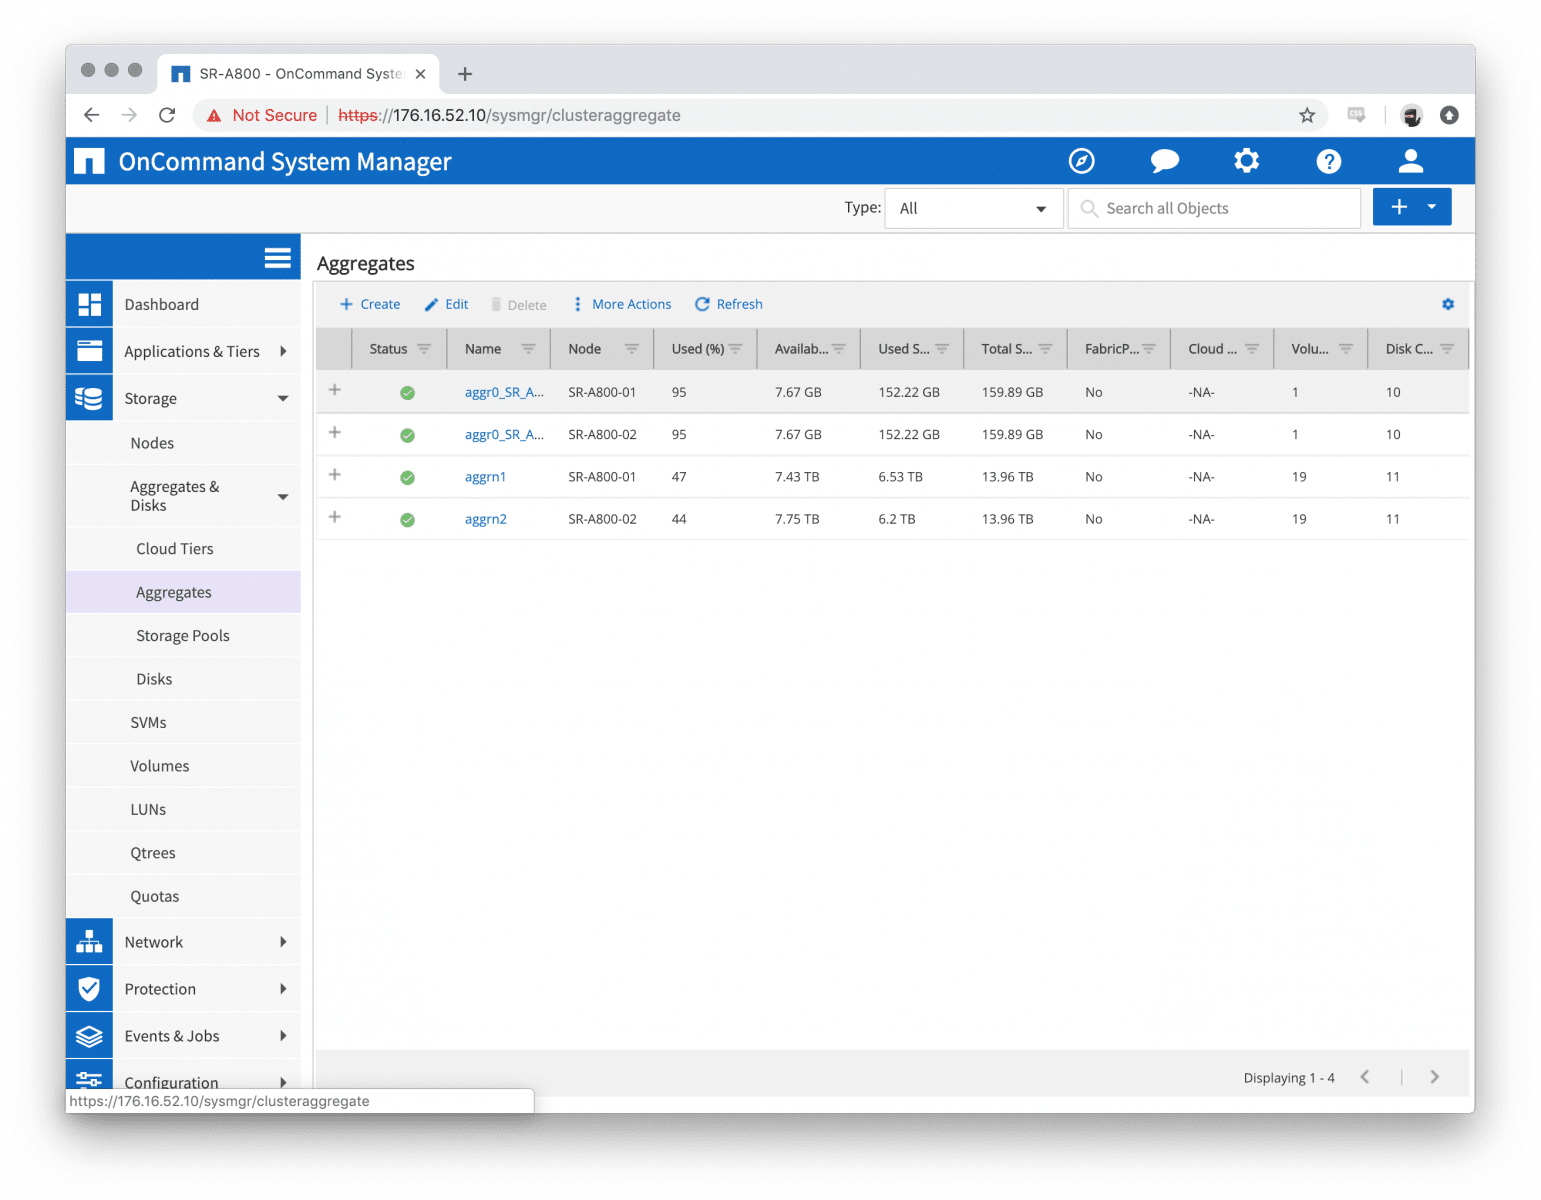
Aggregate and Storage Pools:
The Aggregate and Storage Pool tabs allow for straightforward creation and management of Aggregates and Storage Pools.
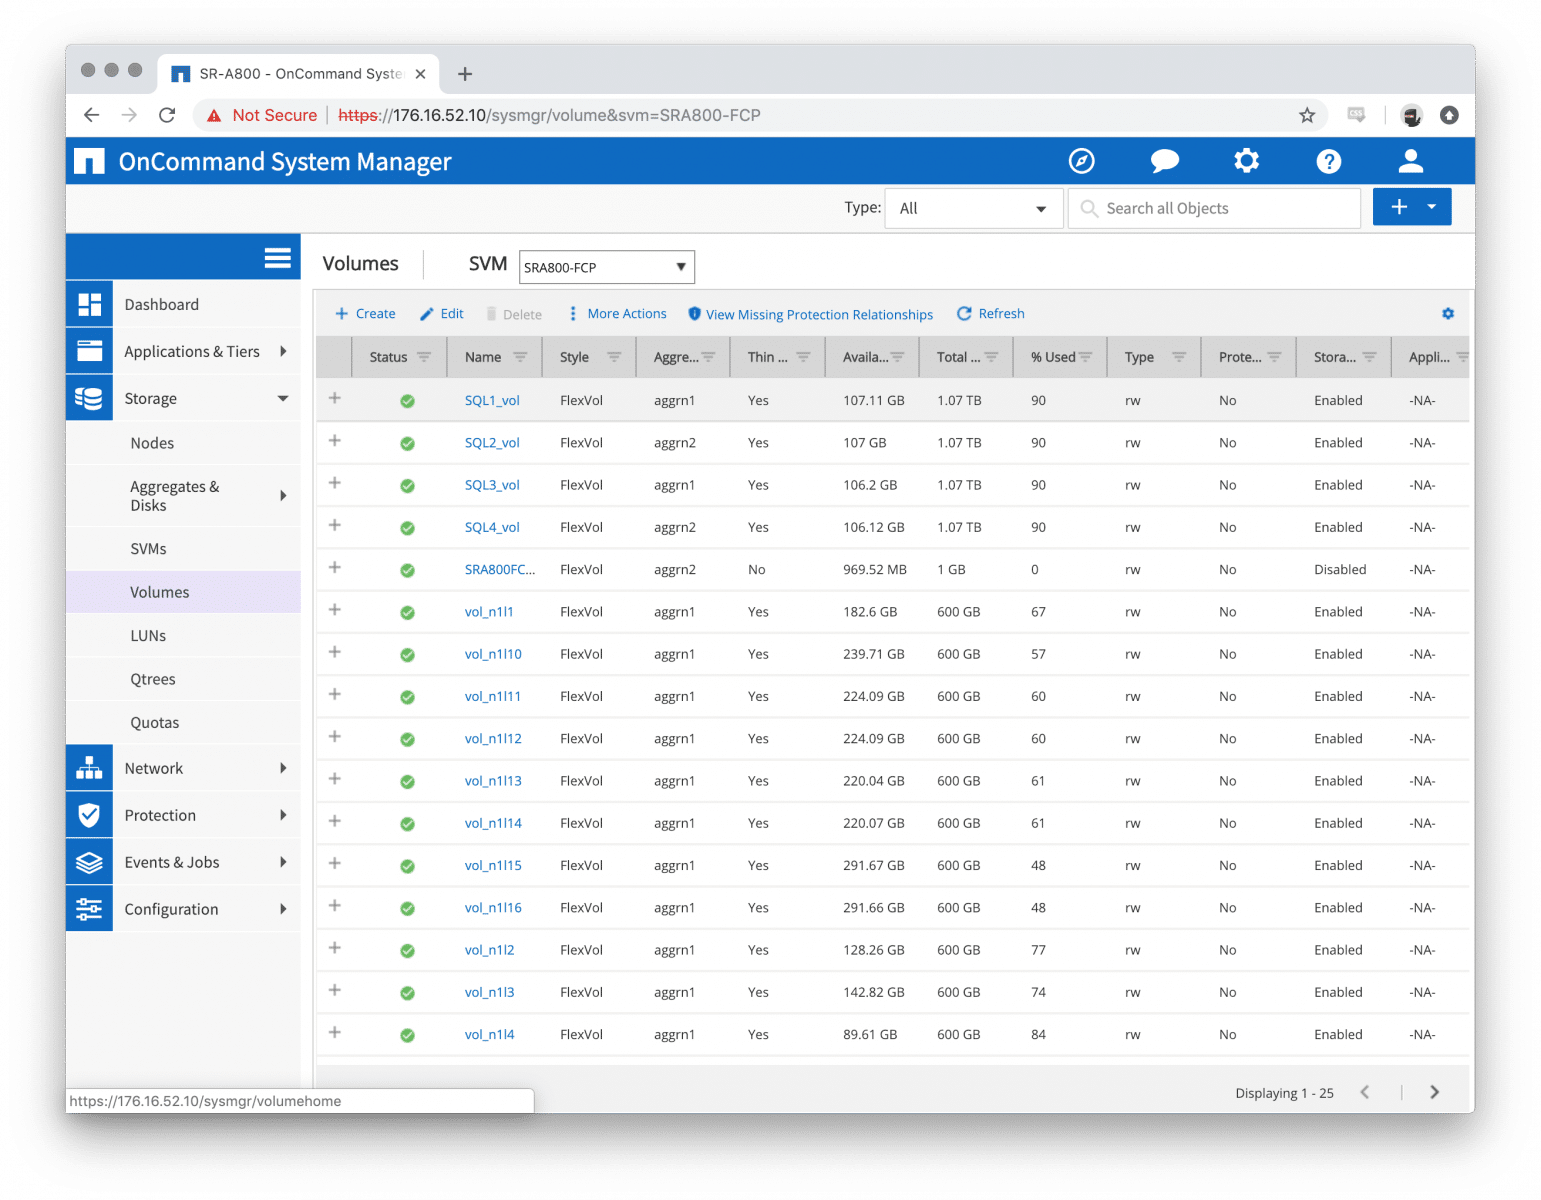
Volumes and LUNs:
The Volume and LUN admin page gives you a wide variety of creating and administering FlexVols, FlexGroups and LUNs, and even igroups and mapping for each of the SVMs.
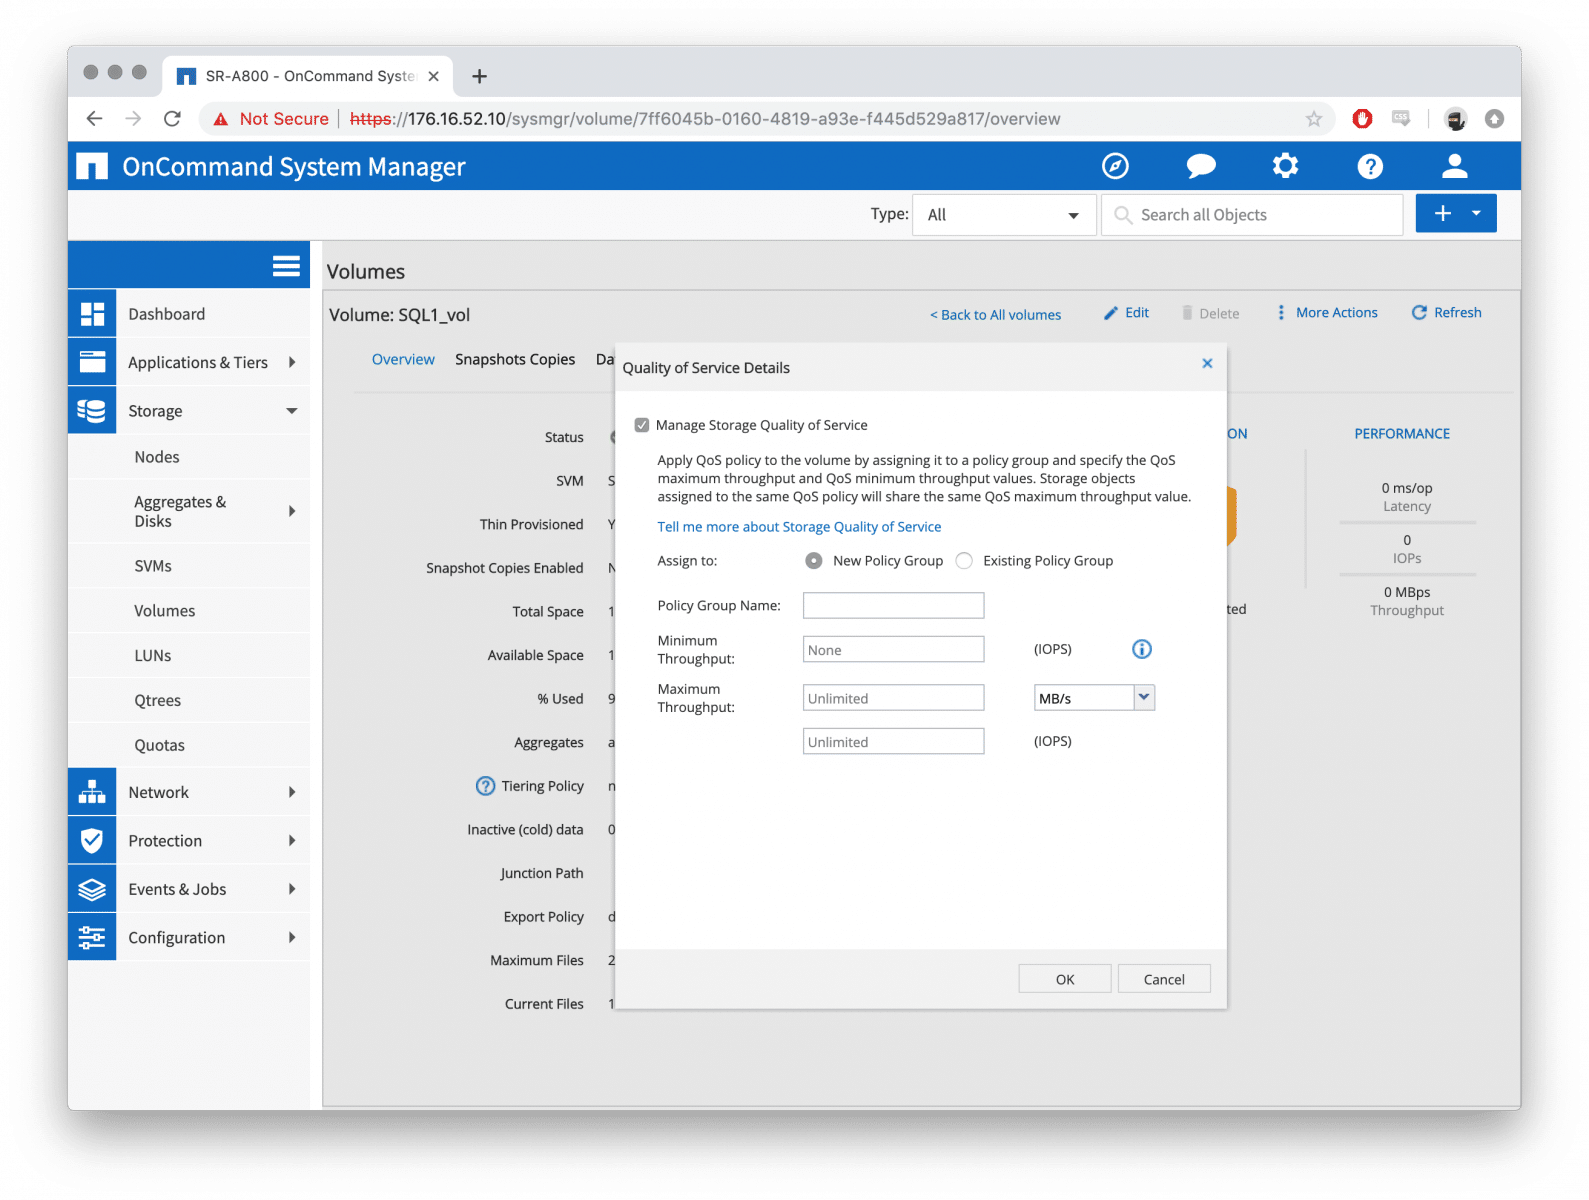
QoS:
QoS has come a long way on ONTAP over the years, as you are now able to configure a ceiling and floors for each workload, as well as have them configured to be adaptive to your changing workloads. QoS can be applied to various objects inside of ONTAP such as Volumes, Files, and LUNs as well as a few other objects.
Network Config:
All of the basic network configuration and administration is there in the GUI: IP Spaces, Broadcast Domains, Ports, LIFs, FC and now NVMe.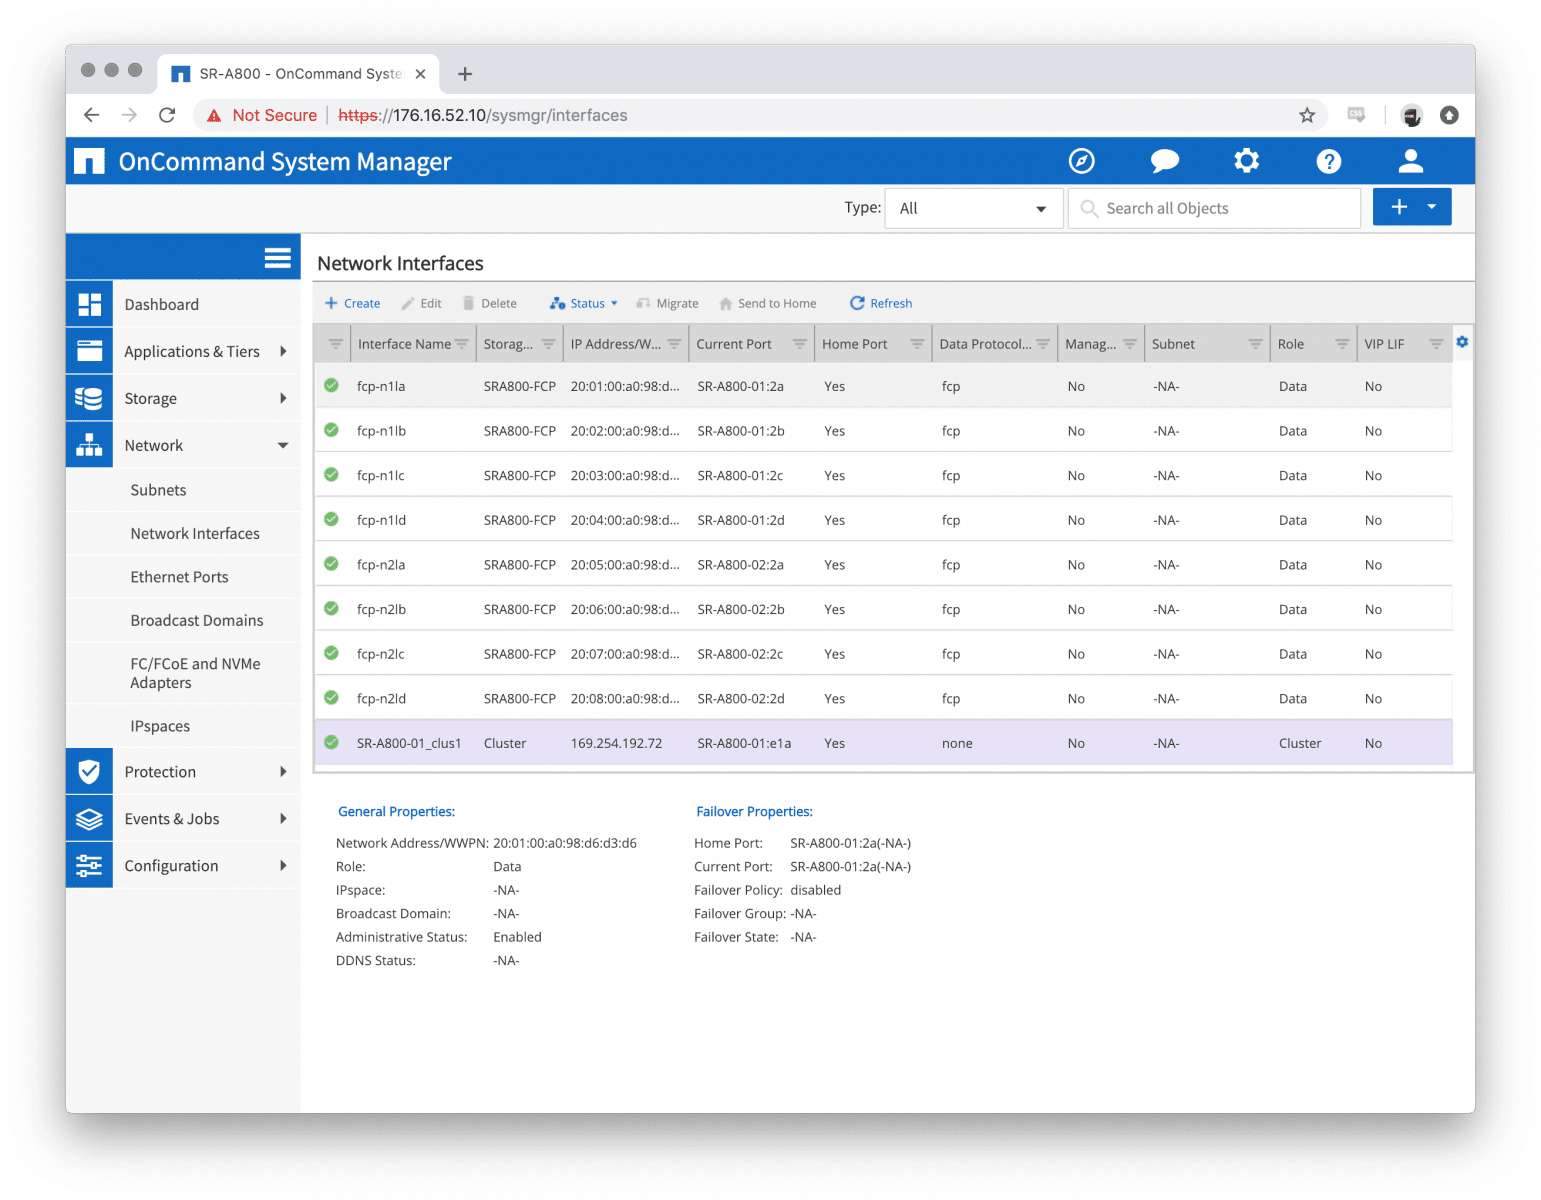
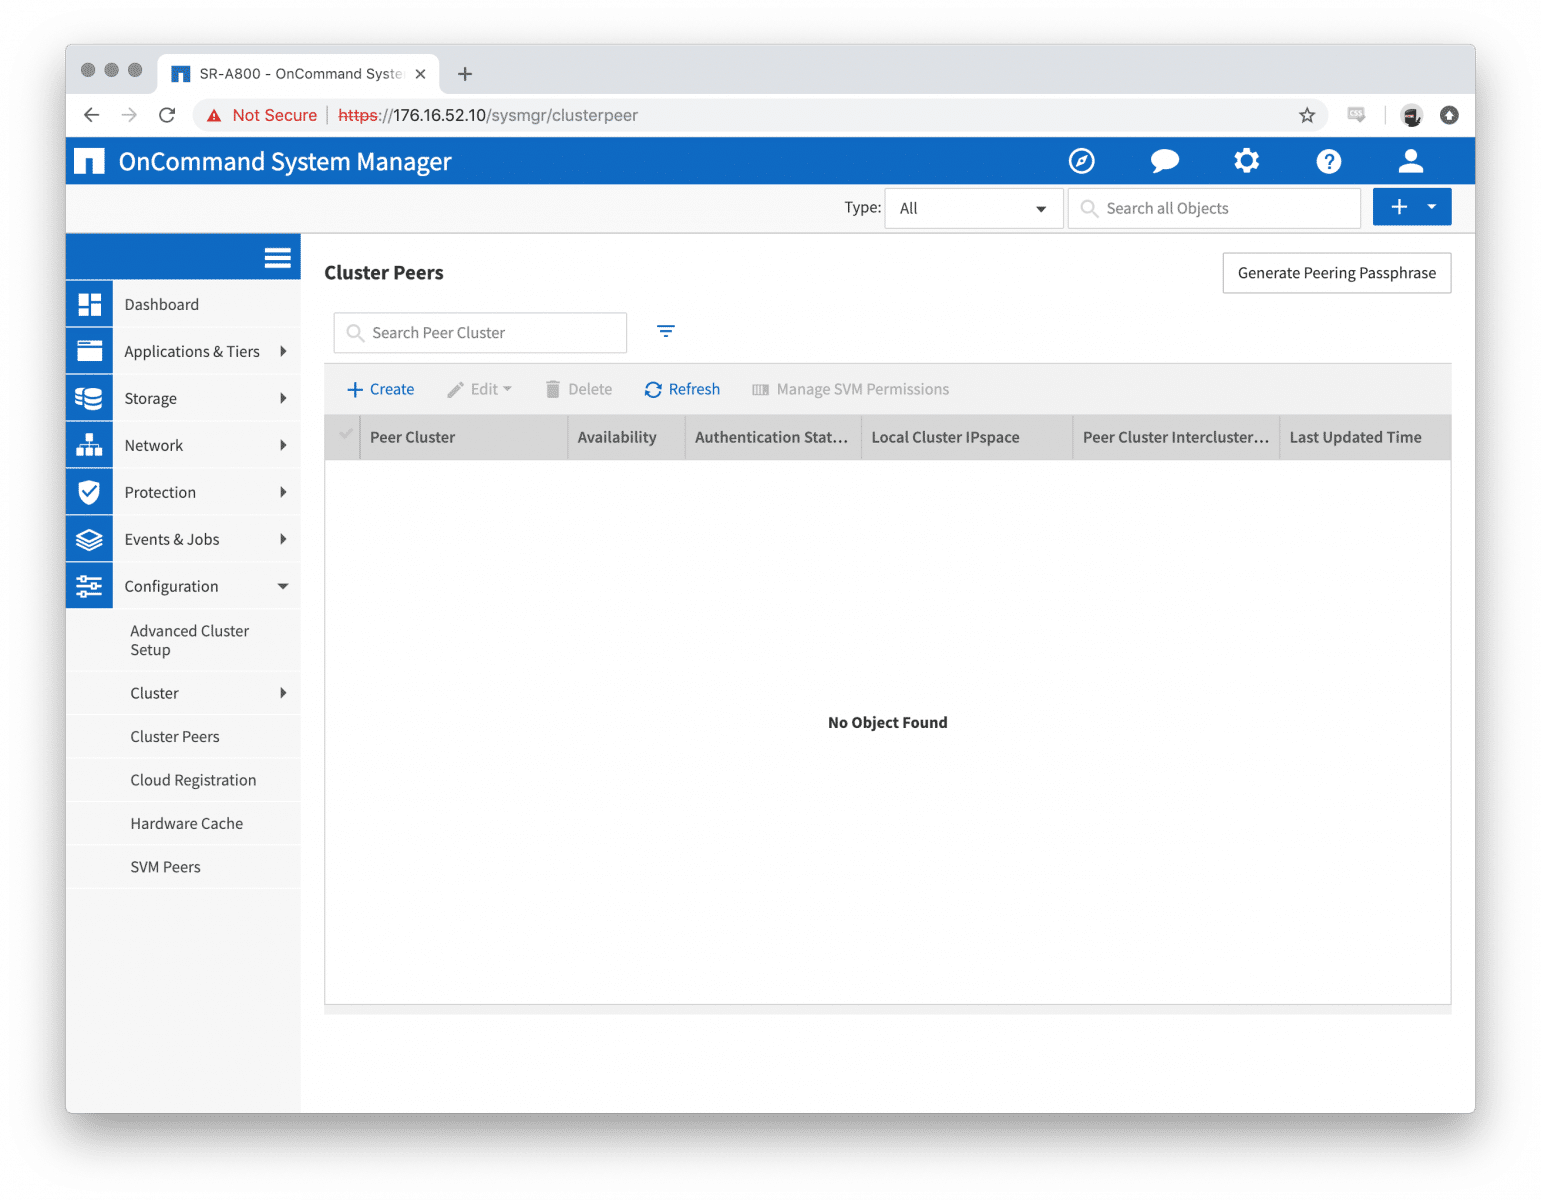
Peering:
Up until the last few versions of ONTAP, you needed to create peering relationships solely via the CLI; however, now you’re able to create Cluster peers and even the SVM peers in the GUI as well. Once you have peering configured, you’re even able to create a SnapMirror relationship directly in the Volume creation wizard.
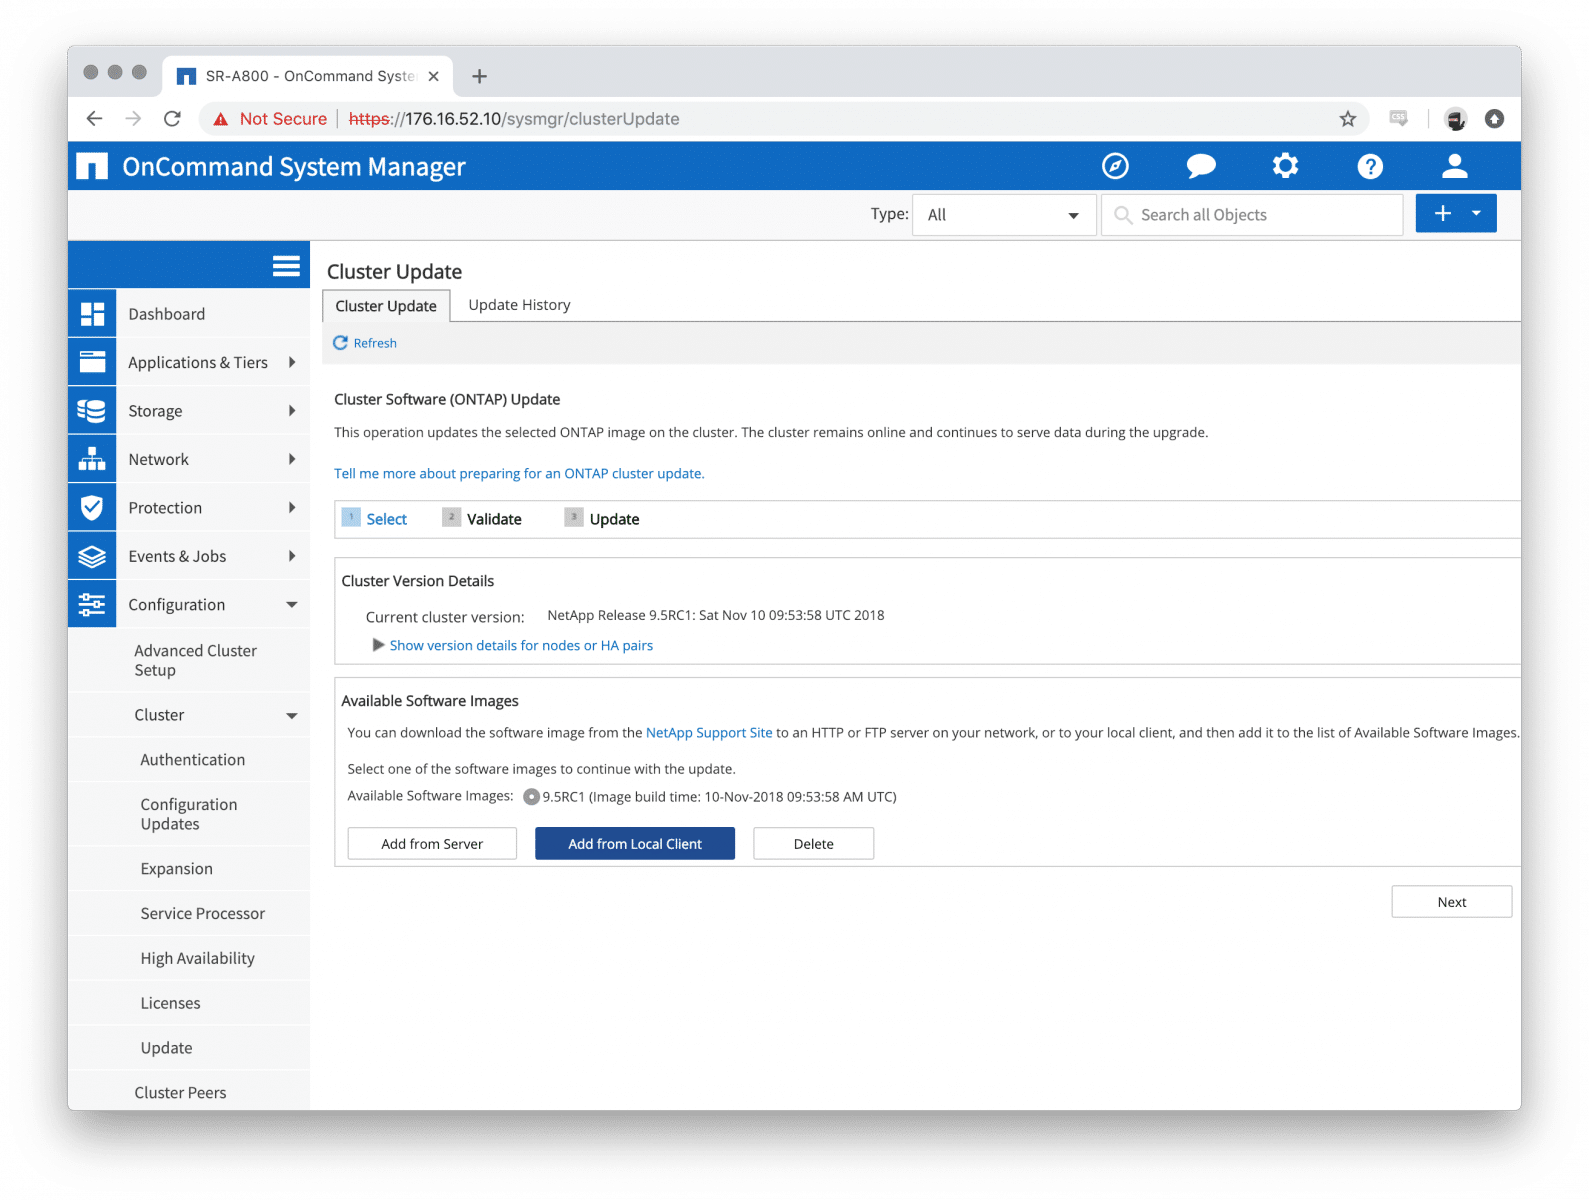
Cluster Updates:
ONTAP upgrades are getting easier and easier to go through. A small, yet very useful feature added in 9.4 makes it even easier to do ONTAP updates. We all love the command line for sure, but this makes it really easy to work with customers to upgrade their files. No more http/ftp servers to mess with; just upload the .tgz file direct and run the automated cluster update.
Performance
For performance, we will be comparing the A800 to the A300. This is used to show how well the performance of the NetApp AFF models scale as you move up in the family. In all of our tests we have data-reduction services enabled, meaning inline dedupe and compression are enabled. As we’ve noted in past reviews, NetApp ONTAP provides great DR capabilities with minimal overhead or performance impact.
The configuration of our NetApp AFF A800 included 8 32Gb FC ports with 24 1.92TB NVMe SSDs installed. Out of the 24 1.92TB SSDs deployed in our A800, we split them up into two RAID-DP Aggregates, with 11 SSDs in use and one as hot-spare. The array was connected via 32Gb through two Brocade G620 switches, which then had 16 16Gb links to our Dell PowerEdge R740xd servers.
For our synthetic benchmarks using VDbench as well as Sysbench, we provisioned 32 600GB volumes evenly spread out across both controllers and disk groups. For SQL Server, we used an additional four 1.1TB volumes, two per controller to hold the VMs used for benchmarking. After data-reduction was accounted for, the total footprint used during our tests amounted to just under 50% utilization for each aggregate.
SQL Server Performance
StorageReview’s Microsoft SQL Server OLTP testing protocol employs the current draft of the Transaction Processing Performance Council’s Benchmark C (TPC-C), an online transaction processing benchmark that simulates the activities found in complex application environments. The TPC-C benchmark comes closer than synthetic performance benchmarks to gauging the performance strengths and bottlenecks of storage infrastructure in database environments.
Each SQL Server VM is configured with two vDisks: 100GB volume for boot and a 500GB volume for the database and log files. From a system resource perspective, we configured each VM with 16 vCPUs, 64GB of DRAM and leveraged the LSI Logic SAS SCSI controller. While our Sysbench workloads tested previously saturated the platform in both storage I/O and capacity, the SQL test looks for latency performance.
This test uses SQL Server 2014 running on Windows Server 2012 R2 guest VMs, and is stressed by Dell’s Benchmark Factory for Databases. While our traditional usage of this benchmark has been to test large 3,000-scale databases on local or shared storage, in this iteration we focus on spreading out four 1,500-scale databases evenly across our servers.
SQL Server Testing Configuration (per VM)
- Windows Server 2012 R2
- Storage Footprint: 600GB allocated, 500GB used
- SQL Server 2014
- Database Size: 1,500 scale
- Virtual Client Load: 15,000
- RAM Buffer: 48GB
- Test Length: 3 hours
- 2.5 hours preconditioning
- 30 minutes sample period
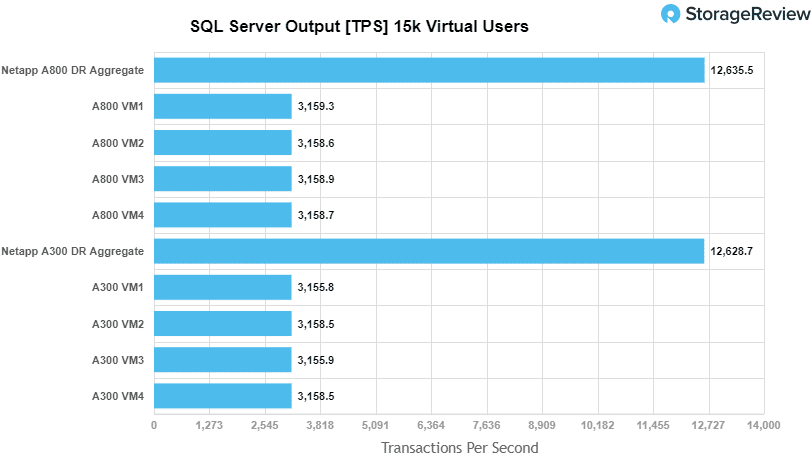
For our SQL Server transactional performance, the A800 had an aggregate score of 12,635.5 TPS with individual VMs running from 3,158.6 TPS to 3,159.3 TPS (a nice little uptick over the A300’s 12,628.7 TPS and the A200’s 12,583.8 TPS).
Looking at SQL Server average latency, we see a bigger improvement in the A800 as it dropped to 5ms aggregate and 5ms on all VMs (much better than the A300’s 8ms and the A200’s 25ms).

Sysbench MySQL Performance
Our first local-storage application benchmark consists of a Percona MySQL OLTP database measured via SysBench. This test measures average TPS (Transactions Per Second), average latency, and average 99th percentile latency as well.
Each Sysbench VM is configured with three vDisks: one for boot (~92GB), one with the pre-built database (~447GB), and the third for the database under test (270GB). From a system resource perspective, we configured each VM with 16 vCPUs, 60GB of DRAM and leveraged the LSI Logic SAS SCSI controller.
Sysbench Testing Configuration (per VM)
- CentOS 6.3 64-bit
- Percona XtraDB 5.5.30-rel30.1
- Database Tables: 100
- Database Size: 10,000,000
- Database Threads: 32
- RAM Buffer: 24GB
- Test Length: 3 hours
- 2 hours preconditioning 32 threads
- 1 hour 32 threads
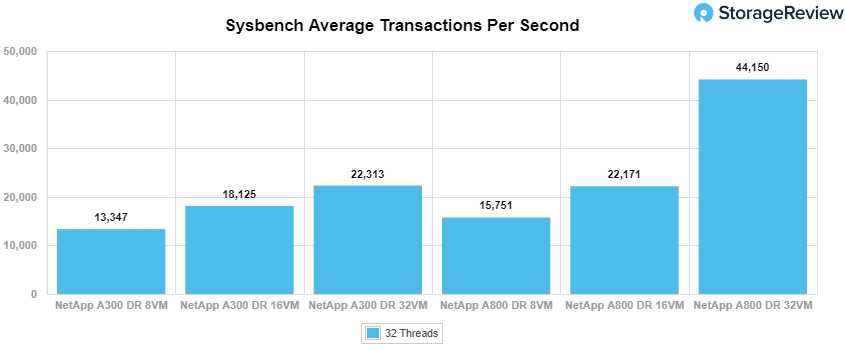
For Sysbench, we tested several sets of VMs including 8, 16, and 32, and we ran Sysbench with both the data reduction “On.” The A800 was able to hit 15,750.8TPS for 8VM, 22,170.9 TPS for 16VM, and 44,149.8 TPS for 32VM. These are much higher than the previous, nearly doubling what the A300 did with 32VM, 22,313 TPS.
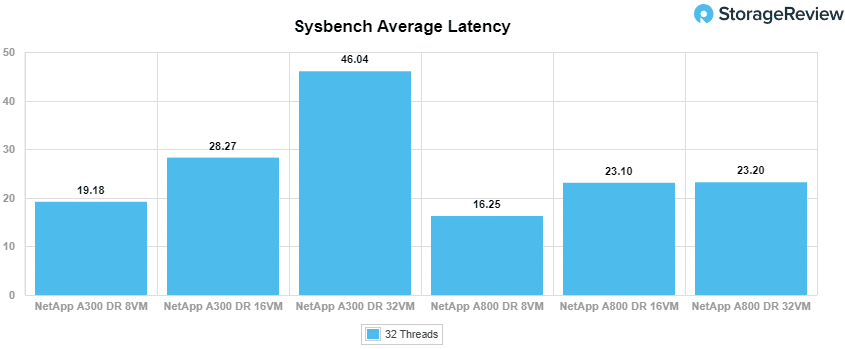
With Sysbench average latency, the A800 hit 16.3ms for 8VM, 23.1ms for 16VM, ad 23.2ms at 32VM. This is much better than the smaller AFF models.
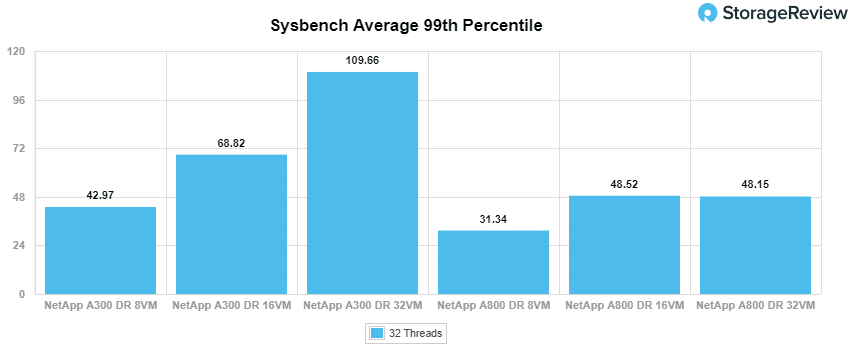
In our worst-case scenario (99th percentile) latency, the A800 hit 31.3ms for 8VM, 48.5ms for 16VM, 48.1ms for 32VM.
VDBench Workload Analysis
When it comes to benchmarking storage arrays, application testing is best, and synthetic testing comes in second place. While not a perfect representation of actual workloads, synthetic tests do help to baseline storage devices with a repeatability factor that makes it easy to do apples-to-apples comparison between competing solutions. These workloads offer a range of different testing profiles ranging from “four corners” tests, common database transfer size tests, as well as trace captures from different VDI environments. All of these tests leverage the common vdBench workload generator, with a scripting engine to automate and capture results over a large compute testing cluster. This allows us to repeat the same workloads across a wide range of storage devices, including flash arrays and individual storage devices.
Profiles:
- 4K Random Read: 100% Read, 128 threads, 0-120% iorate
- 4K Random Write: 100% Write, 64 threads, 0-120% iorate
- 64K Sequential Read: 100% Read, 16 threads, 0-120% iorate
- 64K Sequential Write: 100% Write, 8 threads, 0-120% iorate
- Synthetic Database: SQL and Oracle
- VDI Full Clone and Linked Clone Traces
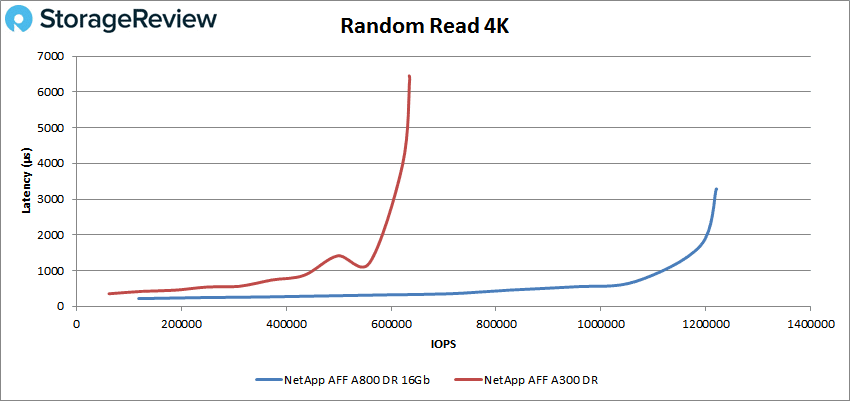
Starting with peak random 4K read performance, the A800 started at 118,511 IOPS with a latency of 217.5μs. The A800 stayed under 1ms until it hit about 1.07 million IOPS and went on to peak at 1,219.829 IOPS at a latency of 3.3ms. This was a marked difference compared to the A300’s peak performance of 635,342 IOPS with a latency of 6.4ms.
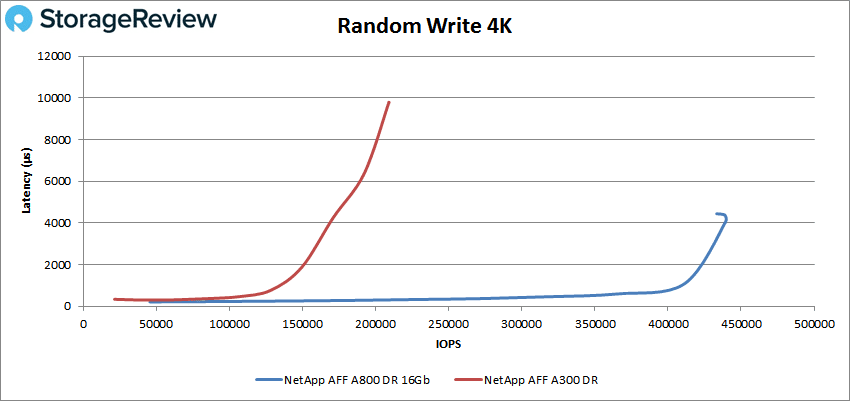
Looking at 4K write performance, the A800 started at 45,676 IOPS with a latency of 213.1μs. The A800 had sub-millisecond latency performance until about 410K IOPS and went on to peak at about 439K IOPS with 4.4ms latency before dropping off some. By contrast, the A300 had a peak performance of 208,820 IOPS with a latency 9.72ms.
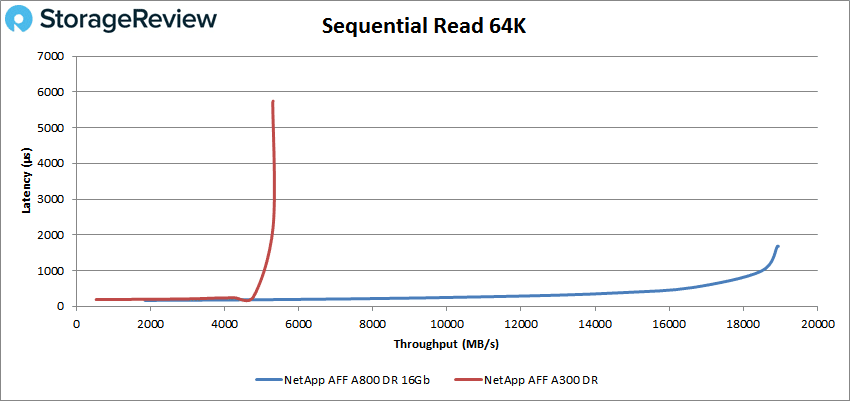
Switching over to sequential workloads, we look at peak 64K read performance, and here the A800 started at 29,589 IOPS or 1.85GB/s with a latency of 166.1μs. The A300 had sub-millisecond latency until about 300K IOPS or 18.5GB/s, going on to peak at 302,668 IOPS or 18.9GB/s at 1.7ms latency. The A300 peaked at about 84,766K IOPS or 5.71GB/s with 3.64ms latency before dropping off a bit.
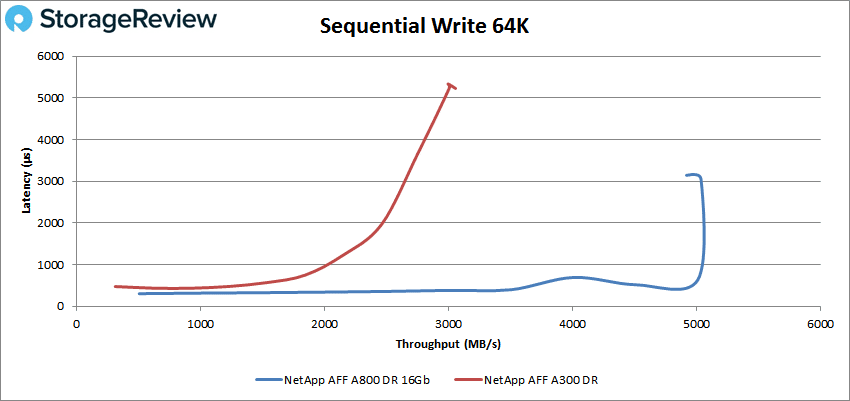
For 64K sequential write performance, the A800 started at 8,103 IOPS or 506.4MB/s with a latency of 304.8μs. The array stayed under 1ms until the end of its run or about 80K IOPS or 5GB/s, going on to peak at 80,536 IOPS or 5.03GB/s with a latency of 3.1ms. For peak performance, we saw the A300 hit 48,883 IOPS or 3.1GB/s at a latency of 4.8ms.
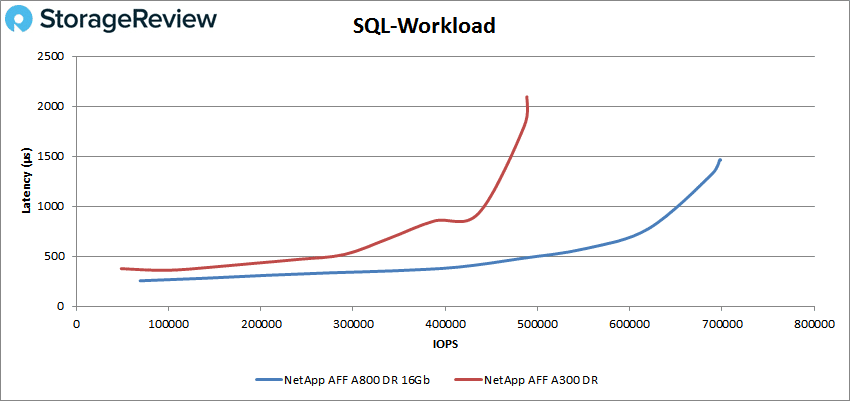
Our next batch of benchmarks are our SQL tests. In SQL the A800 started at 138,007 IOPS with 255.2μs latency and had sub-millisecond latency until about 650K IOPS, going on to peak at 697,603 IOPS at a latency of 1.5ms. This is compared to the A300’s peak of 488,488 IOPS with a latency of 2.1ms.
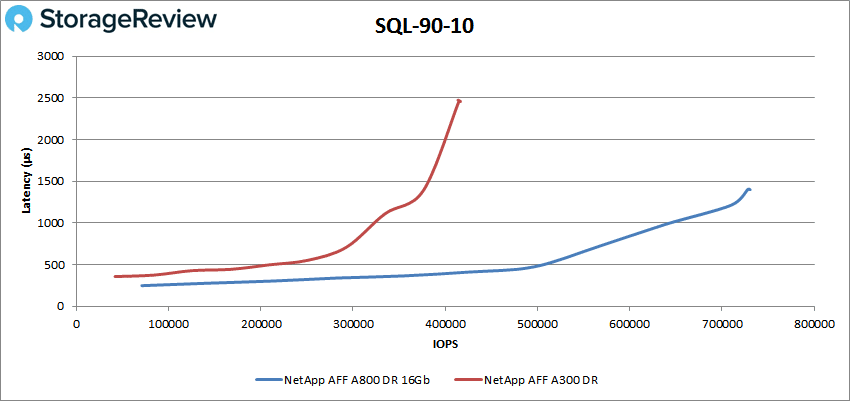
In SQL 90-10, the A800 started at 70,867 IOPS at a latency of 277.3μs and stayed under 1ms until about 640K IOPS, going on to peak at 730,567 IOPS with a latency of 1.4ms. The A300, on the other hand, had peak performance of 416,370 IOPS with a latency of 2.46ms
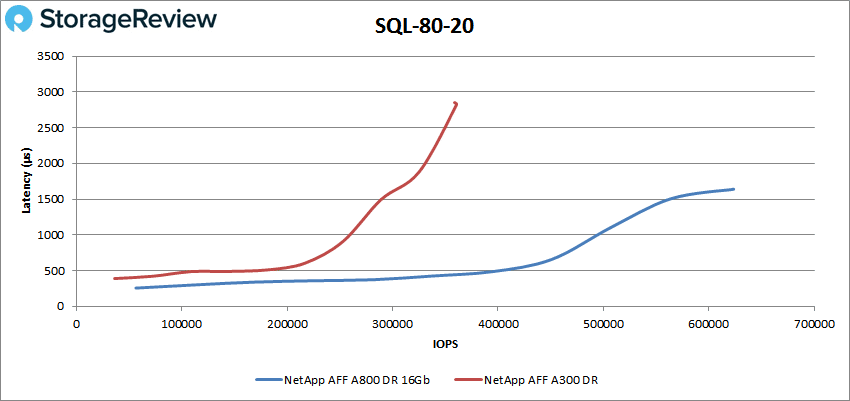
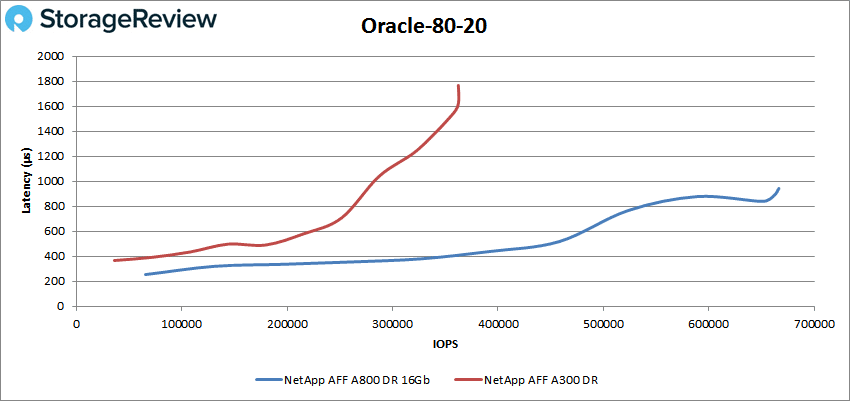
For SQL 80-20, the A800 started at 56,391 IOPS at a latency of 256.6μs with sub-millisecond latency up until about 480K IOPS. The A800 went on to peak at 623,557 IOPS with a latency of 1.6ms. This was about twice the A300’s 360,642 IOPS with 2.82ms latency.
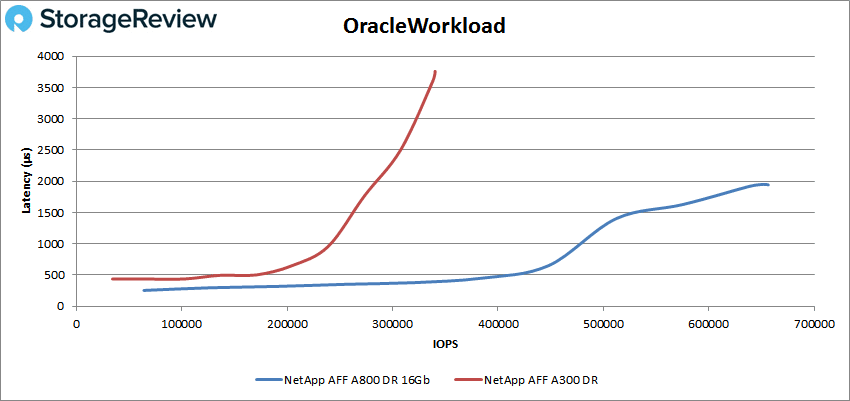
Moving on to our Oracle workloads, we saw the A800 start at 64,020 IOPS with 254.7μs latency, staying under 1ms until about 470K IOPS. The A800 peaked at 656,438 IOPS at a latency of 1.9ms. Again, the A800 had almost twice the performance of the A300’s score of 340,391 IOPS with a latency of 3.6ms.
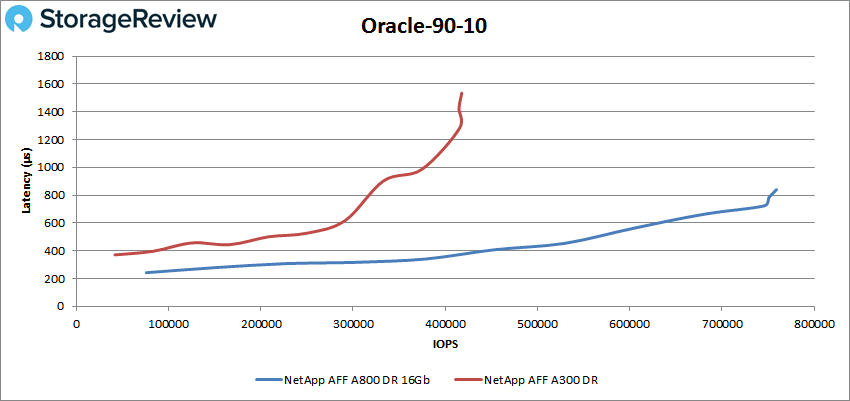
With the Oracle 90-10, the A800 started at 75,710 IOPS and 242.5μs latency. The array managed sub-millisecond latency performance throughout, peaking at 759,117 IOPS at 839.2μs latency–a big step up from the A300’s peak of 417,869 IOPS with a latency of 1.53ms.
With the Oracle 80-20, the A800 maintained sub-millisecond latency performance starting at 65,505 IOPS at 254.5μs latency and peaking at 666,556 IOPS at 943.1μs. The A300 peaked at 362,499 IOPS and a latency of 1.62ms.
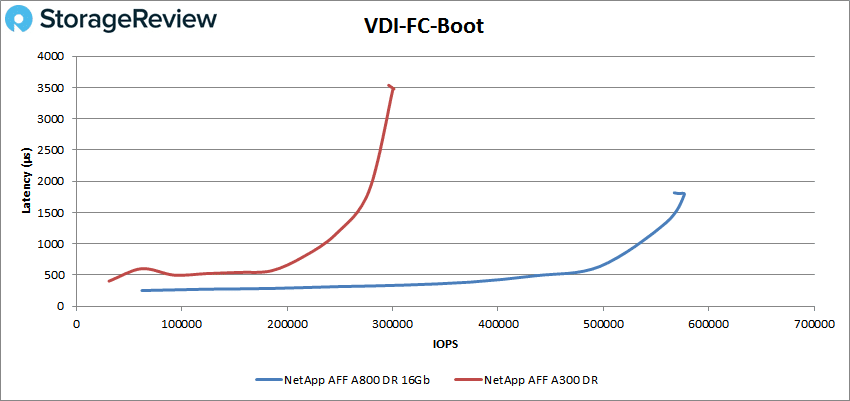
Next we switched over to our VDI Clone Test, Full and Linked. For VDI Full Clone Boot, the A800 had sub-millisecond latency until about 535K IOPS and went on to peak at 579,786 IOPS with a latency of 1.8ms. The A300 peaked at 300,128 IOPS with a latency of 3.46ms.
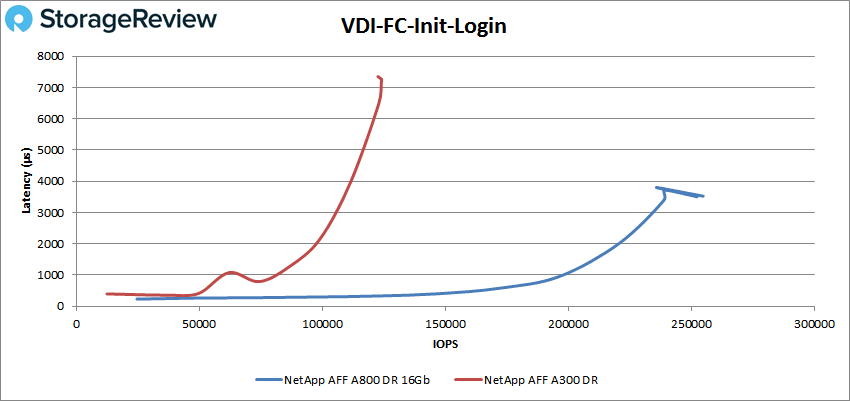
With the VDI Full Clone Initial Login, the A800 stayed under 1ms until about 200K IOPS and peaked at 254,888 IOPS with 3.5ms latency. This is contrasted with the A300 peaking at 123,984 IOPS with a latency of 7.26ms.
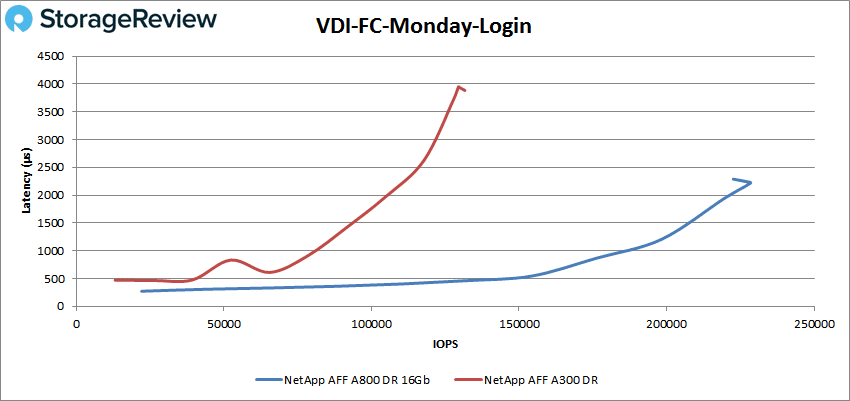
The VDI FC Monday Login showed the A800 with sub-millisecond latency performance until about 180K IOPS and a peak of 228,346 IOPS with a latency of 2.2ms. This was a big jump over the A300’s 131,628 IOPS with a latency of 3.89ms.
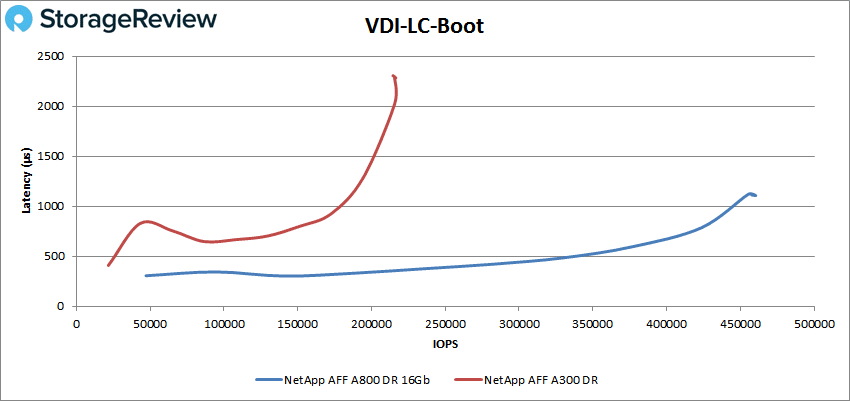
Switching over to the VDI Linked Clone (LC), in the boot test, the A800 had latency under 1ms nearly throughout, breaking the 1ms barrier at about 440K IOPS and peaking at 460,366 IOPS with a latency of 1.1ms. The A300 peaked at 215,621 IOPS with a latency of 2.28ms.
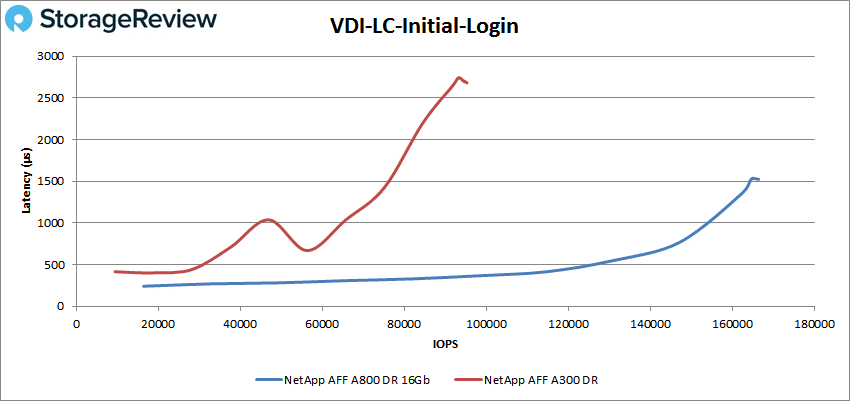
In VDI LC Initial Login, the A800 again had a long run of sub-millisecond latency until about 158K IOPS, peaking at 166,224 IOPS at a latency of 1.5ms. This is compared to the A300’s peak of 95,296 IOPS with a latency of 2.68ms.
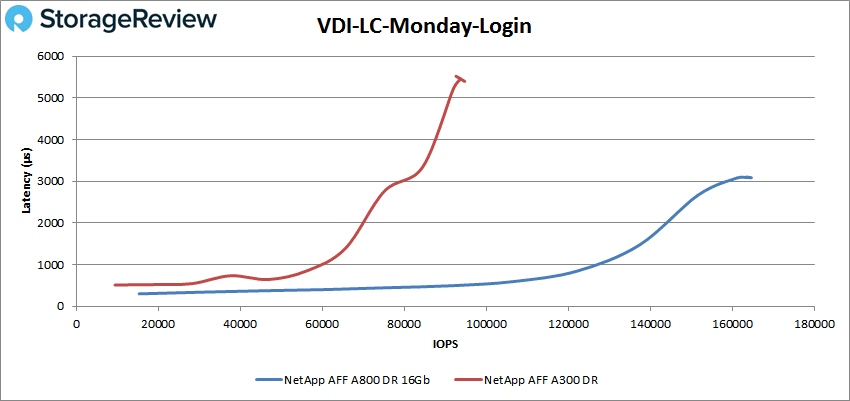
Finally, we look at VDI LC Monday Login where the A800 started at 15,287 IOPS at a latency of 299.3μs. The array stayed under 1ms until about 130K IOPS and peaked at 164,684 IOPS at a latency of 3.1ms. The A300 peaked at 94,722 IOPS with a latency of 5.4ms
Conclusion
The NetApp AFF A800 is a 4U, all-flash storage array that is all about top performance. The A800 comes with all NVMe flash and is aimed towards the most demanding workloads. Aside from supporting all NVMe (and NVMe SSDs up to 15.3TB in capacity each), the AFF A800 also has optional 100GbE connectivity for when performance is an absolute must. According to NetApp, the AFF A800 should be able to hit 1.4 million IOPS at sub 500μs latency. As with other NetApp arrays in the A-series, the A800 is powered by ONTAP.
For performance, we ran both our Application Analysis Workloads, consisting of SQL Server and Sysbench, as well as our VDBench workloads. For our Application Workload analysis, the A800 had transactional SQL Server scores of 12,835.5 TPS in aggregate and average latency of 5ms. This was a big step up in performance from the A300’s 12,628.7 TPS and average latency of 8ms. With Sysbench, the A800 gave us 15,750.8TPS for 8VM, 22,170.9 TPS for 16VM, and 44,149.8 TPS for 32VM, with average latencies of 16.3ms for 8VM, 23.1ms for 16VM, and 23.2ms for 32VM, and worst-case scenario latencies of 31.3ms for 8VM, 48.5ms for 16VM, and 48.1ms for 32VM. In some cases, the A800 was able to double the TPS while cutting the latency roughly in half.
For our VDBench workloads, the NetApp AFF A800 continued to shine. Highlights include 1.2 million IOPS in 4K read, 439K IOPS in 4K write, 18.9GB/s in sequential 64K read, and 5.03GB/s in 64K write. All of these numbers were hit at under 5ms latency. In our SQL testing, the array hit 698K IOPS, 731K IOPS in SQL 90-10, and 624K IOPS in SQL 80-20. In Oracle, the A800 hit 656K IOPS and in both Oracle 90-10 and Oracle 80-20, the array had sub-millisecond latency throughout with peak scores of 759K IOPS and 667K IOPS, respectively. In our VDI Clone tests, the A800 was able to hit boot scores of 580K IOPS for Full Clone and 460K IOPS for Linked Clone. The highest peak latency throughout any of our testing was only 4.4ms.
Like the midmarket ONTAP systems we’ve reviewed previously, NetApp once again hits it out of the park with the enterprise focused A800. The performance profile is very strong, taking its position at the top of the ONTAP family. As noted, this testing is the garden variety Fibre Channel work; we have yet to peel back what is available in the NVMeoF configuration, which should be good fun. When looking at hardware for review, there’s at times a niggling concern that older storage vendors aren’t as fast and flexible as the startups and “legacy code” can’t keep pace. We’re seeing no signs of these issues anywhere in the NetApp portfolio, and further, the A800 embraces NVMe and NVMeoF in ways that are practical for the enterprise without sacrificing the data protection and availability features inherent in ONTAP for years. NetApp has a great handle on NVMe in the A800, we’re enthusiastic to see how these learning’s find their way throughout their other arrays.


 Amazon