

Around this time last year, NetApp introduced several new offerings into its Big Data analytics portfolio. Among the offerings announced was the company's latest all-flash array (AFA), the NetApp EF570. The EF570 is a midrange AFA that is designed for high performance, high availability, simplicity, and a strong price-to-performance ratio for a 2U system.
NetApp states that the EF570 has “extreme” performance, and though we’re not ones for hyperbole, the company quotes some very impressive numbers. NetApp states that the array can hit upwards of one million IOPS and sequential bandwidth of 21GB/s, all with sub-100 microsecond latency. All of this performance is geared specifically for mixed-workload environments, including Big Data analytics. On top of the promised performance, the array supports several high-speed host interfaces including 32Gb Fibre Channel, 25Gb iSCSI, 100Gb InfiniBand, 12Gb SAS, and 100Gb NVMe over InfiniBand. Not only will this help hit the quoted speeds, it will also help to protect storage network investments moving forward.
Like several other NetApp systems, high availability is a built-in facet; here, the EF570 is no different. The array has no single point of failure and comes with fully redundant I/O paths and automated failover. It also comes with a reported six 9's of availability. With these features, the EF570 also offers the usual suspects of data management including snapshots, volume copy and mirroring. Meanwhile the SANtricity OS assures data integrity while protecting from silent data corruption. The array is able to detect and resolve most issues through background monitoring and extensive diagnostic data and analysis.
The NetApp EF570 comes in a modular design and is easy to scale. A 2U system can support up to 367TB of capacity and adding the four expansion shelves can bring total capacity up to 1.8PB. Through the SANtricity GUI, users can scale without added management complexity and access their data in less than 10 minutes. This ease of scale and high capacity gives the EF570 a strong price-to-performance ratio. The ability to scale to 1.8PB also makes the array an attractive choice that can help avoid forklift upgrades in the future.
NetApp EF570 Specifications
| Form factor | 2U |
| System memory max | 128GB |
| Maximum drives (with expansion) | 120 |
| Maximum capacity | 1.8PB |
| Drive types supported | 2.5” SSD 800GB, 1.6TB, 3.2TB, 15.3TB, 1.6TB FIPS encryption |
| Host I/O Ports | |
| Base ports |
|
| Optional add-on ports |
|
| OS and Management | SANtricity System Manager 11.40 or higher |
| Performance | |
| IOPS | Up to 1M |
| Sustained throughput | Up to 21GB/s |
| Average Latency |
|
| Physical | |
| Dimensions (HxWxD) | 3.47 x 19 x 19.27 in (8.81 x 48.26 x 48.95 cm) |
| Weight | 51.63lb (23.42kg) |
| Power and cooling | |
| kVA |
|
| Watts |
|
| BTU |
|
Design and Build
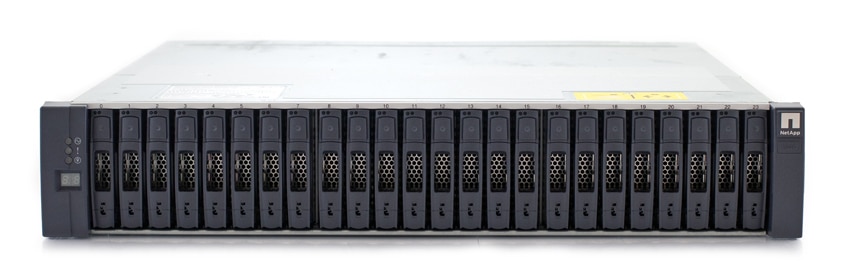
As stated, the EF570 is a 2U AFA. Like the vast majority of NetApp products (at least the more recent ones), the bezels look the same with a stylish bare metal cover and ventilation and NetApp branding on the left side. Beneath the bezel are the twenty-four 2.5” drive bays running vertical across the front of the array. The right side of the array has NetApp branding and the left has the Power, Attention, and Locate buttons and LEDs.
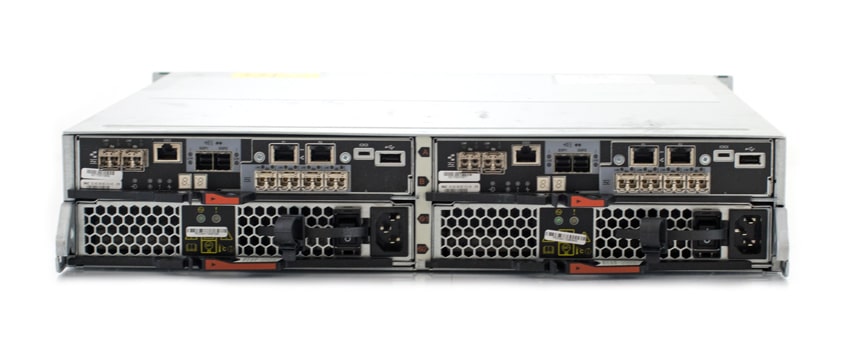
Flipping around to the rear of the device, one can clearly see the high availability/redundant design. The array is a mirror image from left to right. The bottom is filled with the PSUs. The top half has the two controllers. The controllers were configured with quad-port 32Gb HICs (Host Interface Cards), leveraging two ASICs per controller. The on-board FC ports were not used, which would provide one additional ASIC path per controller. For our testing, we used a best-practices layout across dual 32Gb switches.
Management
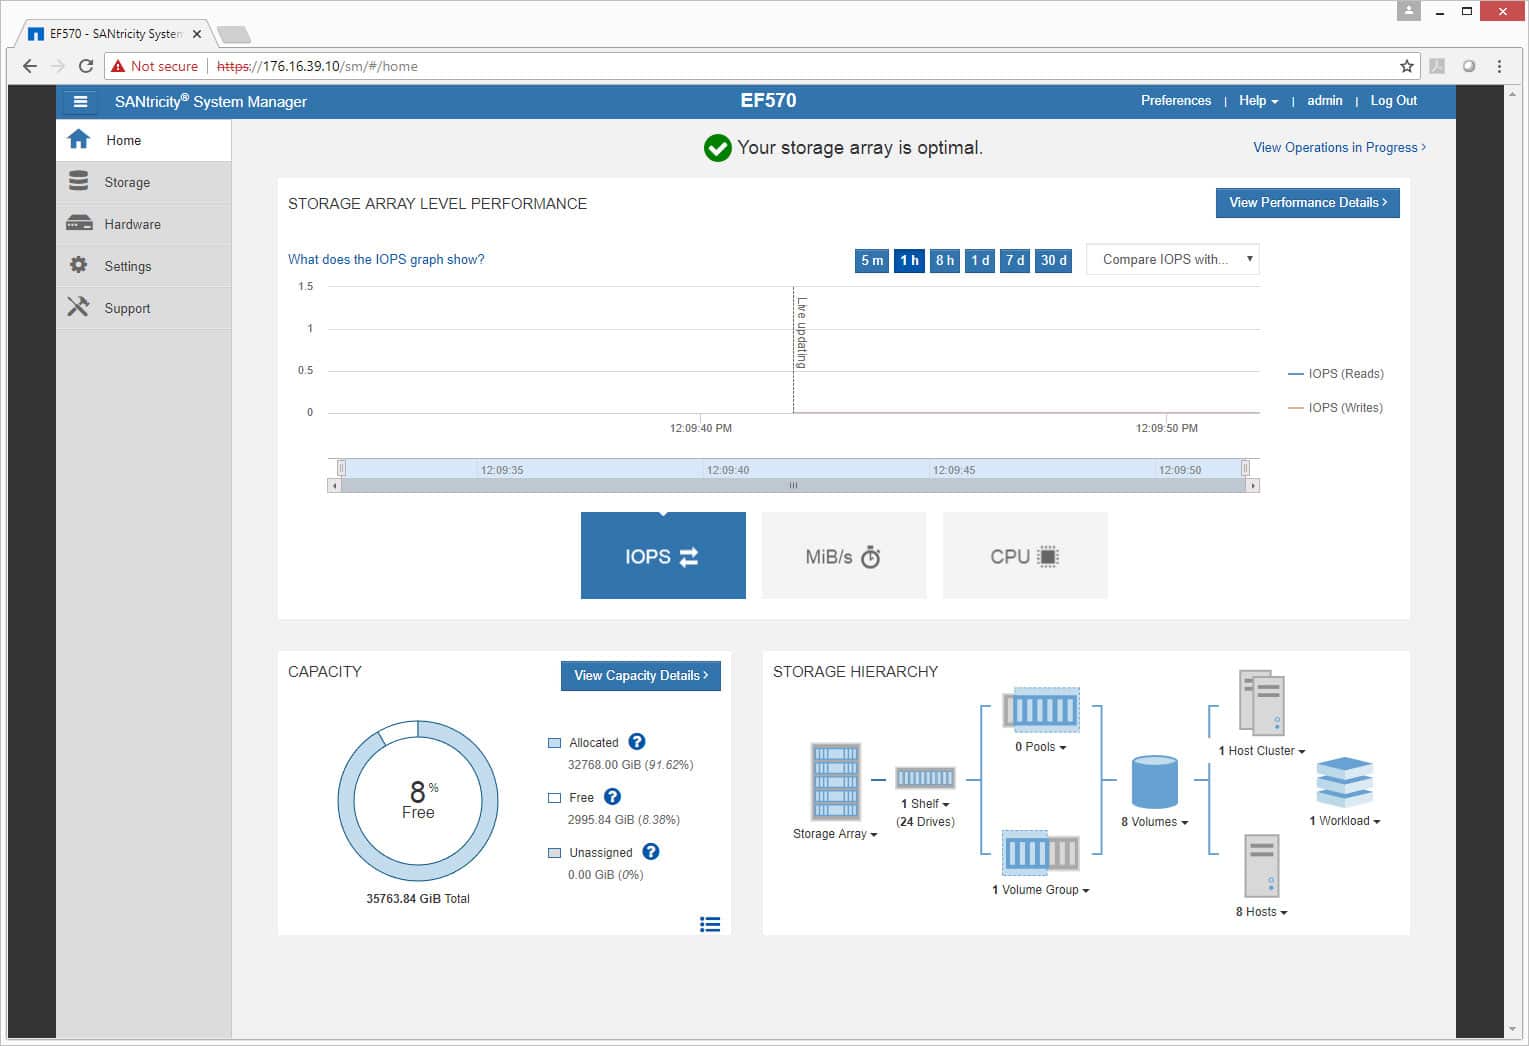
In our previous NetApp reviews we looked at the company’s ONTAP operating system. While ONTAP is the more popular and well-known OS, the EF–Series is actually powered by SANtricity OS.
SANtricity’s home screen gives admins a layout of the entire system. One is easily able to see performance (that can be broken down to IOPS, MB/s, and CPU or looked at by different time frames), capacity, as well as storage hierarchy. Along the left side of the screen are tabs: Home, Storage, Hardware, Settings, and Support.
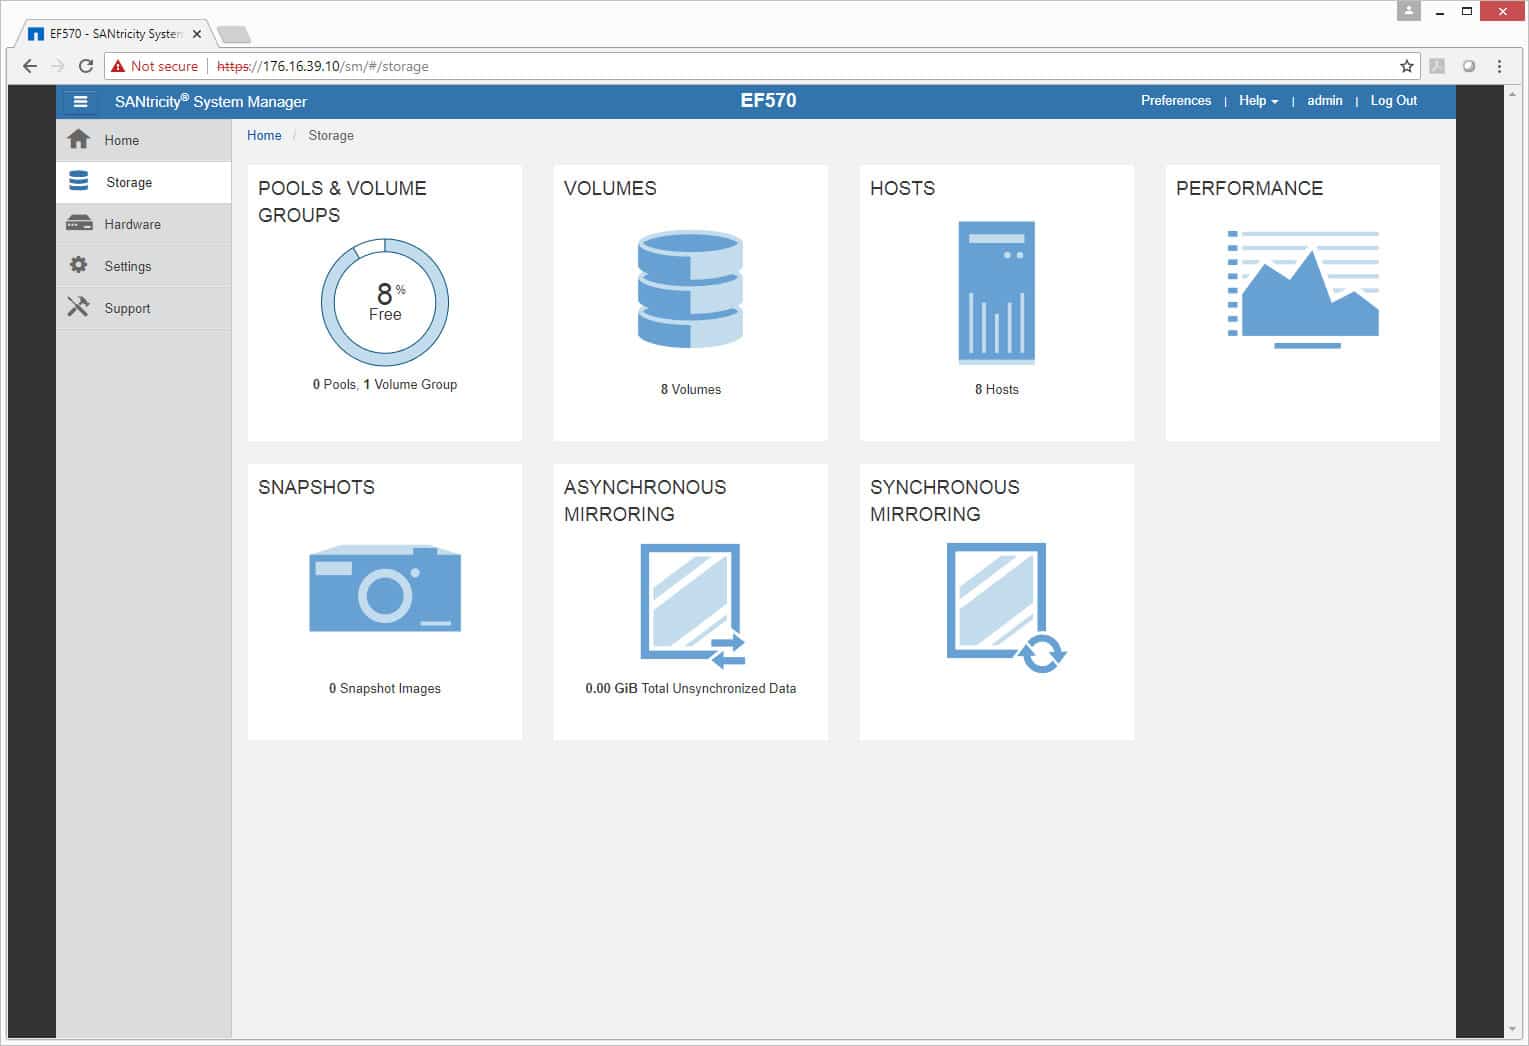
Under the Storage main tab, there are several options to choose from for drilling down into what one’s storage is doing including: Pools & Volume Groups, Volumes, Hosts, Performance, Snapshots, Asynchronous Mirroring, and Synchronous Mirroring.
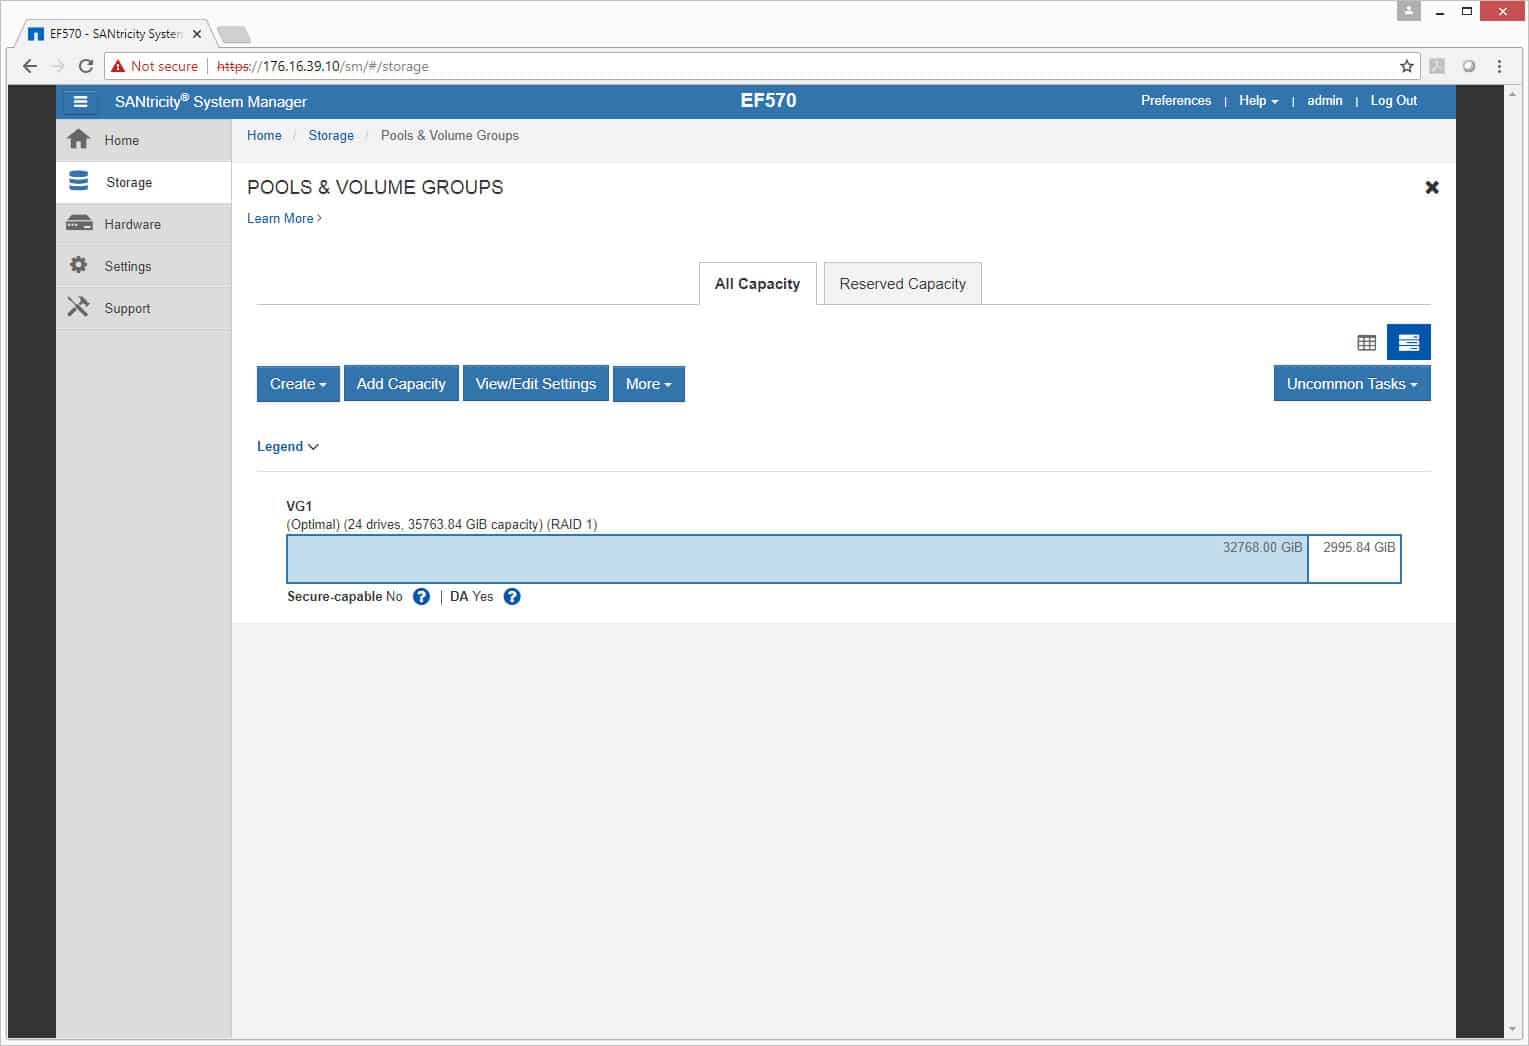
Clicking on Pools & Volume Groups, we are able to look at either all capacity or reserved capacity. From there, users can create new pools or volume groups, add capacity to them, or edit them.
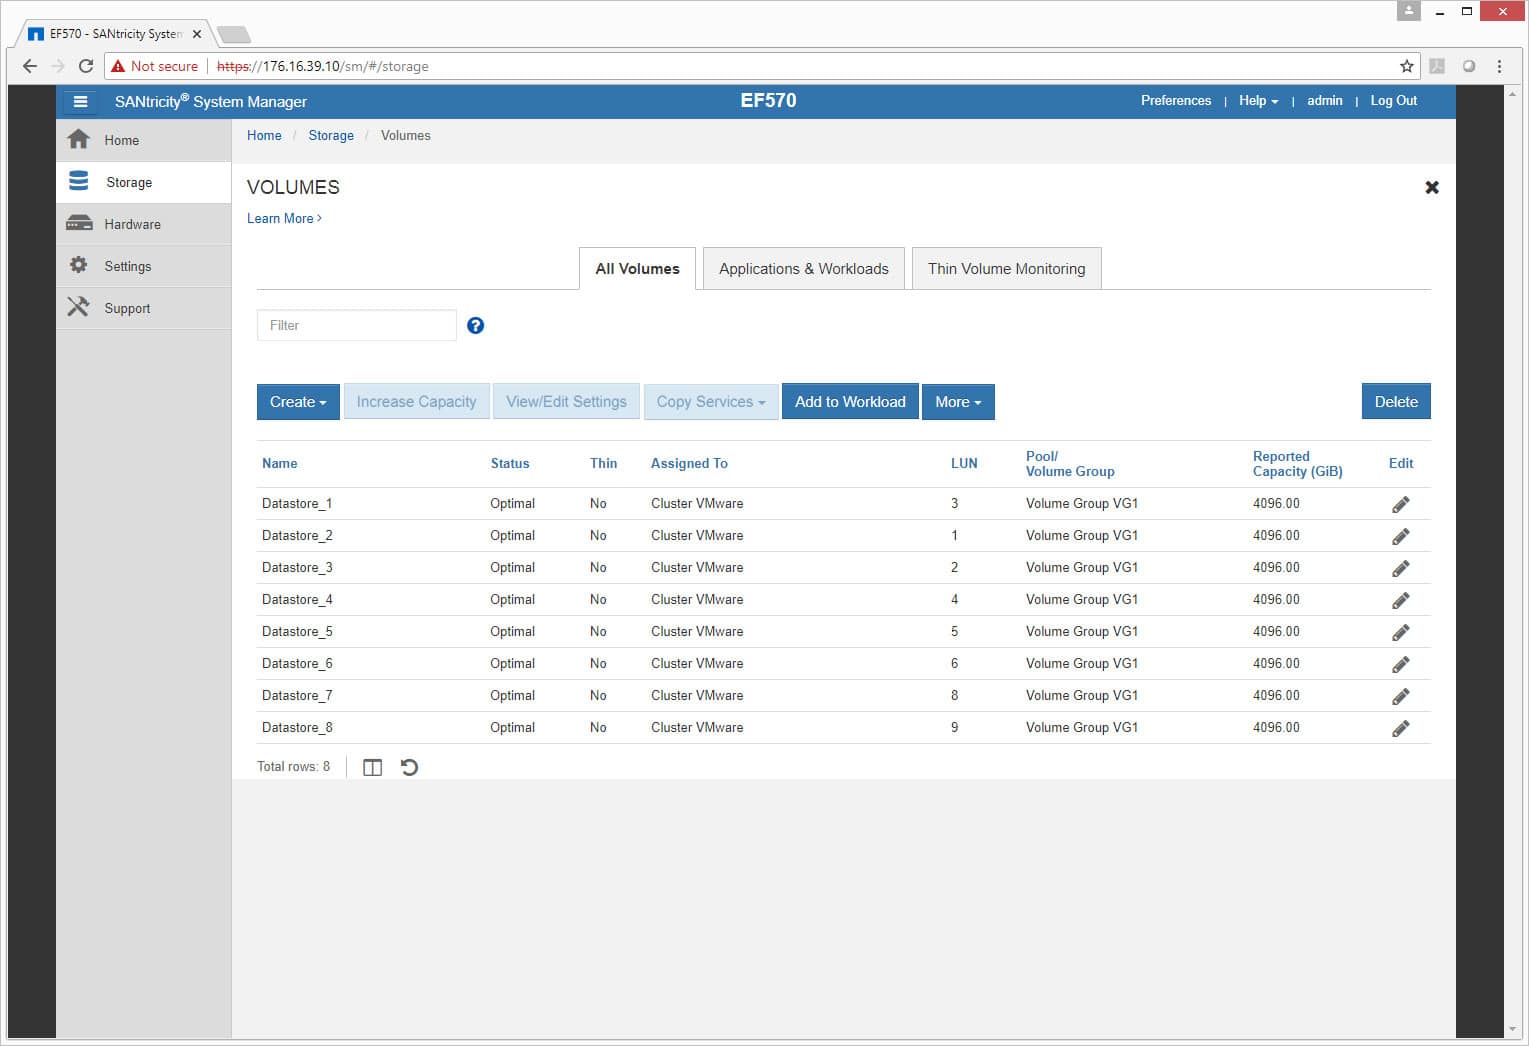
Under Volume, users can create or edit volumes as well as get information about current volumes such as the name, status, whether thin provisioning is enabled, where they’re assigned, how many LUNs, which Pool or Volume group they belong to, and the capacity.
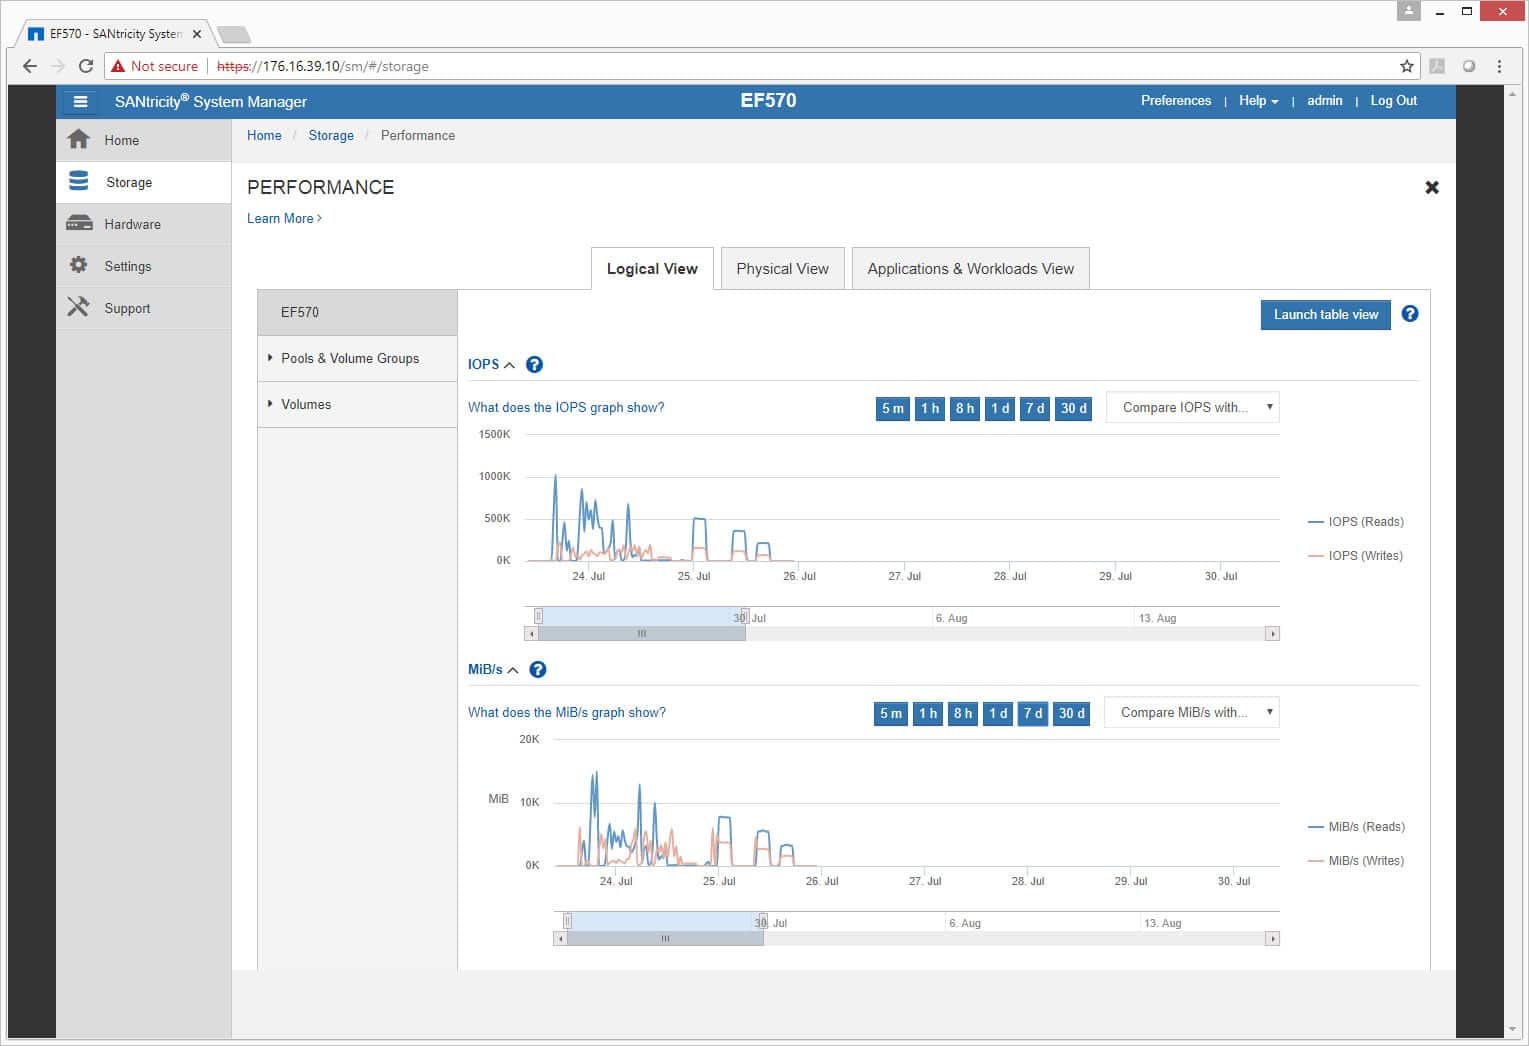
Performance is something that is always interesting to us, and for admins that want to know how well their storage is performing, they can check through the performance section under storage. Here, users are given a few different performance views based on certain metrics and it can be viewed as a logical view, physical view, or applications and workloads view. There is an also option to drill down from the whole AFA to pools and volume groups or just volumes.
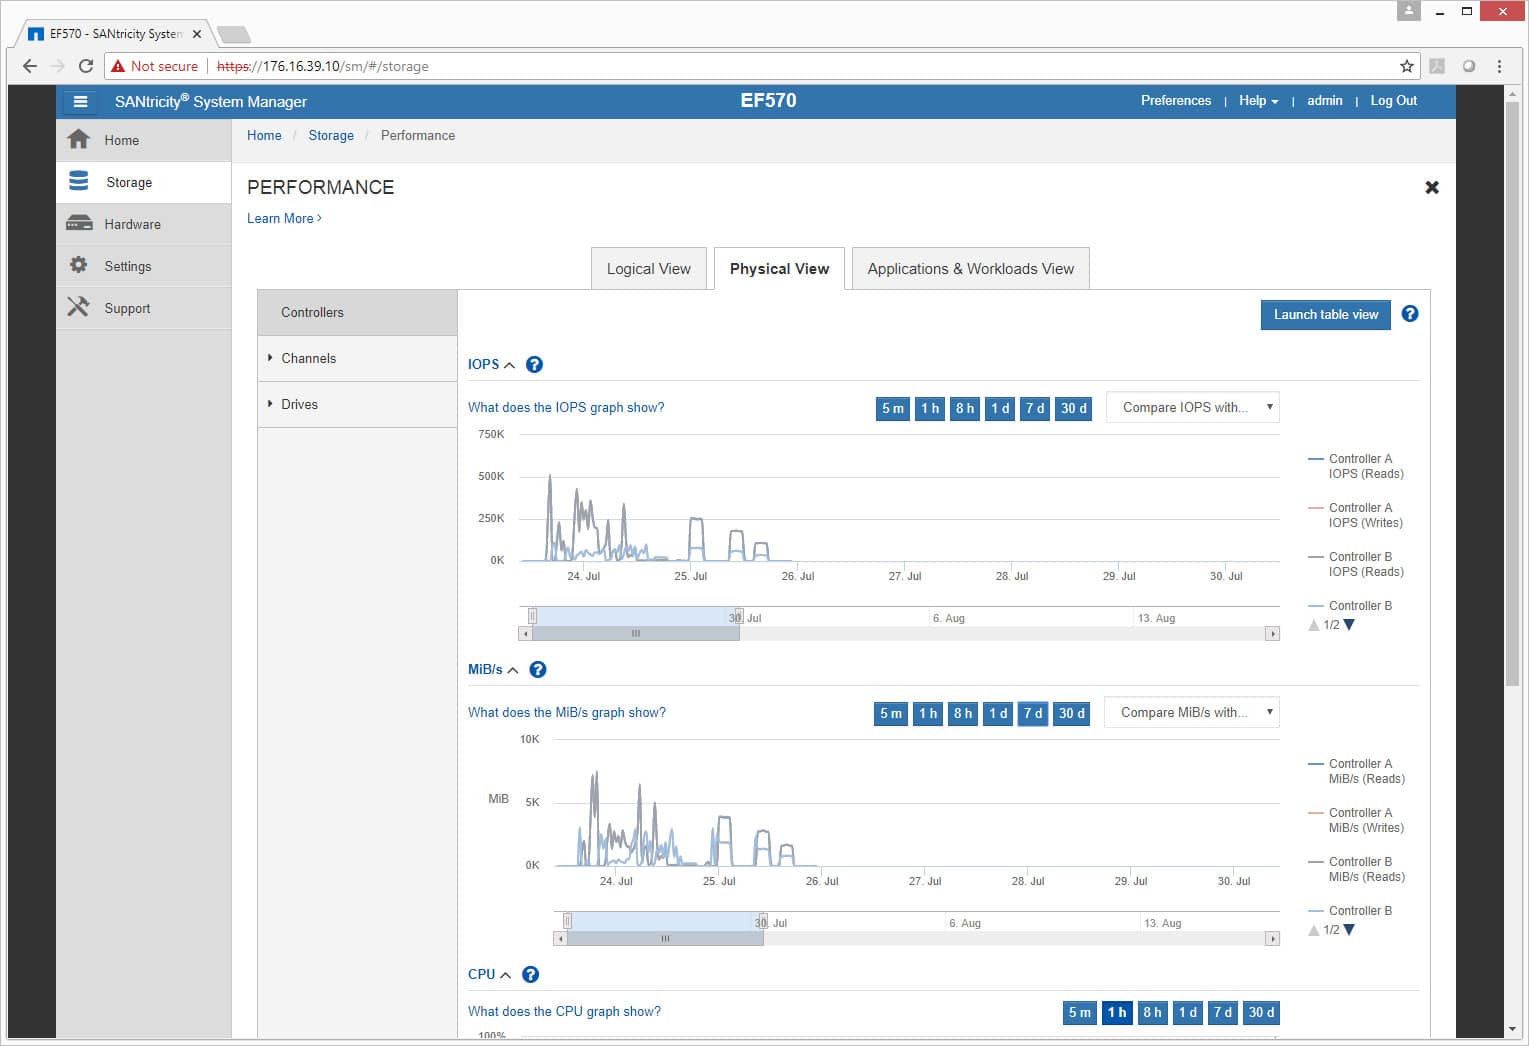
Drilling down into physical performance, there is an option to see the performance on controllers, channels, or drives.
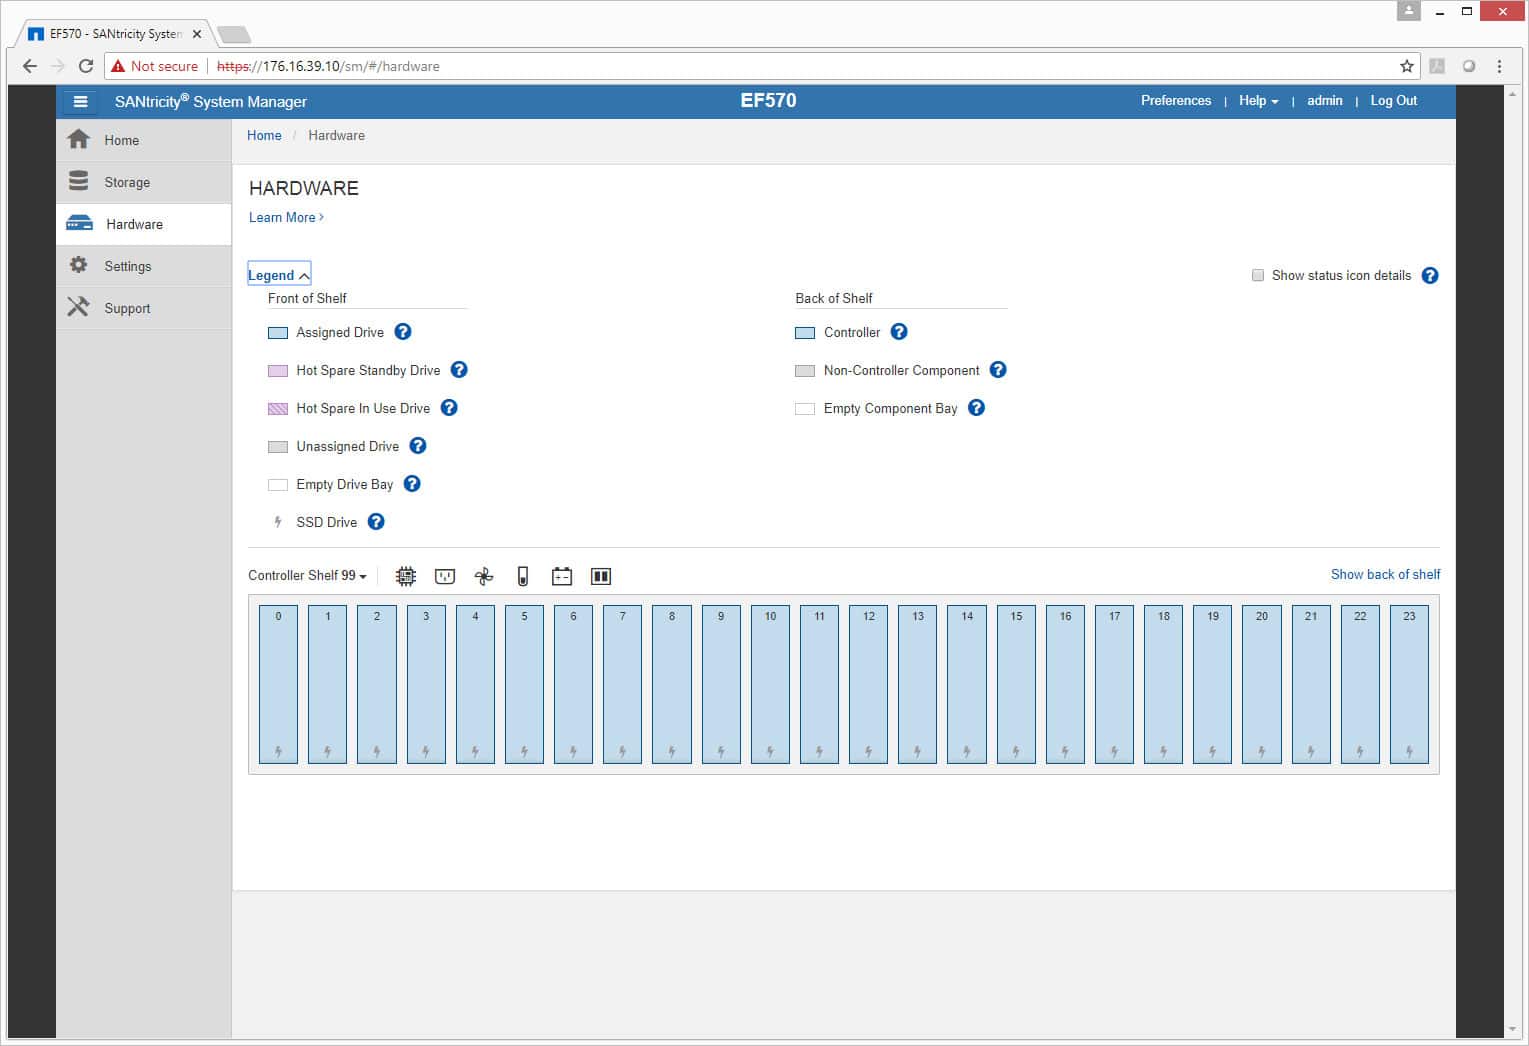
The Hardware tab shows, as expected, hardware and how it is running. On the front side, users can check on the drives to see if everything is running normally and whether or not something needs to be swapped out (indicated by color, blue being normal).
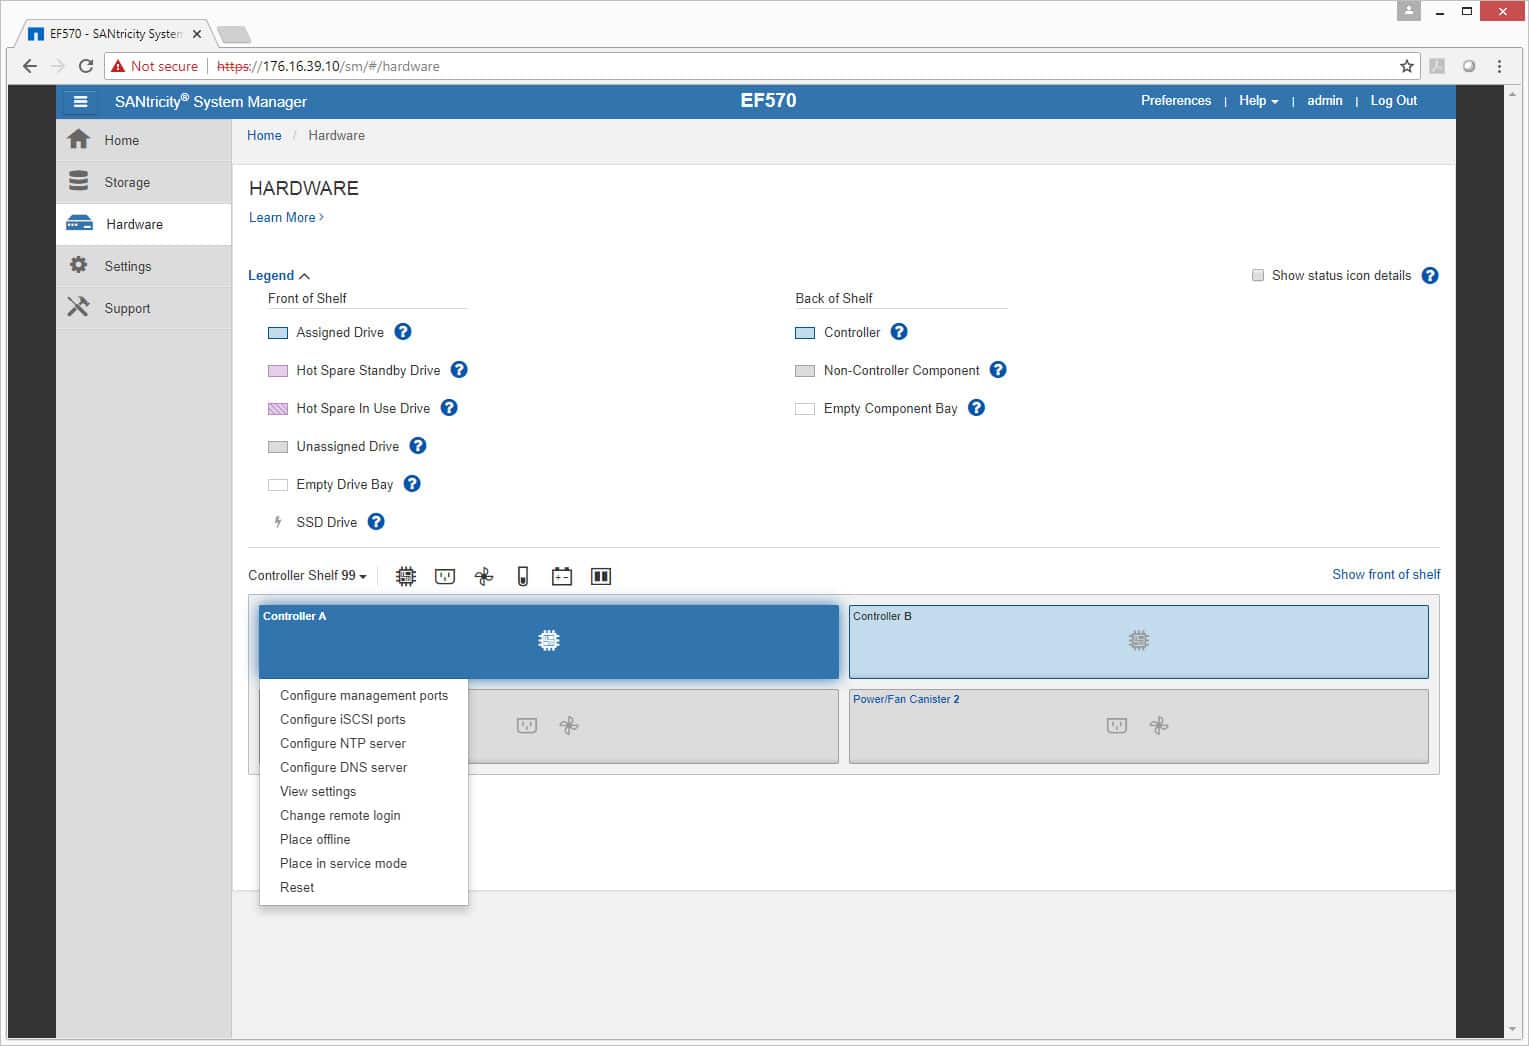
The rear of the hardware is similar, only this time controllers and PSUs are color-coded to ensure that they are running properly or need to be addressed.
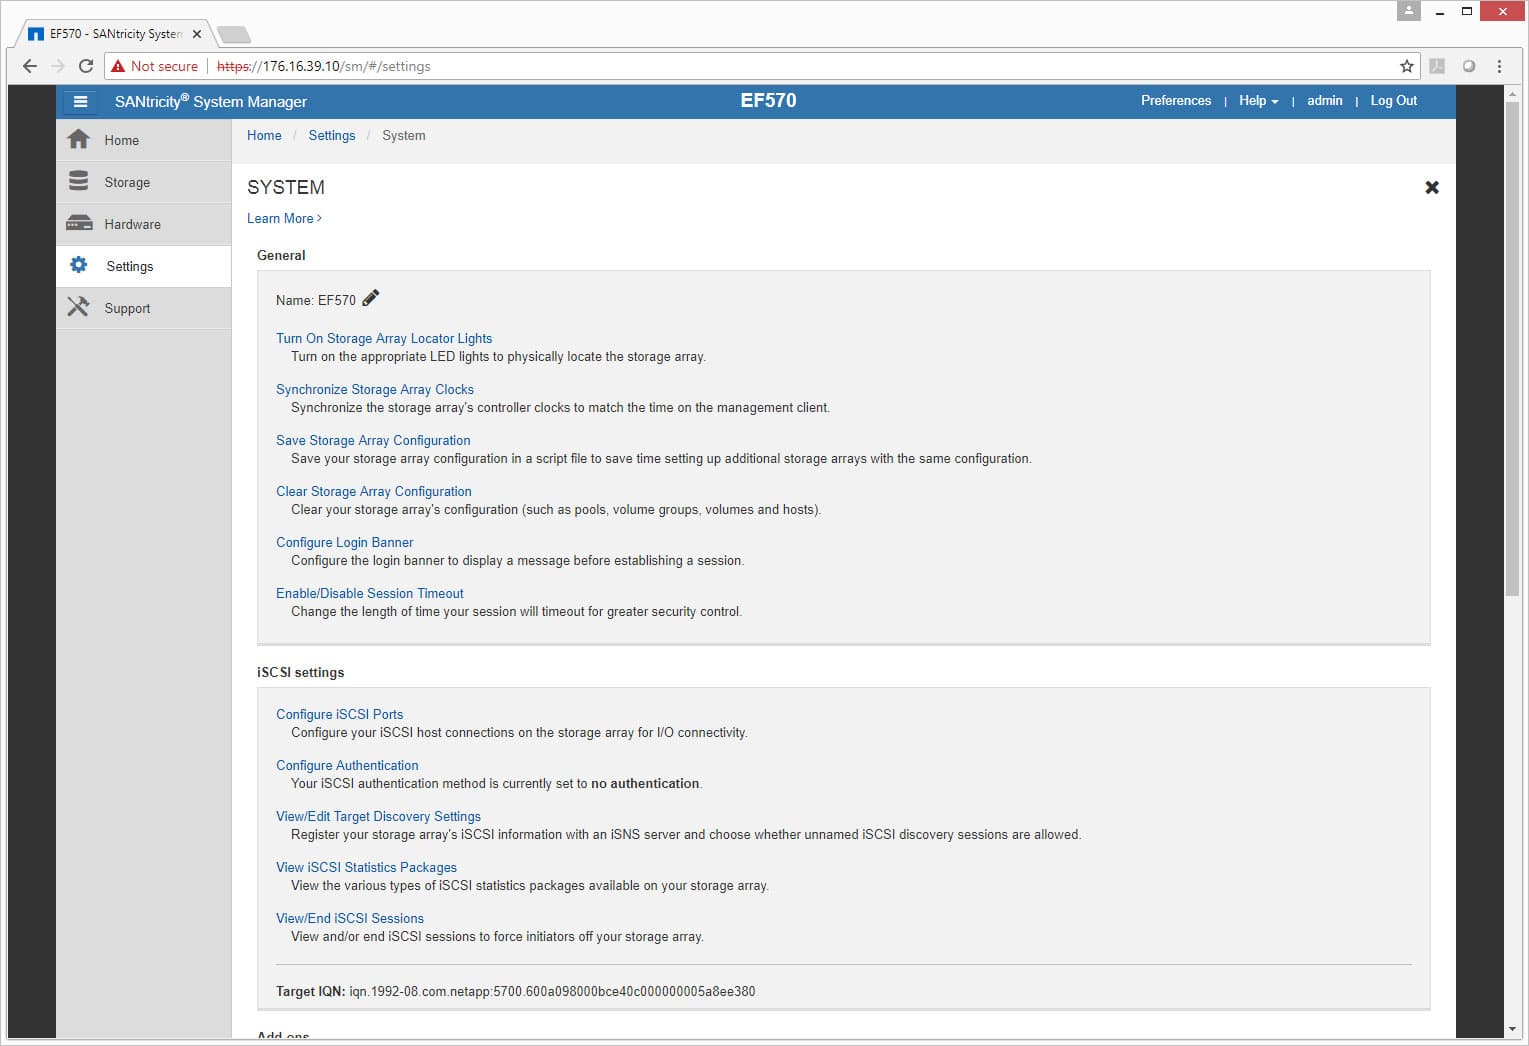
The Settings tab displays general information about the system and iSCSI settings or other settings users would like to add. There are also various configuration options under this tab as well.
Performance
Application Workload Analysis
The application workload benchmarks for the NetApp EF570 consist of the MySQL OLTP performance via SysBench and Microsoft SQL Server OLTP performance with a simulated TPC-C workload. In each scenario, we had the array configured with 26 Toshiba PX04SV SAS 3.0 SSDs, and configured in two 12-drive RAID10 disk groups, one pinned to each controller. This left 2 SSDs as spares. Two 5TB volumes were then created, one per disk group. In our testing environment, this created a balanced load for our SQL and Sysbench workloads.
SQL Server Performance
Each SQL Server VM is configured with two vDisks: 100GB volume for boot and a 500GB volume for the database and log files. From a system resource perspective, we configured each VM with 16 vCPUs, 64GB of DRAM and leveraged the LSI Logic SAS SCSI controller. While our Sysbench workloads tested previously saturated the platform in both storage I/O and capacity, the SQL test is looking for latency performance.
This test uses SQL Server 2014 running on Windows Server 2012 R2 guest VMs, and is stressed by Quest's Benchmark Factory for Databases. While our traditional usage of this benchmark has been to test large 3,000-scale databases on local or shared storage, in this iteration we focus on spreading out four 1,500-scale databases evenly across the NetApp EF570 (two VMs per controller).
SQL Server Testing Configuration (per VM)
- Windows Server 2012 R2
- Storage Footprint: 600GB allocated, 500GB used
- SQL Server 2014
- Database Size: 1,500 scale
- Virtual Client Load: 15,000
- RAM Buffer: 48GB
- Test Length: 3 hours
- 2.5 hours preconditioning
- 30 minutes sample period
SQL Server OLTP Benchmark Factory LoadGen Equipment
- Dell EMC PowerEdge R740xd Virtualized SQL 4-node Cluster
- 8 Intel Xeon Gold 6130 CPU for 269GHz in cluster (Two per node, 2.1GHz, 16-cores, 22MB Cache)
- 1TB RAM (256GB per node, 16GB x 16 DDR4, 128GB per CPU)
- 4 x Emulex 16GB dual-port FC HBA
- 4 x Mellanox ConnectX-4 rNDC 25GbE dual-port NIC
- VMware ESXi vSphere 6.5 / Enterprise Plus 8-CPU
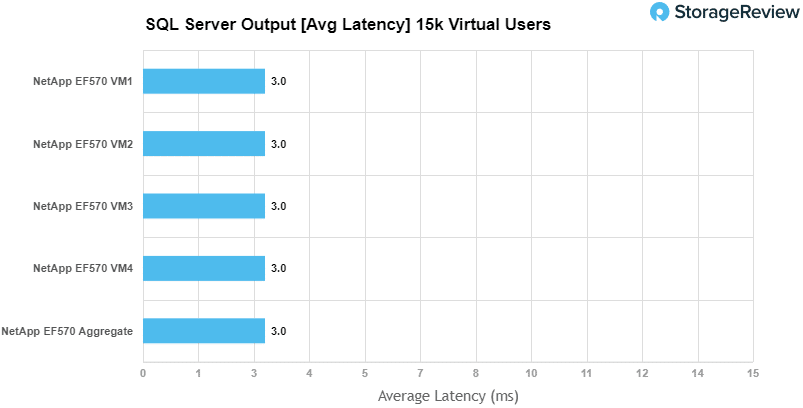
For SQL Server, the NetApp EF570 performed in a fast and consistent manner, measuring 3,160 TPS and change across all four VMs, giving us an aggregate of 12,642.245 TPS.

Looking at latency, all VMs performed with a consistent 3ms response time.
Sysbench Performance
Each Sysbench VM is configured with three vDisks, one for boot (~92GB), one with the pre-built database (~447GB), and the third for the database under test (270GB). From a system-resource perspective, we configured each VM with 16 vCPUs, 60GB of DRAM and leveraged the LSI Logic SAS SCSI controller. Load gen systems are Dell R740xd servers.
Dell PowerEdge R740xd Virtualized MySQL 4 node Cluster
- 8 Intel Xeon Gold 6130 CPU for 269GHz in cluster (two per node, 2.1GHz, 16-cores, 22MB Cache)
- 1TB RAM (256GB per node, 16GB x 16 DDR4, 128GB per CPU)
- 4 x Emulex 16GB dual-port FC HBA
- 4 x Mellanox ConnectX-4 rNDC 25GbE dual-port NIC
- VMware ESXi vSphere 6.5 / Enterprise Plus 8-CPU
Sysbench Testing Configuration (per VM)
- CentOS 6.3 64-bit
- Storage Footprint: 1TB, 800GB used
- Percona XtraDB 5.5.30-rel30.1
- Database Tables: 100
- Database Size: 10,000,000
- Database Threads: 32
- RAM Buffer: 24GB
- Test Length: 3 hours
- 2 hours preconditioning 32 threads
- 1 hour 32 threads
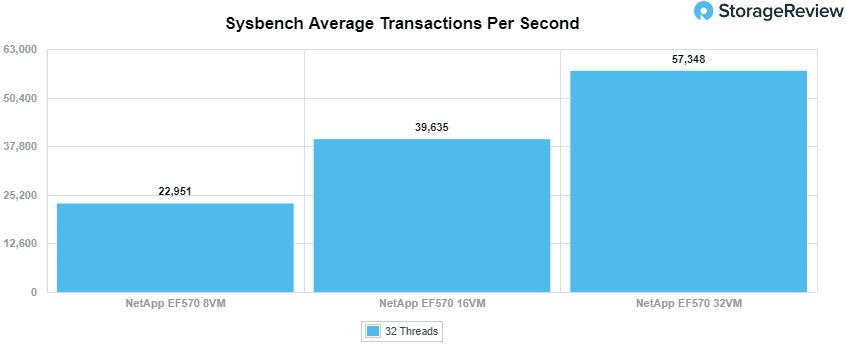
For Sysbench, we tested several sets of VMs, including 8, 16 and 32 VMs. The purpose of these tests is to show how well a given array performs under a moderate- to full-saturation workload. Not all reviews knock our socks off when it comes to performance results, but the NetApp EF570 did just that. At an 8VM load, the EF570 measured 22,951 TPS, surpassing most arrays at their peak. Picking up to 16VMs, the EF570 showed no signs of slowing down, ramping up to an incredible 39,635 TPS. At 32VMs, though, the EF570 was just a monster, peaking up to 57,347 TPS, and stopping not for lack of I/O, but completely saturating the CPUs across our 8 hosts. To say the EF570 is quick is putting it mildly; its a monster.
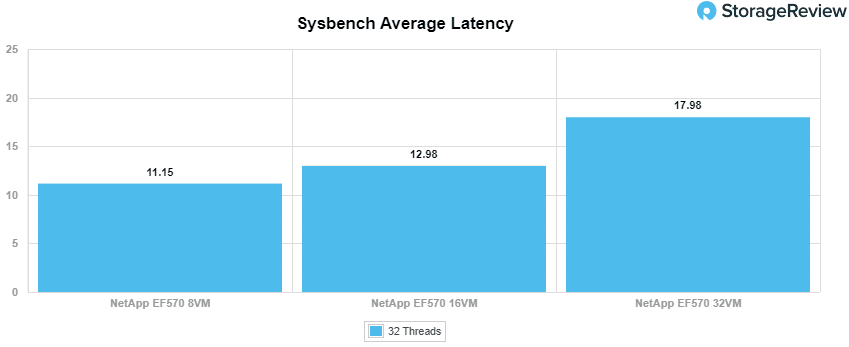
Looking at average latency across our 8, 16, and 32VM workloads, the NetApp EF570 continued to impress us. At 8VMs, it measured a low 11.15ms, increasing when the load picked up to 16VMs to just 12.98ms. At 32vms, where most arrays start to lose steam, the EF570 picked up to just 17.98ms.
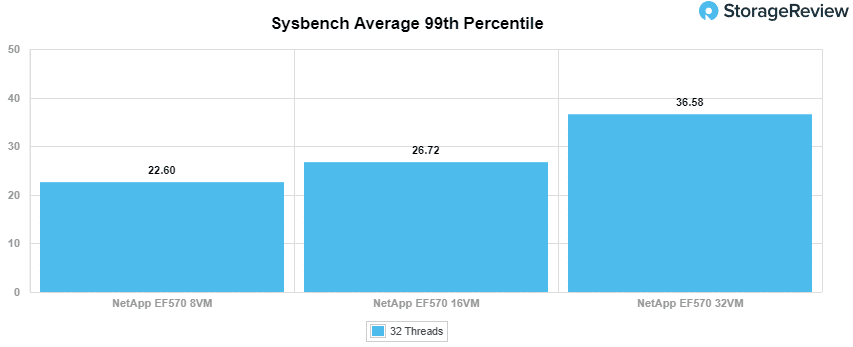
Looking at 99th percentile latency, the NetApp EF570's true colors started to shine. Not only was it able to maintain strong throughput, it did so with very low peak latency. This goes to show you that even as this array crushes I/O, it does so in a predictble and consistent manner.
VDBench Workload Analysis
When it comes to benchmarking storage arrays, application testing is best, and synthetic testing comes in second place. While not a perfect representation of actual workloads, synthetic tests do help to baseline storage devices with a repeatability factor that makes it easy to do apples-to-apples comparison between competing solutions. These workloads offer a range of different testing profiles ranging from "four corners" tests, common database transfer size tests, as well as trace captures from different VDI environments. All of these tests leverage the common vdBench workload generator, with a scripting engine to automate and capture results over a large compute testing cluster. This allows us to repeat the same workloads across a wide range of storage devices, including flash arrays and individual storage devices. On the array side, we use our cluster of Dell PowerEdge R740xd servers:
Profiles:
- 4K Random Read: 100% Read, 128 threads, 0-120% iorate
- 4K Random Write: 100% Write, 64 threads, 0-120% iorate
- 64K Sequential Read: 100% Read, 16 threads, 0-120% iorate
- 64K Sequential Write: 100% Write, 8 threads, 0-120% iorate
- Synthetic Database: SQL and Oracle
- VDI Full Clone and Linked Clone Traces
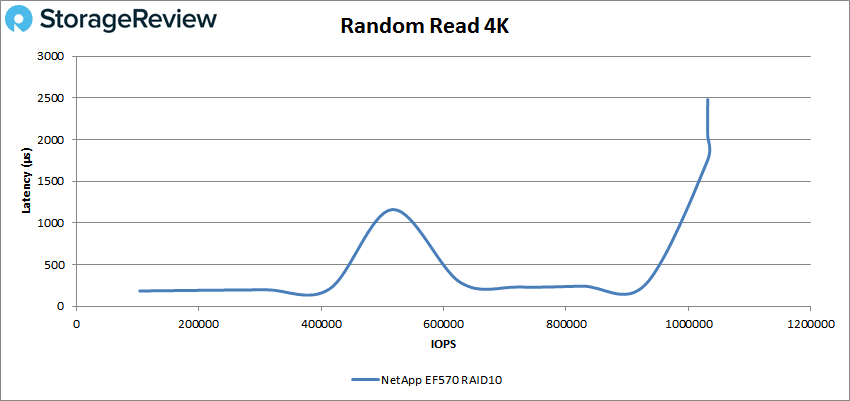
In 4K peak read performance, the EF570 started off with sub-millisecond latency and briefly popped over 1ms around 510K IOPS and dropped back under 1ms until nearly 1 million IOPS. The array peaked at around 1.03 million IOPS and a latency of 2ms before dropping off some.
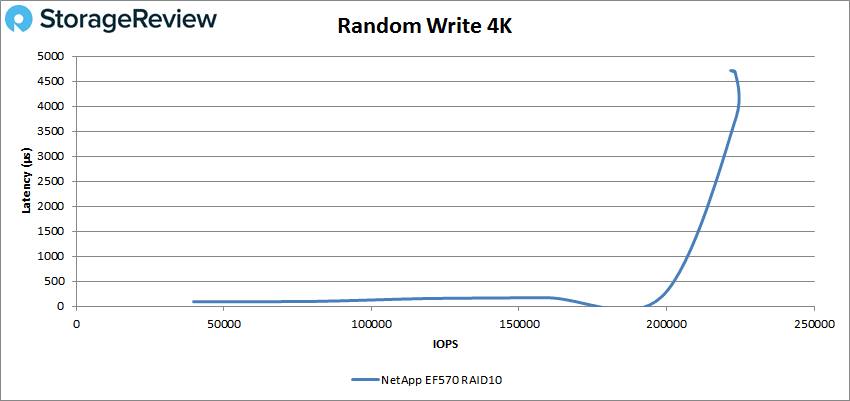
For 4K random write performance, the EF570 made it to just over 200K IOPS before breaking 1ms. The EF570 went on to peak at about 223K IOPS with a latency of 4ms before dropping off slightly.
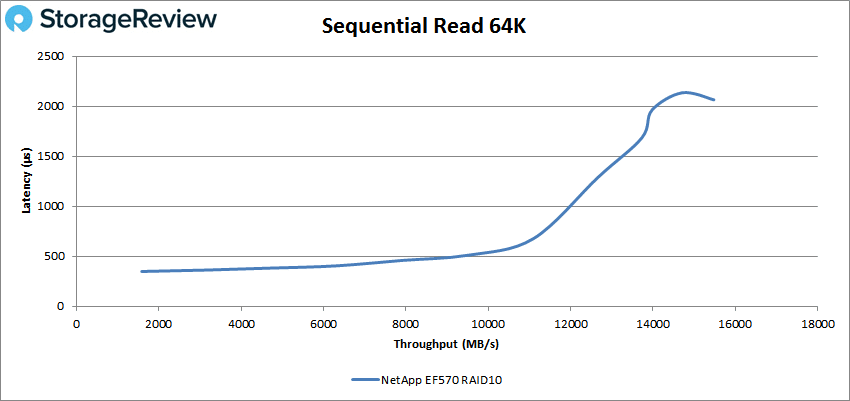
Switching to 64K sequential workloads, the EF570 had sub-millisecond latency performance until about 190K IOPS or 12GB/s before going on to peak at 247,692 IOPS or 15.5GB/s at a latency of 2.1ms.
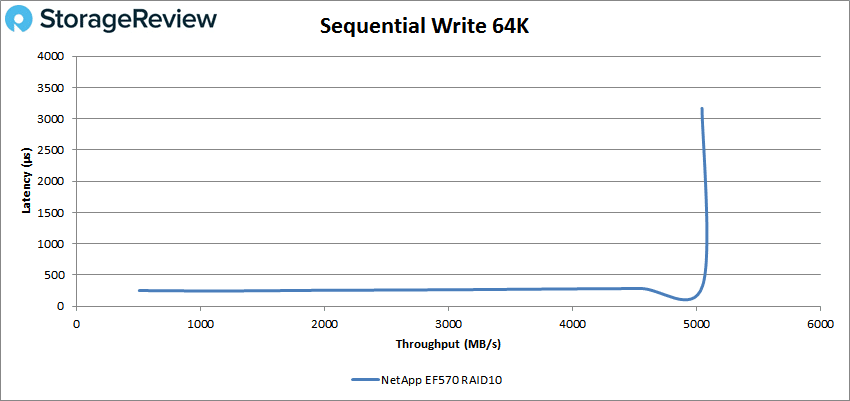
For 64K write, the AFA had sub-millisecond latency until near the end or 80K IOPS (5GB/s). The array peaked at 80,675 IOPS or 5.04GB/s at a latency of 3.2ms.
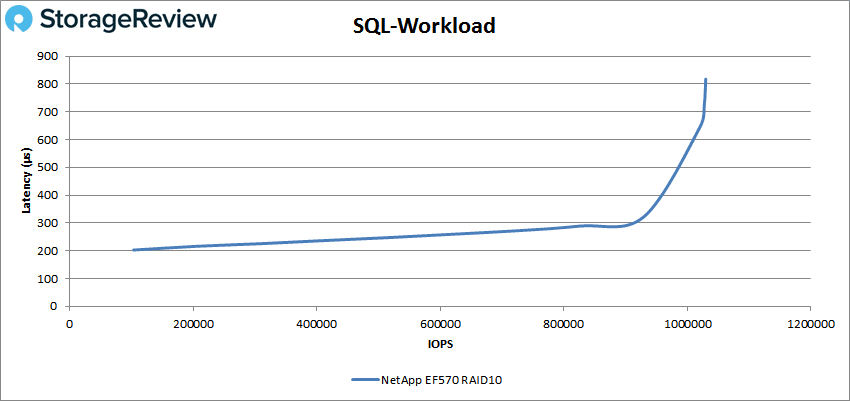
Moving on to our SQL workloads, the EF570 was able to peak at 1,029,910 IOPS with a latency of 818μs.
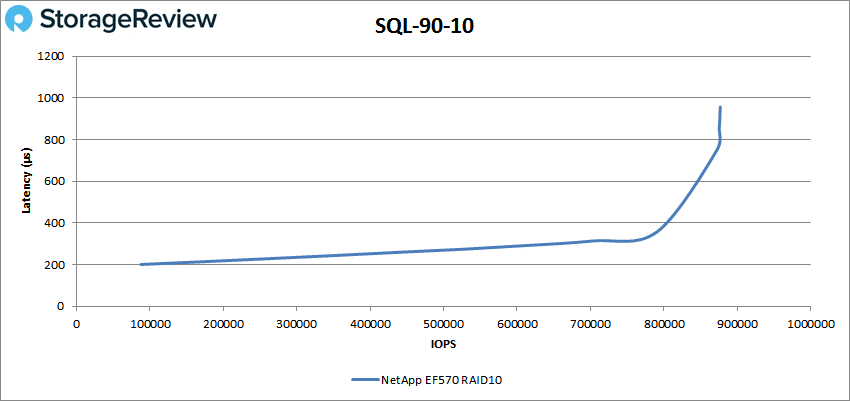
For SQL90-10, the array peaked at 876,833 IOPS with a latency of 957μs.
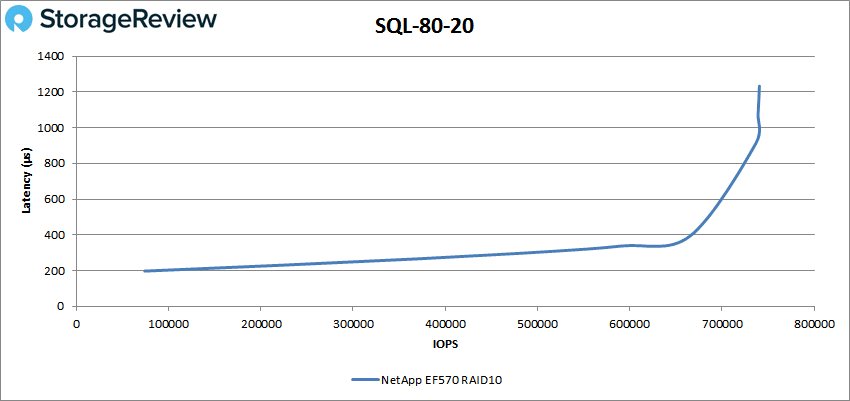
SQL 80-20 was the first SQL test to go over 1ms near peak, with a peak performance of 740,691 IOPS and a latency of 1.2ms.
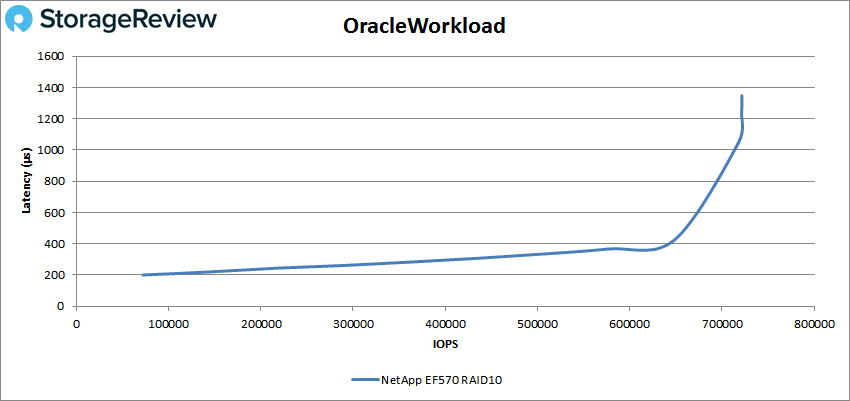
Next up was our Oracle workloads. Again the EF570 went over 1ms near peak with a top performance of 721,615 IOPS and a latency of 1.35ms.
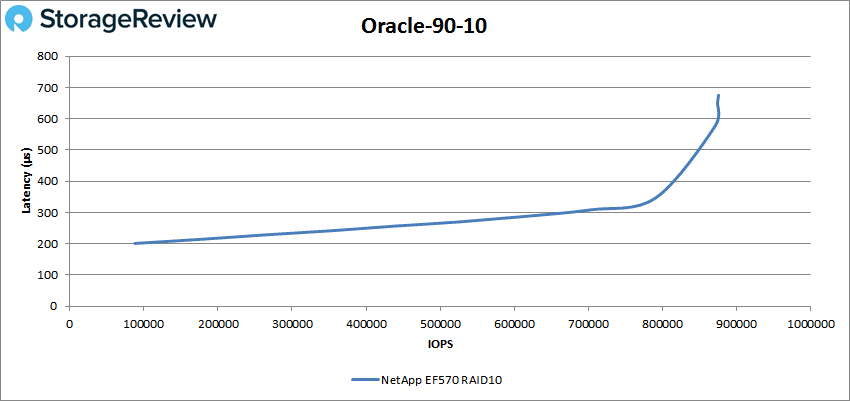
Oracle 90-10 had sub-millisecond latency performance throughout, with a peak score of 875,567 IOPS and a latency of 675μs.
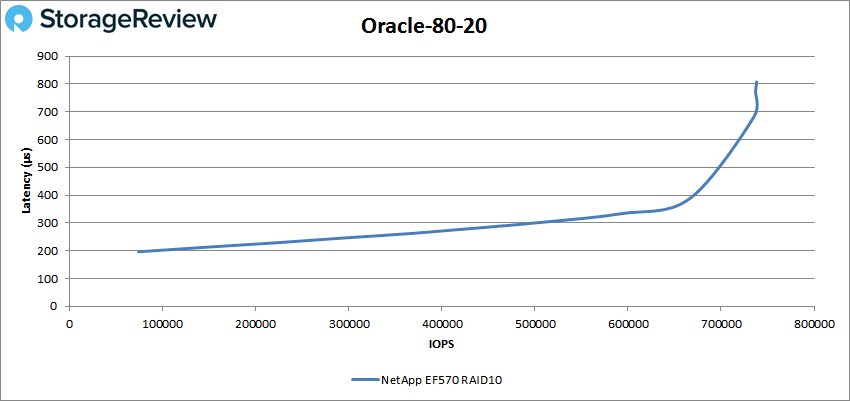
Oracle 80-20 continued on with the sub-millisecond latency performance throughout with a peak score of 738,238 IOPS and a latency of 808μs.
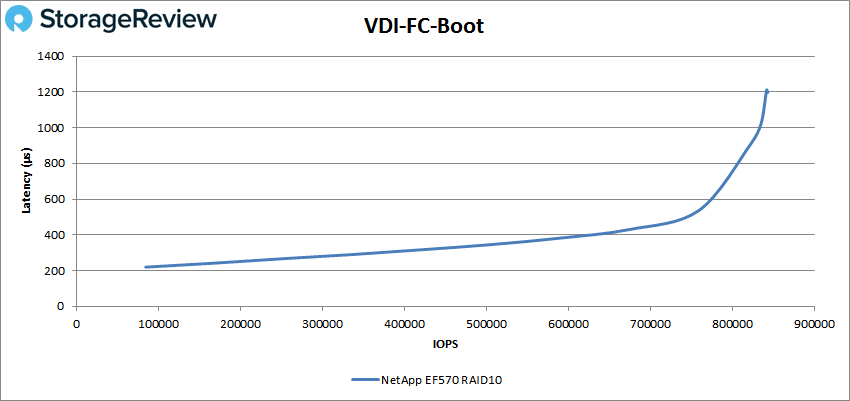
Next, we switched over to our VDI clone test, Full and Linked. For VDI Full Clone Boot, the EF570 made it to roughly 835K IOPS under 1ms and went on to peak at 841,945 IOPS with a latency of 1.2ms.
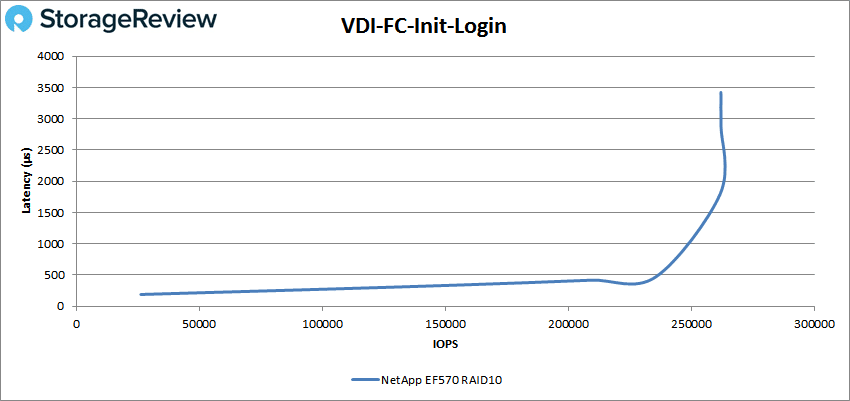
With VDI FC Initial Login, the EF570 made it to 250K IOPS before breaking 1ms. It went on to peak at 262,141 IOPS with a latency of 3.3ms.
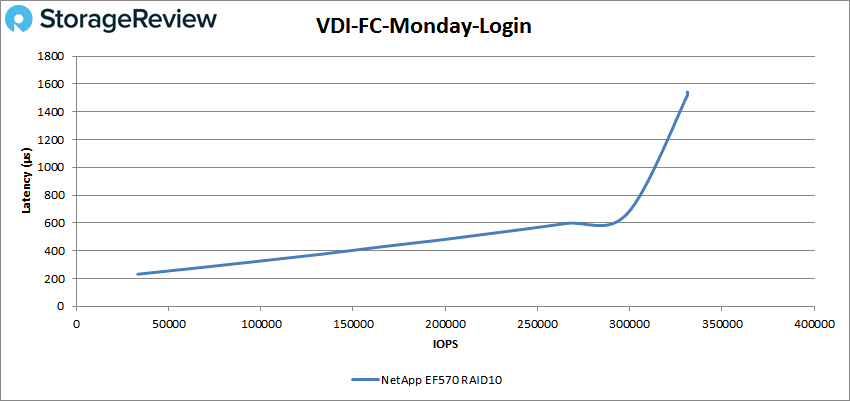
For VDI FC Monday Login, the EF570 had sub-millisecond latency until around 300K IOPS, going on to peak at 331,146 IOPS with a latency of 1.5ms.
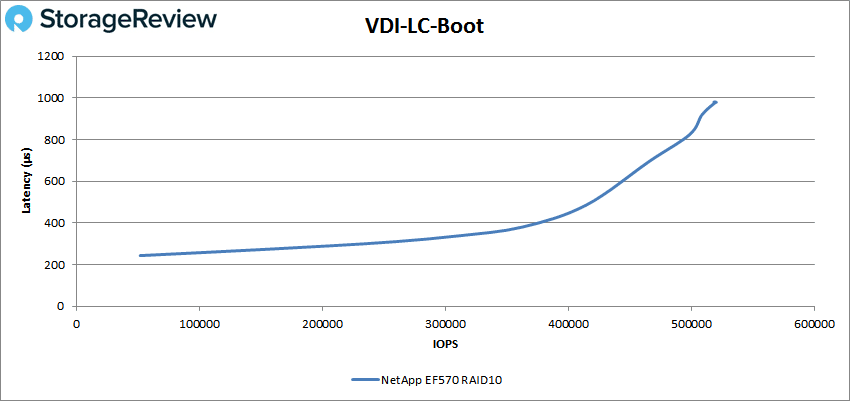
For VDI LC Boot, the EF570 had sub-millisecond latency throughout with a peak score of 519,975 IOPS and a latency of 980μs.
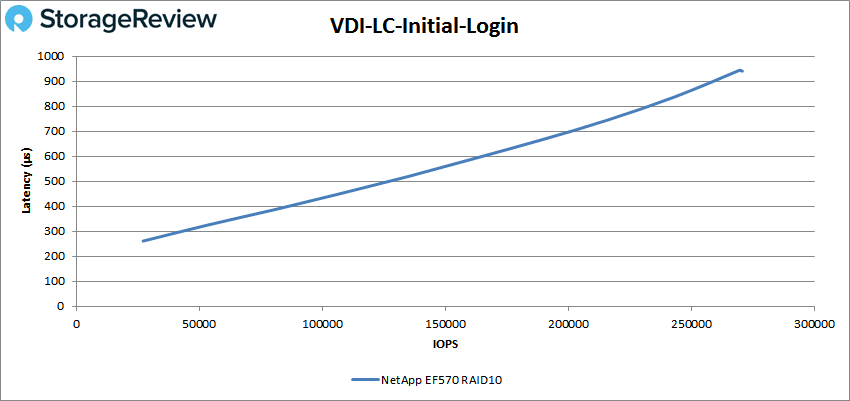
VDI LC Initial Login, once again, saw latency remain below 1ms with a peak score of 269,995 IOPS with a latency of 944μs.
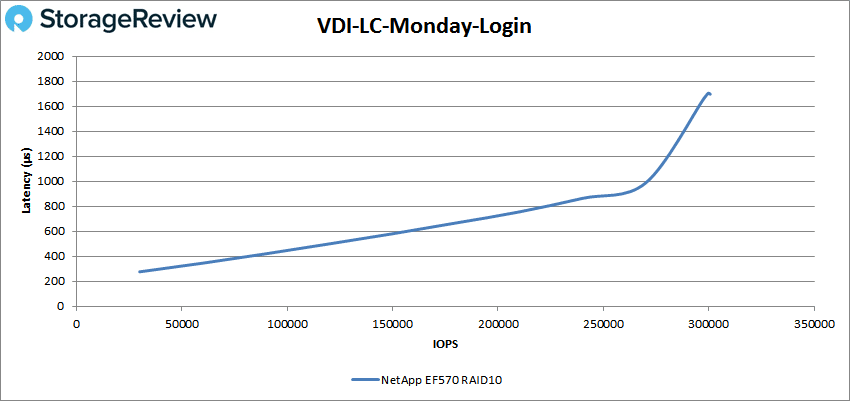
For VDI LC Monday Login, the EF570 was able to maintain a latency under 1ms until roughly 270K IOPS and peaked at 299,663 IOPS with a latency of 1.7ms.
Conclusion
The NetApp EF570 is a 2U all-flash array aimed at the midrange. The EF570 comes with a modular design that makes it highly available and makes it able to scale with ease. A very interesting aspect of the array is its performance. NetApp states that the EF570 can hit up to a million IOPS and up to 21GB/s sequential bandwidth. The company goes on to say that all this can be done at less than 100μs. This high performance, combined with its high availability and simplicity in both management and scaling, make it an attractive option when viewed through the price-to-performance lens.
Looking at application performance, the NetApp EF570 ranged from excellent performance to setting new records for our lab. SQL Server performance showed the EF570 was capable of very tight and consistent performance, measuring 3ms across our four SQL VMs as measured by Benchmark Factory. In our scaled Sysbench benchmark, the EF570 scored so high that we saturated our compute cluster before the array ran out of available I/O. At 8VMs, we measured 22.9K TPS, or roughly where most flash arrays we've tested start to run out of steam. At 16VMs, the EF570 pushed to 39.6K TPS, topping the previous high record in our Sysbench test measured on the RAID0 NVMe-oF flash array. At 32VMs, we hit the peak of our testing cluster with a record-smashing 57.3K TPS result. Across all of these, average and 99th percentile latency were low and buttery smooth. Needless to say, we were impressed.
In our VDBench results, the EF570 had a strong showing, breaking 1 million IOPS on a few benchmarks including 4K read (1.03 million with only 2ms latency) and SQL (1,029,910 IOPS with only 818μs). On the sequential side of things, the EF570 was able to hit 15.5GB/s read and 5.04GB/s write at 2.1ms and 3.2ms latency, respectively. The array had a few other high performance/low latency numbers worth calling out. In SQL 90-10, it hit 877K IOPS (957μs), on SQL 80-20, it hit 741K IOPS (1.2ms), in Oracle, we saw 722K IOPS (1.35ms), on Oracle 90-10, we registered 876K IOPS (675μs), for Oracle 80-20, we noted 738K IOPS (808μs), for VDI FC Boot, we recorded 842K IOPS (1.2ms), and for VDI LC Boot, we saw 520K IOPS (980μs).
NetApp targets the EF570 to the midmarket, but that's largely because of scalability. Typically when we think midmarket, the term conjures visions of price value and performance that's "good enough" to get the job done. Let's be clear here; the EF570 may carry a midmarket price, but it offers an enterprise-grade performance profile that blows away everything we've seen in the lab. Further, in some of the testing (32VM Sysbench), we topped out our compute cluster, meaning there's probably even more performance to be had. When it comes to demanding block storage workloads like analytics and emerging AI-style use cases where latency and availability mean dollars, it's important to have a storage tool that's designed for the job. The NetApp EF570 is a perfect solution for these workloads, bludgeoning those demanding databases into submission to deliver intelligence in the fastest way we've seen to date.
Sign up for the StorageReview newsletter


 Amazon