

Backblaze has published its Q3 2025 Drive Stats and Network Stats reports, offering another data-rich look at the health and performance of its massive cloud storage infrastructure. With 332,915 drives under management as of September 30 (including 328,348 active data drives), this quarter’s analysis highlights key reliability trends, an increase in overall failure rates, and some standout behavior from high-capacity models.
Alongside this, the company also released its latest Network Stats report, which captures a growing shift in traffic patterns fueled by the rise of AI workloads.
Hard Drive Failure Rates Q3 2025
This quarter, the company observed a measurable increase in the overall annualized failure rate (AFR), rising to 1.55%, up from 1.36% in Q2. That figure remains close to 2024’s annual average (1.57%). Still, it marks the second consecutive quarter of upward movement.
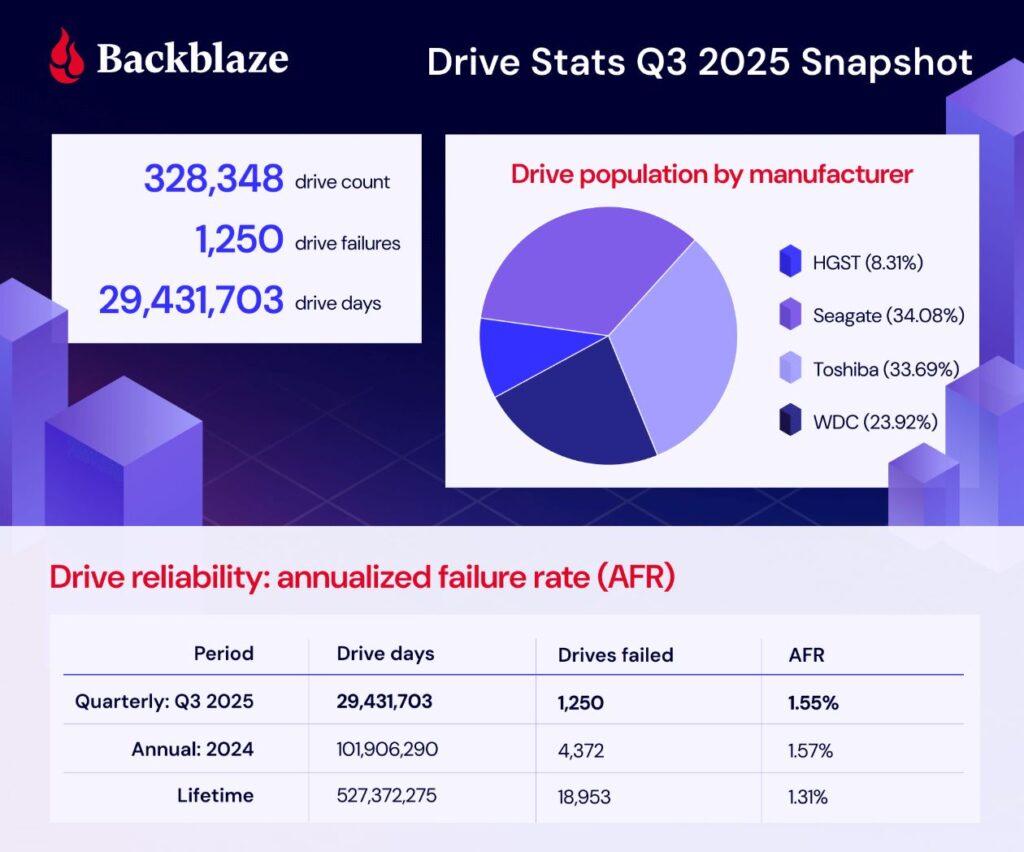
The dataset below includes all drive models with more than 100 units deployed and at least 10,000 drive days during the reporting period (July 1 – September 30, 2025).
Backblaze Hard Drive Failure Rates for Q3 2025
Reporting period: July 1–September 30, 2025, inclusive
Drive models with a drive count > 100 as of July 1 and > 10,000 drive days in Q3 2025.
| MFG | Model | Size (TB) | Drive Count | Avg Age (Months) | Drive Days | Failures | AFR |
| HGST | HMS5C4040BLE640 | 4 | 187 | 100.24 | 17,194 | 0 | 0% |
| HGST | HUH728080ALE600 | 8 | 1,079 | 87.41 | 98,985 | 6 | 2.21% |
| HGST | HUH721212ALE600 | 12 | 2,615 | 69.57 | 239,677 | 9 | 1.37% |
| HGST | HUH721212ALE604 | 12 | 13,417 | 58.60 | 1,227,806 | 65 | 1.93% |
| HGST | HUH721212ALN604 | 12 | 9,985 | 74.97 | 912,361 | 109 | 4.36% |
| Seagate | ST8000DM002 | 8 | 8,987 | 186.89 | 824,787 | 27 | 1.19% |
| Seagate | ST8000NM000A | 8 | 247 | 32.45 | 22,724 | 0 | 0% |
| Seagate | ST8000NM0055 | 8 | 13,351 | 95.55 | 1,224,440 | 53 | 1.58% |
| Seagate | ST10000NM0086 | 10 | 1,018 | 92.35 | 91,658 | 20 | 7.97% |
| Seagate | ST12000NM0007 | 12 | 1,085 | 69.87 | 91,835 | 13 | 5.17% |
| Seagate | ST12000NM0008 | 12 | 18,982 | 64.73 | 1,728,786 | 132 | 2.79% |
| Seagate | ST12000NM000J | 12 | 1,019 | 14.12 | 91,723 | 2 | 0.80% |
| Seagate | ST12000NM001G | 12 | 13,277 | 54.78 | 1,219,882 | 31 | 0.93% |
| Seagate | ST14000NM000J | 14 | 392 | 11.85 | 31,852 | 4 | 4.58% |
| Seagate | ST14000NM001G | 14 | 10,596 | 54.28 | 972,882 | 38 | 1.43% |
| Seagate | ST14000NM0138 | 14 | 1,286 | 56.57 | 117,131 | 22 | 6.86% |
| Seagate | ST16000NM001G | 16 | 34,128 | 35.98 | 3,125,133 | 57 | 0.67% |
| Seagate | ST16000NM002J | 16 | 463 | 33.66 | 42,581 | 0 | 0% |
| Seagate | ST24000NM002H | 24 | 7,245 | 5.81 | 661,539 | 46 | 2.79% |
| Toshiba | MG07ACA14TA | 14 | 37,463 | 58.22 | 3,440,051 | 116 | 1.23% |
| Toshiba | MG07ACA14TEY | 14 | 970 | 35.12 | 85,530 | 8 | 3.41% |
| Toshiba | MG08ACA16TA | 16 | 40,184 | 24.83 | 3,686,376 | 85 | 0.84% |
| Toshiba | MG08ACA16TE | 16 | 6,177 | 43.84 | 553,332 | 16 | 1.06% |
| Toshiba | MG08ACA16TEY | 16 | 5,145 | 44.61 | 462,943 | 215 | 16.95% |
| Toshiba | MG09ACA16TE | 16 | 244 | 4.86 | 17,852 | 0 | 0% |
| Toshiba | MG10ACA20TE | 20 | 18,023 | 7.08 | 1,416,127 | 21 | 0.54% |
| Toshiba | MG11ACA24TE | 24 | 2,400 | 0.33 | 24,148 | 0 | 0% |
| WDC | WUH721414ALE6L4 | 14 | 8,663 | 55.33 | 794,781 | 20 | 0.92% |
| WDC | WUH721816ALE6L0 | 16 | 3,088 | 44.46 | 274,775 | 20 | 2.66% |
| WDC | WUH721816ALE6L4 | 16 | 26,681 | 29.05 | 2,439,069 | 65 | 0.97% |
| WDC | WUH722222ALE6L4 | 22 | 40,271 | 11.84 | 3,555,491 | 50 | 0.51% |
| Totals | 29,431,783 | 1,250 | 1.55% | ||||
Observations
Failure Rate Increase
After holding near 1.3% for two quarters, the rise to 1.55% marks the fleet’s first notable uptick in 2025. The figure remains within normal variance, but Backblaze noted that some model-specific anomalies (including maintenance-related events) contributed to the higher rate.
New Entrants
The Toshiba MG11ACA24TE (24 TB) made its debut this quarter, joining with 2,400 units and 24,148 drive‑days. It’s not yet eligible for lifetime tracking, but it performed flawlessly in its first full quarter of service.
Zero‑Failure Club
Four models recorded zero failures this quarter:
- Seagate HMS5C4040BLE640 (4 TB)
- Seagate ST8000NM000A (8 TB)
- Toshiba MG09ACA16TE (16 TB)
- Toshiba MG11ACA24TE (24 TB)
Notably, the Seagate ST8000NM000A (8 TB) continues its exceptional streak, with its last recorded failure being a single event in Q3 2024.
Outliers on the High End
At the opposite extreme, three models stood out with very high AFRs, prompting Backblaze to run an outlier analysis using the Tukey quartile method. Drives exceeding 5.88% AFR were considered outliers:
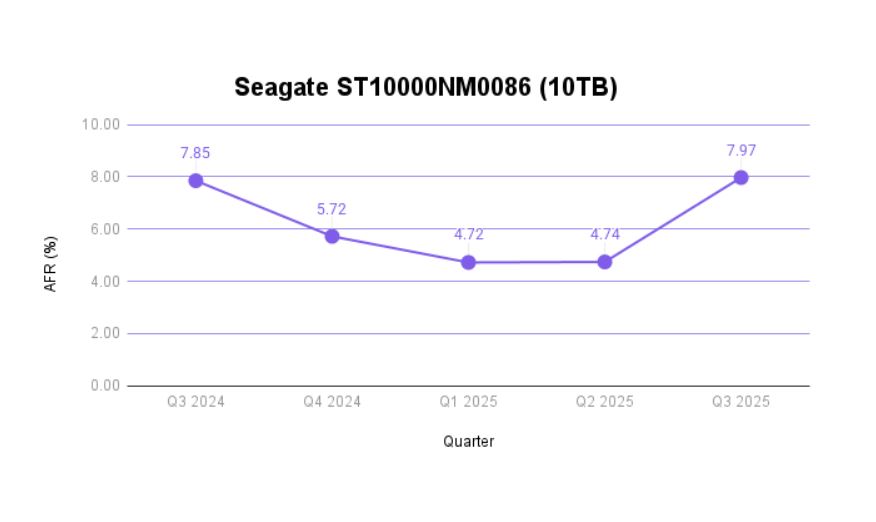
- Seagate ST10000NM0086 (10 TB): 7.97%
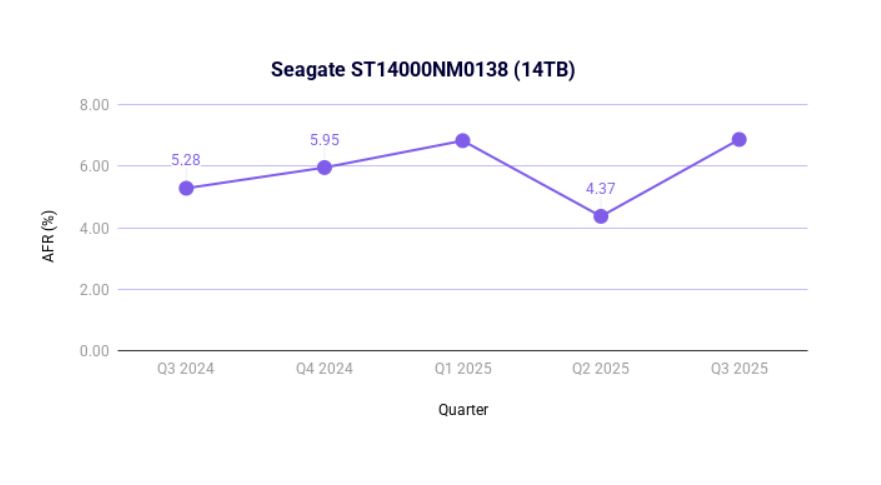
- Seagate ST14000NM0138 (14 TB): 6.86%
- Toshiba MG08ACA16TEY (16 TB): 16.95%
These values represent statistical extremes within the fleet, and Backblaze plans to analyze them further in conjunction with lifetime performance trends over the coming quarters.
Lifetime Hard Drive Failure Rates
Alongside its quarterly stats, Backblaze publishes lifetime drive failure metrics to track long-term performance trends across its storage infrastructure. These figures provide a broader perspective, based on cumulative data spanning several years.
To qualify for this analysis, drives must have at least 500 units deployed as of the end of Q2 2025 and must have accumulated more than 100,000 total drive-days. For Q3 2025, this left 27 drive models in the pool, spanning a combined 402,675 drives and more than 527 million drive days.
The result: A lifetime annualized failure rate (AFR) of 1.31%, exactly matching the AFR from Q1 and up only marginally from Q2’s 1.30%. This kind of consistency is rare at scale and suggests a well-managed fleet, even as the drive population shifts toward higher-capacity models.
Backblaze Lifetime Drive Stats (as of Q3 2025)
Reporting period: Through September 30, 2025
Drive models with > 500 drives and > 100,000 lifetime drive-days.
| MFG | Model | Size (TB) | Drive Count | Avg Age (Months) | Drive Days | Failures | AFR |
| HGST | HMS5C4040ALE640 | 4 | 8,723 | 63.3 | 16,789,193 | 260 | 0.57% |
| HGST | HMS5C4040BLE640 | 4 | 16,349 | 82.8 | 41,156,102 | 448 | 0.40% |
| HGST | HUH728080ALE600 | 8 | 1,218 | 82.8 | 3,069,331 | 98 | 1.17% |
| HGST | HUH721212ALE600 | 12 | 2,696 | 68.8 | 5,641,318 | 92 | 0.60% |
| HGST | HUH721212ALE604 | 12 | 14,331 | 49.6 | 21,613,689 | 943 | 1.59% |
| HGST | HUH721212ALN604 | 12 | 11,438 | 72.3 | 25,143,580 | 1,507 | 2.19% |
| Seagate | ST8000DM002 | 8 | 10,320 | 100.9 | 31,658,329 | 1,317 | 1.52% |
| Seagate | ST8000NM0055 | 8 | 15,680 | 89.6 | 42,736,967 | 2,309 | 1.97% |
| Seagate | ST10000NM0086 | 10 | 1,304 | 85.5 | 3,389,398 | 282 | 3.04% |
| Seagate | ST12000NM0007 | 12 | 38,843 | 31.4 | 37,147,796 | 2,277 | 2.24% |
| Seagate | ST12000NM0008 | 12 | 21,037 | 61.9 | 39,632,553 | 2,225 | 2.05% |
| Seagate | ST12000NM000J | 12 | 1,043 | 13.9 | 439,834 | 20 | 1.66% |
| Seagate | ST12000NM001G | 12 | 13,875 | 53.8 | 22,706,260 | 615 | 0.99% |
| Seagate | ST14000NM001G | 14 | 11,268 | 52.8 | 18,113,014 | 701 | 1.41% |
| Seagate | ST14000NM0138 | 14 | 1,690 | 49.4 | 2,540,557 | 413 | 5.93% |
| Seagate | ST16000NM001G | 16 | 34,936 | 35.6 | 37,817,926 | 741 | 0.72% |
| Seagate | ST24000NM002H | 24 | 7,281 | 5.8 | 1,282,596 | 81 | 2.31% |
| Toshiba | MG07ACA14TA | 14 | 39,387 | 57 | 68,245,826 | 1,944 | 1.04% |
| Toshiba | MG07ACA14TEY | 14 | 1,015 | 34.2 | 1,057,345 | 47 | 1.62% |
| Toshiba | MG08ACA16TA | 16 | 41,044 | 24.6 | 30,687,263 | 943 | 1.12% |
| Toshiba | MG08ACA16TE | 16 | 6,459 | 42.9 | 8,422,214 | 295 | 1.28% |
| Toshiba | MG08ACA16TEY | 16 | 5,349 | 44 | 7,151,157 | 442 | 2.26% |
| Toshiba | MG10ACA20TE | 20 | 18,069 | 7.1 | 3,885,513 | 67 | 0.63% |
| WDC | WUH721414ALE6L4 | 14 | 8,859 | 54.8 | 14,772,985 | 210 | 0.52% |
| WDC | WUH721816ALE6L0 | 16 | 3,070 | 44.2 | 4,123,025 | 98 | 0.87% |
| WDC | WUH721816ALE6L4 | 16 | 26,870 | 28.9 | 23,614,641 | 285 | 0.44% |
| WDC | WUH722222ALE6L4 | 22 | 40,521 | 11.8 | 14,533,863 | 293 | 0.74% |
| Totals | 527,372,275 | 18,953 | 1.31% | ||||
Observations
Lifetime AFR Holding Steady
Backblaze’s long-term fleet-wide AFR remains exceptionally consistent, sitting at 1.31%, which was identical to Q1 and only slightly above Q2. This provides reassurance that quarter-to-quarter fluctuations are mostly isolated and don’t reflect deeper systemic reliability shifts.
4TB Drives Aging Out
While the older 4TB drives (HGST HMS5C4040 series) are steadily being decommissioned, their high deployment totals and long operating lifetimes continue to influence the dataset. The remaining population is now minimal (just 11 drives of one model and 187 of another), but with tens of millions of drive-days behind them, their average age remains unchanged.
High-Capacity Growth
The segment of drives with capacities of 20TB and larger continues to expand. This quarter saw 7,936 new 20TB+ drives added to the lifetime-qualified pool, bringing the total to 67,939 drives, which is roughly 21% of the fleet. That number will climb further once newer models, like the Toshiba MG11ACA24TE (24TB), mature enough to meet the lifetime criteria.
As these larger drives become more prevalent, they’ll play an increasingly important role in shaping Backblaze’s long-term reliability profile, both in average AFR and in understanding failure patterns across higher-density platforms.
What Does Backblaze Consider a Drive Failure?
While Backblaze’s quarterly and lifetime AFRs show generally stable drive reliability, interpreting those numbers hinges on one critical question: what exactly counts as a failure? Not every removed or offline drive represents a physical fault, and some failures are cosmetic; that is, the result of routine maintenance, firmware updates, or even a loose cable.
To demystify this, Backblaze explained the layers behind their drive monitoring process. From SMART attribute tracking using open-source tools to custom-built logging utilities, and a backend query system that ties drive logs to service tickets, identifying an actual failure is a complex blend of technical rules and operational nuances.
To better understand some of the unusually high failure rates reported this quarter, Backblaze conducted an outlier analysis using the Tukey method. This is a standard statistical approach for identifying values that fall significantly outside the norm. For this quarter, any drive model with an annualized failure rate (AFR) above 5.88% was flagged as an outlier.
The motivation behind the analysis was to explore the relationship between drive age and failure frequency. While it’s often assumed that older drives are more prone to failure, the data suggests a more complex picture. Most drive models, regardless of age, maintained AFRs well below the threshold for outliers. This trend reflects a mature infrastructure where both hardware health and operational practices contribute to a generally stable drive population.
Still, a few models defied the pattern, emerging as statistical outliers (and operational concerns) that required further investigation.
Those models were:
- Seagate ST10000NM0086 (10TB)
- Seagate ST14000NM0138 (14TB)
- Toshiba MG08ACA16TEY (16TB)
Seagate ST10000NM0086 (10TB) – 7.97% AFR
This 10TB model has been in service for an average of more than 7.5 years. With only 1,018 units in the fleet, its small sample size makes it especially susceptible to sharp fluctuations in failure rate. Even a handful of failures can significantly skew the AFR compared to drive models with broader deployment. Historical data indicate that this model’s AFR has fluctuated over the past year. While Q3’s number is on the high side, it’s part of an ongoing pattern rather than a red flag of systemic failure.
Seagate ST14000NM0138 (14TB) – 6.86% AFR
This model also has a relatively low drive count at 1,286 and has consistently posted higher-than-average AFRs in prior quarters. Now approaching five years of age, it continues to show elevated failure activity, though not dramatically higher than its past results. It remains a model to watch, particularly given its maturity and Backblaze’s historical experience with it.
Toshiba MG08ACA16TEY (16TB) – 16.95% AFR
This quarter’s most surprising result comes from a 16TB Toshiba drive that typically performs well. At just under four years old and with a deployment base of 5,145 units, this model showed a dramatic spike in failures in Q3. However, this was not unexpected: Backblaze confirmed it had been working with Toshiba to apply firmware updates designed to improve performance. The process required taking some drives offline, which triggered classification as “failed” under the current tracking criteria, even though the issue wasn’t mechanical.
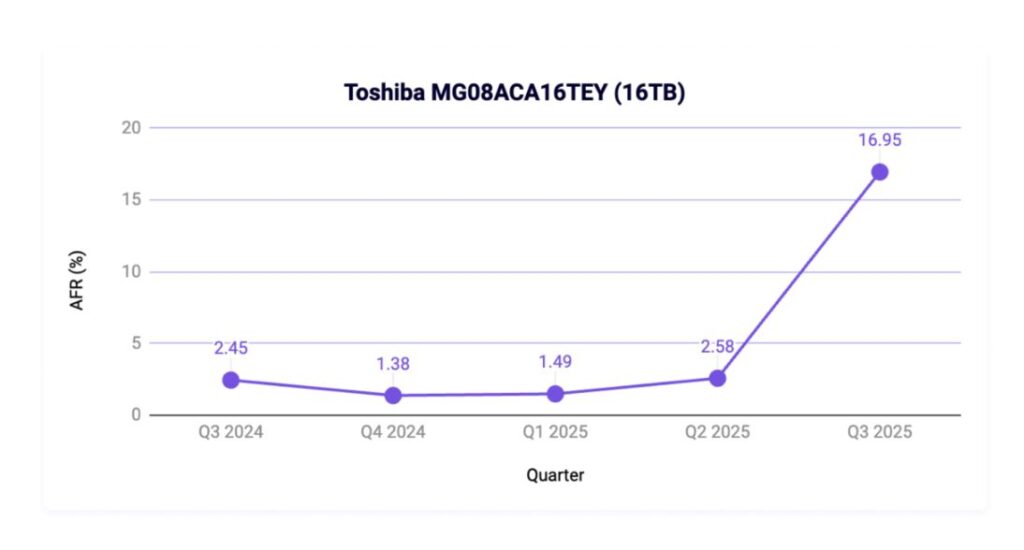
Backblaze has emphasized that the Toshiba spike is more procedural than problematic, and failure rates for this model are expected to stabilize in upcoming quarters. This also serves as a reminder of how nuanced drive failure classification can be, especially when operational work overlaps with reporting periods.
AI Traffic Shifts the Network Landscape
Alongside its hard drive reliability metrics, Backblaze released the latest installment of its Network Stats report, offering a new level of transparency into how workloads are evolving across its global infrastructure. The Q3 2025 data highlights a significant shift driven by AI growth, with traffic patterns changing rapidly in both volume and behavior.
AI-related traffic now accounts for nearly 25% of all network activity across Backblaze’s infrastructure. Unlike traditional CDN-heavy patterns, AI workflows are characterized by short, high-intensity bursts from a smaller number of IP addresses, often associated with GPU-based training and inference workloads. These data flows are not only heavier but significantly more concentrated, with some endpoints moving data at rates far above typical transfer volumes.
This shift marks what Backblaze calls the “AI data gravity” effect—the trend of bringing storage and compute closer together for performance and cost efficiency. Rather than locking into a single hyperscaler, many organizations are opting for multi-cloud architectures that combine specialized AI compute providers with scalable object storage platforms.
While this is just the first official quarter of public reporting for Network Stats, it lays the groundwork for tracking how AI continues to reshape digital infrastructure. The data offers new insights into how workloads are evolving, how they strain and shape the network, and how providers like Backblaze are adapting to support modern compute demands.


 Amazon