

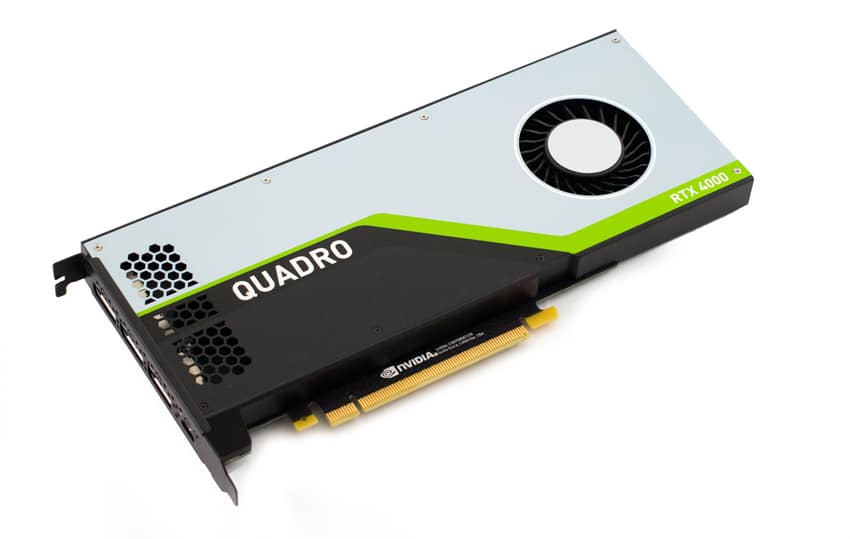
The Quadro RTX 4000, announced in November of last year, is part of NVIDIA’s professional GPU family. The RTX 4000 is specifically designed for the CAD software professional, providing intense realism and immersive interaction with their designs. Consequently, this allows them to run advanced simulations and analyses on their local workstation.
Not unlike other NVIDIA GPU’s, the RTX 4000 utilizes NVIDIA Quadro Scalable Visual Solutions (SVS). As a result, each individual RTX 4000 card can support up to four 5K monitors at 60Hz, or dual 8K displays. When utilizing two Quadro Sync II boards, one system can support up to eight RTX 4000 GPU’s, synchronizing 32 separate displays. NVIDIA also claims a 40% improvement in bandwidth than the previous generation Quadro P4000, thanks in part to 8GB of GDDR6 graphics memory.
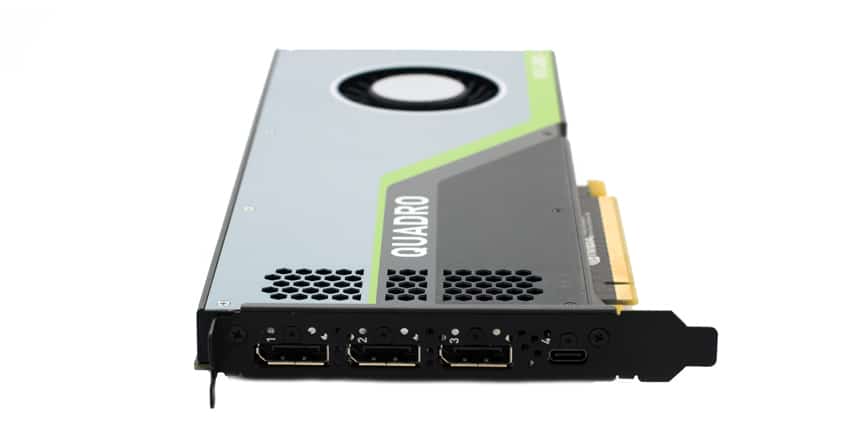
The RTX 4000 sports a 4.4” H x 9.5” L single slot form factor, allowing the GPU to fit a variety of workstation chassis. In this slim form factor NVIDIA was able to fit 2304 CUDA cores, 288 Tensor Cores, 36 RT cores and 8GB GDDR6 memory. This hardware is designed for intense AEC, DCC, AI, VR and graphics workloads. The RTX 4000 comes with VirtualLink to simplify the connectivity to next-generation, high-resolution VR head-mounted displays.
Quadro RTX 4000 Specifications
| Architecture | NVIDIA Turing |
| GPU Memory | 8GB GDDR6 |
| Memory Interface | 256-bit |
| Memory Bandwidth | Up to 416GB/s |
| NVIDIA CUDA Cores | 2,304 |
| NVIDIA Tensor Cores | 288 |
| NVIDIA RT Cores | 36 |
| Single-Precision Performance | 7.1 TFLOPS |
| Tensor Performance | 57.0 TFLOPS |
| System Interface | PCI Express 3.0 x 16 |
| Power Consumption | Total board power: 160W Total graphics power: 125W Thermal Solution Active |
| Form Factor | 4.4” H x 9.5” L, Single Slot |
| Max Simultaneous Displays | 4x 3840×2160 @ 120 Hz 4x 5120×2880 @ 60 Hz 2x 7680×4320 @ 60 Hz |
| VR Ready | Yes |
| Graphics APIs | Shader Model 5.1 OpenGL 4.5 DirectX 12.0 Vulkan 1.0 |
| Compute APIs | CUDA DirectCompute OpenCL |
Performance
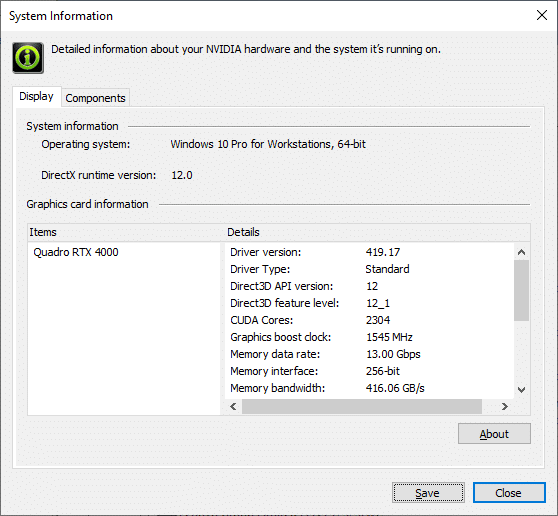
In order to test the performance of the new architecture in the NVIDIA Quadro RTX 4000 GPU, we installed it in our Lenovo ThinkSystem P920 workstation running Windows 10. For a comprehensive look at how each card performs, we leveraged multiple industry benchmarks and GPU-accelerated software that can take full advantage of the card under test. Not only will we be comparing it to the NVIDIA Quadro RTX 5000, which shares the Turning architecture, we will also be comparing it the previous Pascal Quadro line including the P6000, the P5000, and the P4000. This is less of, which is better, and more of what to expect with the GPU chosen.
In order to get a better idea of how these GPUs have scaled from different architectures, we’ve included the following table for the RTX as it is today. The RTX 4000 is clearly the entry-level card in the family, where the P-series cards started out with the P1000. Of course the RTX family scales all the way up to the RTX 8000, bringing more graphics memory, bandwidth and cores along the way.
| NVIDIA Quadro GPUs | ||||
|---|---|---|---|---|
| RTX 4000 | RTX 5000 | RTX 6000 | RTX 8000 | |
| GPU Memory | 8GB GDDR6 | 16GB GDDR6 | 24GB GDDR6 | 48GB GDDR6 |
| Memory Interface | 256-bit | 256-bit | 384-bit | 384-bit |
| Memory Bandwidth | UP to 416GB/s | Up to 448GB/s | Up to 672GB/s | Up to 672GB/s |
| NVIDIA CUDA Cores | 2,304 | 3,072 | 4,608 | 4,608 |
| NVIDIA Tensor Cores | 288 | 384 | 576 | 576 |
| NVIDIA RT Cores | 36 | 48 | 72 | 72 |
| Single-Precision Performance | 7.1 TFLOPS | 11.2 TFLOPS | 16.3 TFLOPS | 16.3 TFLOPS |
| Tensor Performance | 57.0 TFLOPS | 89.2 TFLOPS | 130.5 TFLOPS | 130.5 TFLOPS |
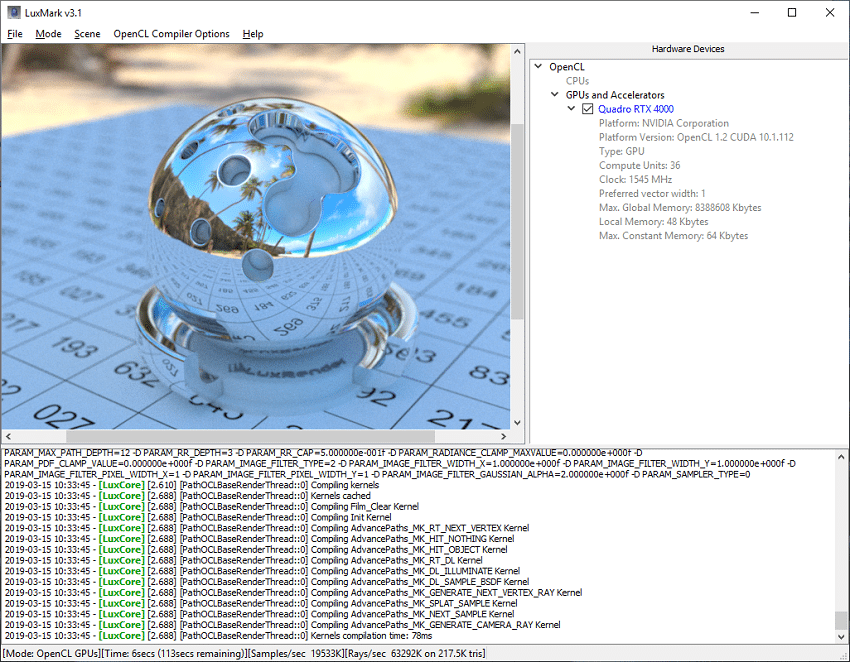
Our first benchmark is the LuxMark cross-platform OpenCL benchmark tool. LuxMark is based on the LuxCore API, and offered as a promotional component of the LuxCoreRender suite. It uses a new micro-kernel based OpenCL path tracer as the rendering more for its benchmark, offering a unique way to stress the GPU installed in a given workstation.
| LuxMark | |
|---|---|
| GPUs | Results |
| P4000 | 15,303 |
| P5000 | 13,170 |
| P6000 | 21,297 |
| RTX 4000 | 28,338 |
| RTX 5000 | 29,404 |
While the Pascal GPUs came off the LuxMark with good results there is an obvious jump in performance when looking at the Turning GPUs. The RTX 4000 came in second to the RTX 5000 with a score of 28,338.
Next up is Arion, a CUDA benchmarking tool, developed by RandomControl that allows workstations to stress CPUs or GPUs in a rendering application. ArionBench is a software tool based on Arion 2 Technology that puts CPU/GPUs under heavy stress through the task of simulating the flow of light in a 3D scene.
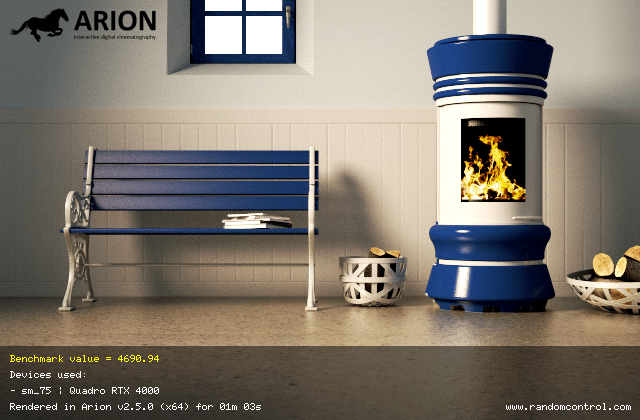
| Arion | |
|---|---|
| GPUs | Results |
| P4000 | 1,865 |
| P5000 | 2,738 |
| P6000 | 3,731 |
| RTX 4000 | 4,484 |
| RTX 5000 | 6,193 |
Another large jump in scores going from Pascal to Turing with the RTX 4000 making a fairly large jump over the P6000.
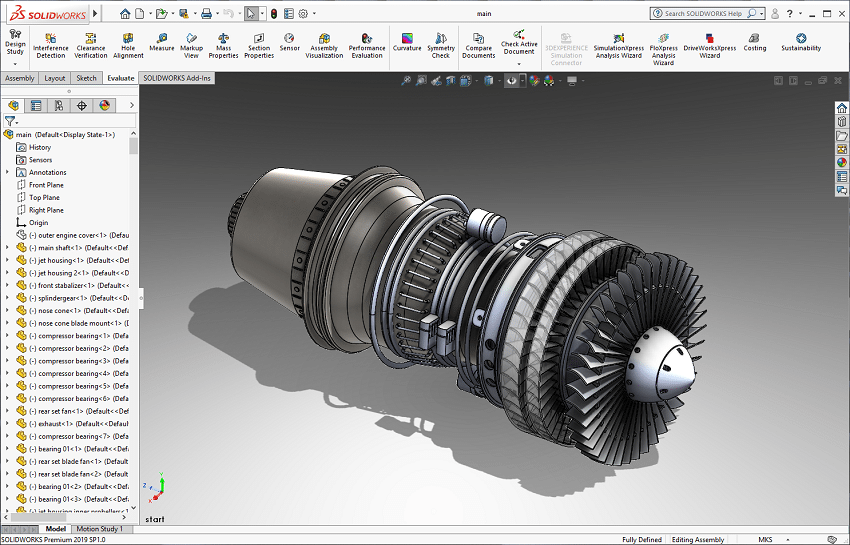
Our next benchmark leverages SolidWorks 2019 and four 3D models coveraging an Audi R8, a construction digger, a jet engine as well as a ralley car. Solidworks is an industry-leading GPU-accelerated 3D CAD modeling application that operates on Windows-based systems. SolidWorks is developed by Dassault Systèmes and is used by over two million engineers and more than 165,000 companies worldwide. For benchmarking purposes we leverage the new “performance pipeline” feature inside SolidWorks 2019. This architecture provides a more responsive, real-time display especially for large models. It takes advantage of modern OpenGL (4.5) and hardware-accelerated rendering to maintain a high level of detail and frame rate when you pan, zoom, or rotate large models.
After each model is rendered our script rotates each model five times and measures the time required to complete this task. It then divides that by the number of frames rendered and calculates the average frames per section (FPS) score.
| Solidworks | |
|---|---|
| Solidworks R8 | Average |
| P4000 | 198.0232 |
| P5000 | 214.9254 |
| P6000 | 217.9745 |
| RTX 4000 | 211.1824 |
| RTX 5000 | 208.8849 |
| Solidworks Digger | Average |
| P4000 | 186.4832 |
| P5000 | 211.9595 |
| P6000 | 230.9774 |
| RTX 4000 | 259.6056 |
| RTX 5000 | 294.2529 |
| Solidworks Jet Engine | Average |
| P4000 | 163.0573 |
| P5000 | 198.5351 |
| P6000 | 210.411 |
| RTX 4000 | 220.6897 |
| RTX 5000 | 283.2206 |
| Solidworks Rally Car | Average |
| P4000 | 205.6225 |
| P5000 | 219.0114 |
| P6000 | 218.4922 |
| RTX 4000 | 214.4253 |
| RTX 5000 | 217.256 |
With Solidworks R8 and Rally Car that is a slight dip in performance for the Turing models, however there is a large jump in Digger and Jet Engine. With our Solidworks testing we were using the beta display mode that may be the cause of the unusual scaling seen on the Audi R8 and RallyCar Assemblies.
Next up is the Environmental Systems Research Institute (Esri) benchmark. Esri is a supplier of Geographic Information System (GIS) software. Esri’s Performance Team designed their PerfTool add-in scripts to automatically launch the ArcGIS Pro. This application uses a “ZoomToBookmarks” function to browse various pre-defined bookmarks and create a log file with all the key data points required to predict the user experience. The script automatically loops the bookmarks three times to account for caching (memory and disk cache). In other words, this benchmark simulates heavy graphical use that one might see through Esri’s ArcGIS Pro 2.3 software.
The tests consist of three main datasets. Two are 3-D city views of Philadelphia, PA and Montreal, QC. These city views contain textured 3-D multipatch buildings draped on a terrain model and draped aerial images. The third dataset is a 2-D map view of the Portland, OR region. This data contains detailed information for roads, landuse parcels, parks and schools, rivers, lakes, and hillshaded terrain.
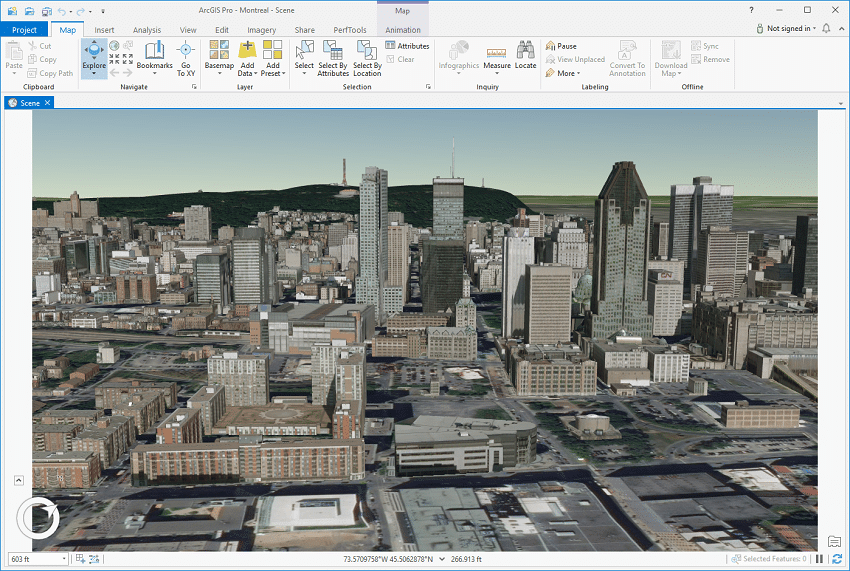
Looking at drawtime of the Montreal model, the NVIDIA Quadro RTX 4000 showed an average drawtime of 00:01:31.284, while average and minimum FPS showed 502.395 and 180.699, respectively.
| ESRI ArcGIS Pro 2.3 Montreal | |
|---|---|
| Drawtime | Average |
| Quadro P4000 | 00:01:31.084 |
| Quadro P5000 | 00:01:31:082 |
| Quadro P6000 | 00:01:31.081 |
| Quadro RTX 4000 | 00:01:31.284 |
| Quadro RTX 5000 | 00:01:31.067 |
| Average FPS | Average |
| Quadro P4000 | 432.327 |
| Quadro P5000 | 489.889 |
| Quadro P6000 | 521.551 |
| Quadro RTX 4000 | 502.395 |
| Quadro RTX 5000 | 527.636 |
| Minimum FPS | Average |
| Quadro P4000 | 164.546 |
| Quadro P5000 | 194.218 |
| Quadro P6000 | 190.336 |
| Quadro RTX 4000 | 180.699 |
| Quadro RTX 5000 | 190.775 |
Next up is our Philly model, where the RTX 4000 showed an average drawtime of 00:01:00.231, while average and minimum FPS showed 434.170 and 196.825, respectively.
| ESRI ArcGIS Pro 2.3 Philly | |
|---|---|
| Drawtime | Average |
| Quadro P4000 | 00:02:53.928 |
| Quadro P5000 | 00:01:01.109 |
| Quadro P6000 | 00:01:01.245 |
| Quadro RTX 4000 | 00:01:00.231 |
| Quadro RTX 5000 | 00:01:01.111 |
| Average FPS | Average |
| Quadro P4000 | 304.340 |
| Quadro P5000 | 451.826 |
| Quadro P6000 | 469.879 |
| Quadro RTX 4000 | 434.170 |
| Quadro RTX 5000 | 531.315 |
| Minimum FPS | Average |
| Quadro P4000 | 160.152 |
| Quadro P5000 | 212.910 |
| Quadro P6000 | 207.879 |
| Quadro RTX 4000 | 196.825 |
| Quadro RTX 5000 | 224.341 |
Our last model is of Portland. Here, the RTX 4000 had an average drawtime of 00:00:32.646. Average FPS showed 2,821.928 while Minimum FPS showed 1,083.260.
| ESRI ArcGIS Pro 2.3 Portland | |
|---|---|
| Drawtime | Average |
| Quadro P4000 | 00:00:32.426 |
| Quadro P5000 | 00:00:32.310 |
| Quadro P6000 | 00:00:32.552 |
| Quadro RTX 4000 | 00:00:32.646 |
| Quadro RTX 5000 | 00:00:32.541 |
| Average FPS | Average |
| Quadro P4000 | 2,051.053 |
| Quadro P5000 | 2,057.395 |
| Quadro P6000 | 2,343.948 |
| Quadro RTX 4000 | 2,821.928 |
| Quadro RTX 5000 | 2,783.547 |
| Minimum FPS | Average |
| Quadro P4000 | 1,179.974 |
| Quadro P5000 | 1,189.524 |
| Quadro P6000 | 1,282.045 |
| Quadro RTX 4000 | 1,083.260 |
| Quadro RTX 5000 | 1,007.309 |
Conclusion
The NVIDIA Quadro RTX 4000 is the lower level Turing architecture GPU but that doesn’t mean it isn’t powerful. The RTX 4000 comes equipped with 2304 CUDA cores, and 8GB GDDR6 GPU. Like all of the Quadro RTX, the 4000 is able to deliver accelerated ray tracing, deep learning, and advanced shading in its accessible single slot form factor. This can give creative professionals faster time to insight while allowing them to accelerate their creative efforts. The RTX 4000 also comes with VirtualLink that simplifies connectivity to next-generation, high-resolution VR head-mounted displays.
In terms of performance, the RTX 4000 performed very well, especially considering it is on the lower end of the new GPUs. In our LuxMark benchmark it nearly doubled its Pascal counterpart and even surpassed the P6000. In Arion the RTX 4000 more than doubled the P4000 and again easily surpassed the P6000. In our Solidworks benchmarks the RTX 4000 easily surpassed the P4000 and shined brighter in the Digger and Jet Engine benchmark. In ESRi the RTX 4000 had much better performance than the P4000 (and P5000 in some cases), but there are workloads where the P6000 was the better performer. It should be kept in mind the RTX 4000 is on the low end of the Turing architecture and the P6000 is at the highest end of the Pascal architecture.
All in all, the Quadro RTX 4000 is a much-welcomed addition to NVIDIA’s large line of impressive GPU’s and offers very impressive performance numbers for the entry-level card while carrying a price tag of only around $900.


 Amazon