

AMD is once again pushing the boundaries of the high-performance desktop market with the Ryzen 9 9950X3D2 Dual Edition, which launches at an MSRP of $899. When we reviewed the Ryzen 9 9950X3D in March 2025, it made a compelling case as the first 16-core X3D processor, with thermal and TDP constraints no longer forcing a meaningful trade-off between gaming and productivity. It brought 3D V-Cache to a 16-core design, including full overclocking support, and raised the TDP ceiling to deliver sustained performance that earlier X3D chips couldn’t match. The 9950X3D2 builds on that foundation, extending 3D V-Cache across both CCDs for the first time and increasing the total L3 cache from 128MB to 192MB. AMD provided us with a sample for evaluation against the full 9000-series X3D stack.
AMD Ryzen 9 9950X3D2: Solving the Asymmetry Problem
The core problem the 9950X3D2 solves is one the 9950X3D never fully escaped. Because the 9950X3D applied 3D V-Cache to only one of its two CCDs, threads migrating between dies during normal Windows load balancing would periodically lose access to the cache-rich CCD, causing unpredictable latency spikes. AMD’s chipset drivers helped manage this, but the asymmetry remained. The 9950X3D2 eliminates it. Each CCD combines 32MB of traditional 2D L3 cache with a 64MB 3D V-Cache stack, giving both CCDs an identical 96MB L3 pool and all 16 cores symmetrical, low-latency access to a combined 192MB total. For workloads sensitive to memory latency, particularly high-FPS gaming, this is a meaningful architectural improvement rather than a simple spec bump.
The underlying 2nd Gen 3D V-Cache design is the same as the under-die architecture introduced with the 9800X3D and carried through to the 9950X3D, with cache placed beneath the compute cores to keep the primary heat source close to the cooling solution. What changes with the 9950X3D2 is scope: that design now covers both CCDs, and the TDP rises from 170W to 200W to support the additional sustained throughput. Total on-chip cache reaches 208 MB across L2 and L3, up from 144 MB on the 9950X3D.
AMD Ryzen 9 9950X3D2 Specifications
| Specifications | AMD Ryzen 9 9950X3D2 | AMD Ryzen 9 9950X3D | AMD Ryzen 9 9900X3D | AMD Ryzen 7 9850X3D | AMD Ryzen 7 9800X3D |
|---|---|---|---|---|---|
| Cores/Threads | 16/32 | 16/32 | 12/24 | 8/16 | 8/16 |
| Platform | AM5 | AM5 | AM5 | AM5 | AM5 |
| Max Boost / Base Clock | 5.6 / 4.3GHz | 5.7 / 4.3GHz | 5.5 / 4.4GHz | 5.6 / 4.7GHz | 5.2 / 4.7GHz |
| L2 Cache | 16MB | 16MB | 12MB | 8MB | 8MB |
| L3 Cache | 192MB | 128MB | 128MB | 96MB | 96MB |
| Total Cache | 208MB | 144MB | 140MB | 104MB | 104MB |
| Architecture | Zen 5 | Zen 5 | Zen 5 | Zen 5 | Zen 5 |
| PCIe | Gen5 | Gen5 | Gen5 | Gen5 | Gen5 |
| DRAM | DDR5 | DDR5 | DDR5 | DDR5 | DDR5 |
| TDP / Default Socket Power (PPT) | 200W / 270W | 170W / 230W | 120W / 230W | 120W / 162W | 120W /162W |
| Graphics | Radeon | Radeon | Radeon | Radeon | Radeon |
| AMD Recommended Cooler | Liquid cooler | Liquid cooler | Liquid cooler | Liquid cooler | Liquid cooler |
Platform and Compatibility
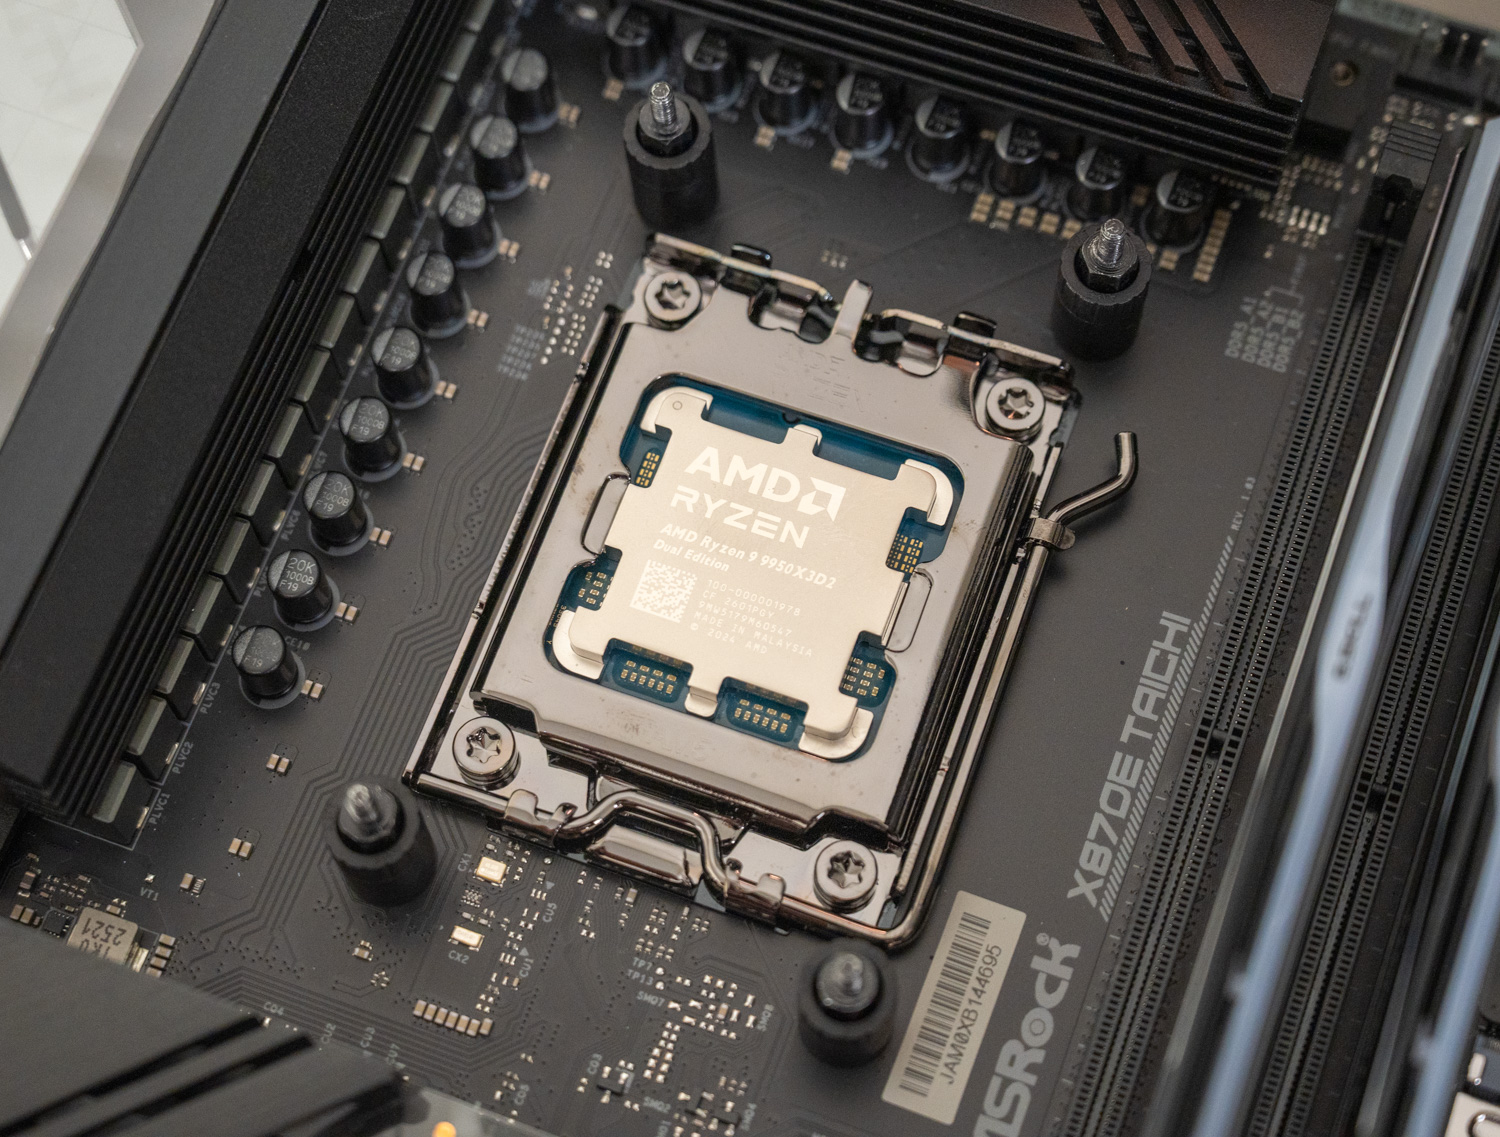
The 9950X3D2 slots into the AM5 ecosystem without requiring a platform change. Like the 9950X3D, it supports existing A620, B650/B650E, X670/X670E, X870/X870E, B840, and B850-class motherboards with a BIOS update, making it a straightforward upgrade for users already invested in the platform. The higher 200W TDP does demand more from the cooling side, however. While the 9950X3D can be managed with a capable 240mm AIO, AMD recommends a 360mm liquid cooler for the 9950X3D2 to maintain sustained boost performance under heavy workloads.
AMD Ryzen 9 9950X3D2 Performance
To evaluate overall performance, we compared the AMD Ryzen 9 9950X3D2 against the AMD Ryzen 9 9950X3D, Ryzen 7 9850X3D, and Ryzen 7 9800X3D. While all four processors feature AMD’s 3D V-Cache design, the two Ryzen 9 models sit in a higher-performance tier, sharing a 16-core, 32-thread configuration. The Ryzen 7 chips, with 8 cores and 16 threads, sit a step below, with performance differences becoming more apparent in heavily threaded workloads while remaining relatively close in lighter tasks. All testing was conducted at stock settings (no overclocking) to ensure a consistent baseline across the stack.
AMD Consumer Test Platform
To keep the testing environment as consistent as possible, all CPUs have been tested across X870E-based motherboards at stock settings. The only changes above stock settings have been the same DDR5 memory and EXPO configuration. Here’s a full rundown of our testing rig in this review:
- Motherboard: ASRock X870E Taichi (provided by AMD)
- Memory: G.SKILL Trident Z5 Royal Series DDR5-6000 (2x16GB), running on EXPO 1
- Cooling: NZXT Kraken Elite 360
- Operating System: Windows 11 Pro
3DMark CPU Profile
The 3DMark CPU Profile measures CPU performance across different workloads by testing 1, 2, 4, 8, 16, and max threads. It highlights how the CPU handles single-threaded tasks, gaming workloads, and multithreaded applications such as 3D rendering. The benchmark minimizes GPU impact, offering a clear view of the CPU’s performance in various scenarios.
In the 3DMark CPU Profile benchmark, the Ryzen 9 chips most clearly separate themselves as thread counts increase. The 9950X3D2 tops the chart with 17,672 points in the Max Threads test, about 6% ahead of the 9950X3D, while the 9950X3D still holds a sizable lead over the Ryzen 7 9850X3D and 9800X3D by roughly 63% and 67%, respectively. That gap narrows quickly under lighter workloads, when all four chips are much closer together, but the ranking still favors the two Ryzen 9 processors overall.
| 3DMark CPU Profile (higher is better) | AMD Ryzen 9 9950X3D2 | AMD Ryzen 9 9950X3D | AMD Ryzen 7 9850X3D | AMD Ryzen 7 9800X3D |
|---|---|---|---|---|
| Max Threads | 17,672 | 16,690 | 10,261 | 10,018 |
| 16 Threads | 16,956 | 15,983 | 10,285 | 10,034 |
| 8 Threads | 9,141 | 9,070 | 8,611 | 8,269 |
| 4 Threads | 4,980 | 4,846 | 4,867 | 4,646 |
| 2 Threads | 2,508 | 2,521 | 2,487 | 2,394 |
| 1 Threads | 1,274 | 1,264 | 1,267 | 1,213 |
y-cruncher
y-cruncher is a popular benchmarking and stress-testing application that launched in 2009. This test is multithreaded and scalable, computing Pi and other constants up to the trillions of digits. Faster is better in this test.
In y-cruncher, both Ryzen 9 chips show a clear advantage in this long-running computational workload. The 9950X3D2 completes the 1-billion-digit test in 12.605 seconds, roughly 31% faster than the 9950X3D, which itself is about 12% faster than the 9850X3D and 31% faster than the 9800X3D. As the workload grows, the lead widens further, with the 9950X3D2 completing the 5 billion run about 41% faster than the 9950X3D, reinforcing its stronger sustained compute performance.
| y-cruncher (lower time is better) | AMD Ryzen 9 9950X3D2 | AMD Ryzen 9 9950X3D | AMD Ryzen 7 9850X3D | AMD Ryzen 7 9800X3D |
|---|---|---|---|---|
| 1 Billion | 12.605 s | 16.450 s | 18.503 s | 21.487 s |
| 2 Billion | 34.925 s | 48.047 s | 52.589 s | 64.273 s |
| 5 Billion | 77.370 s | 109.343 s | 115.581 s | 143.891 s |
y-cruncher BBP
This y-cruncher benchmark uses the Bailey-Borwein-Plouffe (BBP) formulas to compute a large number of hexadecimal digits of Pi, measuring the CPU’s total computation time, utilization, and multi-core efficiency.
Looking at the y-cruncher BBP test, the Ryzen 9 9950X3D2 again sets the pace, completing the 100 BBP run in 47.07 seconds, about 7% faster than the 9950X3D. The non-D2 9950X3D still maintains a major lead over both Ryzen 7 chips, finishing that same workload about 66% faster than the 9850X3D and 66% faster than the 9800X3D. Across the full sweep, the order stays consistent, with the two Ryzen 9 processors comfortably ahead.
| y-cruncher BBP (lower time is better) | AMD Ryzen 9 9950X3D2 | AMD Ryzen 9 9950X3D | AMD Ryzen 7 9850X3D | AMD Ryzen 7 9800X3D |
|---|---|---|---|---|
| 1 BBP | 0.384 s | 0.426 s | 0.669 s | 0.671 s |
| 10 BBP | 4.173 s | 4.538 s | 7.501 s | 7.497 s |
| 100 BBP | 47.070 s | 50.291 s | 83.719 s | 83.345 s |
Maxon Cinebench
Cinebench is a widely used benchmarking tool that measures the performance of CPUs and GPUs by rendering with Maxon Cinema 4D. It provides a score that allows you to compare the performance of different systems and components. We ran R23 and R24, both popular Cinebench versions, so you can compare the results with those on popular online leaderboards.
In Cinebench, the separation between the Ryzen 9 and Ryzen 7 parts is immediately clear in multi-core performance, while single-core results remain much tighter across the stack. In Cinebench R23, the Ryzen 9 9950X3D2 leads with a score of 42,555, about 6% ahead of the 9950X3D, while both Ryzen 9 chips nearly double the performance of the Ryzen 7 models, holding roughly an 87–99% advantage in multi-core workloads. Cinebench R24 shows the same trend, with the 9950X3D2 reaching 2,508, about 12% ahead of the 9950X3D and again maintaining a significant 80%+ lead over the Ryzen 7 parts.
Single-core results tell a different story. In R23, all three newer chips cluster closely, with the 9950X3D2 holding only about a 2% lead over the 9950X3D and effectively tying the 9850X3D. R24 tightens even further, where the 9950X3D2 and 9850X3D are nearly identical, and the 9950X3D trails slightly. This consistency highlights that lightly threaded performance is broadly similar across the lineup, with only small gains at the top end.
Cinebench R23
| Cinebench R23 (higher is better) | AMD Ryzen 9 9950X3D2 | AMD Ryzen 9 9950X3D | AMD Ryzen 7 9850X3D | AMD Ryzen 7 9800X3D |
|---|---|---|---|---|
| Multi-Core | 42,555 | 39,993 | 21,382 | 22,718 |
| Single-Core | 2,248 | 2,200 | 2,216 | 2,089 |
Cinebench R24
| Cinebench R24 (higher is better) | AMD Ryzen 9 9950X3D2 | AMD Ryzen 9 9950X3D | AMD Ryzen 7 9850X3D | AMD Ryzen 7 9800X3D |
|---|---|---|---|---|
| Multi-Core | 2,508 | 2,246 | 1,366 | 1,338 |
| Single-Core | 143 | 134 | 142 | 130 |
7-Zip Compression
The 7-Zip Compression Benchmark evaluates CPU performance during compression and decompression, measuring GIPS (Giga Instructions Per Second) and CPU usage. Higher GIPS and efficient CPU usage indicate superior performance.
In 7-Zip, the 9950X3D2 achieves the highest overall score, with a total rating of 233.09 GIPS, about 9% ahead of the 9950X3D. The non-D2 9950X3D still holds a commanding advantage over the Ryzen 7 chips, outperforming the 9850X3D by roughly 64% and the 9800X3D by about 69% in total rating. Compression and decompression follow the same general pattern, with the two Ryzen 9 processors well out in front.
| 7-Zip Compression | AMD Ryzen 9 9950X3D2 | AMD Ryzen 9 9950X3D | AMD Ryzen 7 9850X3D | AMD Ryzen 7 9800X3D |
|---|---|---|---|---|
| Compressing | ||||
| Current CPU Usage | 2,736% | 2,737% | 1,394% | 1,387% |
| Current Rating/Usage | 7.132 GIPS | 6.565 GIPS | 8.864 GIPS | 8.488 GIPS |
| Current Rating | 195.145 GIPS | 179.648 GIPS | 123.563 GIPS | 117.745 GIPS |
| Resulting CPU Usage | 2,717% | 2,727% | 1,390% | 1,393% |
| Resulting Rating/Usage | 7.186 GIPS | 6.531 GIPS | 8.852 GIPS | 8.466 GIPS |
| Resulting Rating | 195.272 GIPS | 178.094 GIPS | 123.073 GIPS | 117.895 GIPS |
| Decompressing | ||||
| Current CPU Usage | 3,148% | 3,034% | 1,564% | 1,570% |
| Current Rating/Usage | 8.674 GIPS | 8.207 GIPS | 8.821 GIPS | 8.365 GIPS |
| Current Rating | 273.103 GIPS | 248.987 GIPS | 137.919 GIPS | 135.527 GIPS |
| Resulting CPU Usage | 3,134% | 3,036% | 1,567% | 1,564% |
| Resulting Rating/Usage | 8.643 GIPS | 8.242 GIPS | 8.820 GIPS | 8.663 GIPS |
| Resulting Rating | 270.917 GIPS | 250.233 GIPS | 138.223 GIPS | 135.448 GIPS |
| Total Rating | ||||
| Total CPU Usage | 2,926% | 2,882% | 1,479% | 1,478% |
| Total Rating/Usage | 7.915 GIPS | 7.387 GIPS | 8.836 GIPS | 8.564 GIPS |
| Total Rating | 233.094 GIPS | 214.163 GIPS | 130.648 GIPS | 126.671 GIPS |
UL Procyon
UL Procyon AI Inference is designed to gauge a workstation’s performance in professional applications. It should be noted that this test does not leverage multiple CPU capabilities. Specifically, this tool benchmarks the workstation’s ability to handle AI-driven tasks and workflows, providing a detailed assessment of its efficiency and speed in processing complex AI algorithms and applications.
UL Procyon shows a tighter spread, but the overall hierarchy still favors the Ryzen 9 chips. The 9950X3D2 posts the top overall AI Computer Vision score at 271, about 23% ahead of the 9950X3D, while the 9950X3D itself remains 5% ahead of the 9850X3D and 17% ahead of the 9800X3D. Model-level results are more mixed, particularly in lighter tasks like MobileNet V3. Still, the two Ryzen 9 parts pull further apart in heavier inference workloads such as YOLO V3 and REAL-ESRGAN.
| UL Procyon (higher score & lower ms is better) | AMD Ryzen 9 9950X3D2 | AMD Ryzen 9 9950X3D | AMD Ryzen 7 9850X3D | AMD Ryzen 7 9800X3D |
|---|---|---|---|---|
| Overall AI Computer Vision Score | 271 | 220 | 209 | 188 |
| MobileNet V3 | 0.97 ms | 0.94 ms | 0.70 ms | 0.61 ms |
| ResNet 50 | 3.76 ms | 5.33 ms | 5.95 ms | 7.01 ms |
| Inception V4 | 13.90 ms | 17.12 ms | 19.34 ms | 22.28 ms |
| DeepLab V3 | 19.26 ms | 21.70 ms | 20.40 ms | 23.98 ms |
| YOLO V3 | 24.93 ms | 35.27 ms | 48.17 ms | 56.07 ms |
| REAL-ESRGAN | 1,593.81 ms | 2,037.51 ms | 2,348.97 ms | 2,728.62 ms |
PCMark10
PCMark 10 evaluates CPU performance by simulating real-world office productivity tasks like word processing, web browsing, video conferencing, and spreadsheet calculations. The benchmark combines workloads that reflect the demands of modern workplaces, providing a comprehensive assessment of how a CPU handles day-to-day applications.
PCMark 10 compresses the gap more than any of the heavier compute-focused tests. Interestingly, the non-D2 Ryzen 9 9950X3D actually posts the highest overall score at 10,849, edging out the 9950X3D2 by about 1.8%. Even so, both Ryzen 9 chips remain ahead of the Ryzen 7 9850X3D and 9800X3D, showing that everyday productivity performance is broadly strong across the stack with only small differences at the top.
| PCMark10 (higher is better) | AMD Ryzen 9 9950X3D2 | AMD Ryzen 9 9950X3D | AMD Ryzen 7 9850X3D | AMD Ryzen 7 9800X3D |
|---|---|---|---|---|
| Overall Score | 10,650 | 10,849 | 10,461 | 10,250 |
SPECworkstation 4.4.0
SPECworkstation 4 specializes in benchmarks designed to test all key aspects of workstation performance. It uses over 30 workloads to test CPU, graphics, I/O, and memory bandwidth. The workloads fall into broader categories, including Media and Entertainment, Financial Services, Product Development, Energy, Life Sciences, and General Operations. We will list each broad-category result instead of the individual workloads. The results are averages of all individual workloads in each category.
In SPECworkstation 4.4.0, the 9950X3D2 leads most categories, but the non-D2 9950X3D remains firmly in second and well ahead of the Ryzen 7 parts in most professional workloads. In AI & Machine Learning, the 9950X3D2 scores 3.96, about 20% ahead of the 9950X3D, while the 9950X3D still leads the 9850X3D by roughly 12%. Some categories tighten considerably, such as Media & Entertainment and Life Sciences, but the overall pattern still puts the two Ryzen 9 chips ahead.
| SPECworkstation 4.4.0 (higher is better) | AMD Ryzen 9 9950X3D2 | AMD Ryzen 9 9950X3D | AMD Ryzen 7 9850X3D | AMD Ryzen 7 9800X3D |
|---|---|---|---|---|
| AI & Machine Learning | 3.96 | 3.30 | 2.95 | 2.92 |
| Energy | 3.22 | 2.66 | 2.20 | 2.13 |
| Financial Services | 2.63 | 2.48 | 1.42 | 1.42 |
| Life Sciences | 2.62 | 2.71 | 2.11 | 2.15 |
| Media & Entertainment | 3.39 | 3.34 | 2.56 | 2.57 |
| Product Design | 2.75 | 2.43 | 2.14 | 2.08 |
| Productivity & Development | 1.39 | 1.28 | 1.14 | 1.12 |
Conclusion
The AMD Ryzen 9 9950X3D2 is not just an iteration; it is the point where AMD fully resolves the trade-offs that defined earlier X3D designs. By eliminating the asymmetric cache layout and extending 3D V-Cache across both CCDs, AMD has transformed what was once a situational advantage into a consistent, system-wide benefit. Every core now has equal access to a massive 192MB L3 pool, removing scheduling penalties and delivering the predictability high-end workloads demand.
The 9950X3D2 led in nearly every benchmark. Whether in heavily threaded compute like y-cruncher, rendering in Cinebench, or compression in 7-Zip, the 9950X3D2 repeatedly edges ahead of the 9950X3D. The gains span across nearly every category, reinforcing that this refinement meaningfully improves sustained performance rather than chasing peak numbers.
At the platform level, it also represents the ceiling of what AM5 can currently deliver. With drop-in compatibility, it gives existing users a clear upgrade path to the most balanced high-end desktop CPU AMD has produced to date. The higher 200W TDP and cooling requirements are the only real trade-offs, but they are proportional to the level of performance it offers.
Ultimately, the 9950X3D2 earns its place not by redefining the category, but by perfecting it. It takes the hybrid identity of X3D processors, part gaming chip, part workstation CPU, and removes the friction between those roles. For users who want top-tier gaming performance without sacrificing multithreaded capability, or vice versa, this is the first X3D processor to truly deliver on both fronts.


 Amazon