

AMD continues to evolve its high-end desktop lineup with the new Ryzen Threadripper 9980X and 9970X. Built on the latest Zen 5 architecture, these new chips are targeted at professional users working in multithreaded environments like 3D rendering, video production, software compiling, and scientific workloads. They also mark the latest entries into the TRX50 platform, AMD’s enthusiast-class infrastructure that bridges workstation-grade performance with desktop accessibility. The TRX50 offers overclocking support, PCIe Gen5, and quad-channel DDR5, making it a more cost-efficient option for users who don’t need the complete feature set of the WRX90 platform.
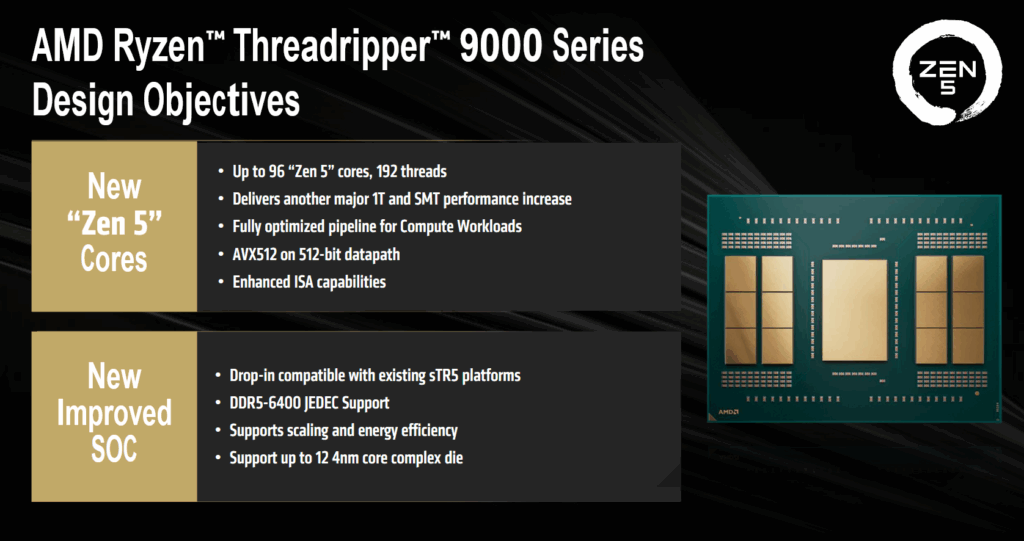
While the model names are familiar, the new Threadripper CPUs bring notable changes under the hood. The 9980X comes with a 64-core, 128-thread layout using a 12+1 CCD (core complex die) configuration; that’s twelve compute CCDs paired with a single I/O die, in line with AMD’s chiplet-based scaling for top-end parts. The 9970X trims this back to a 32-core, 64-thread setup via a 6+1 CCD layout.
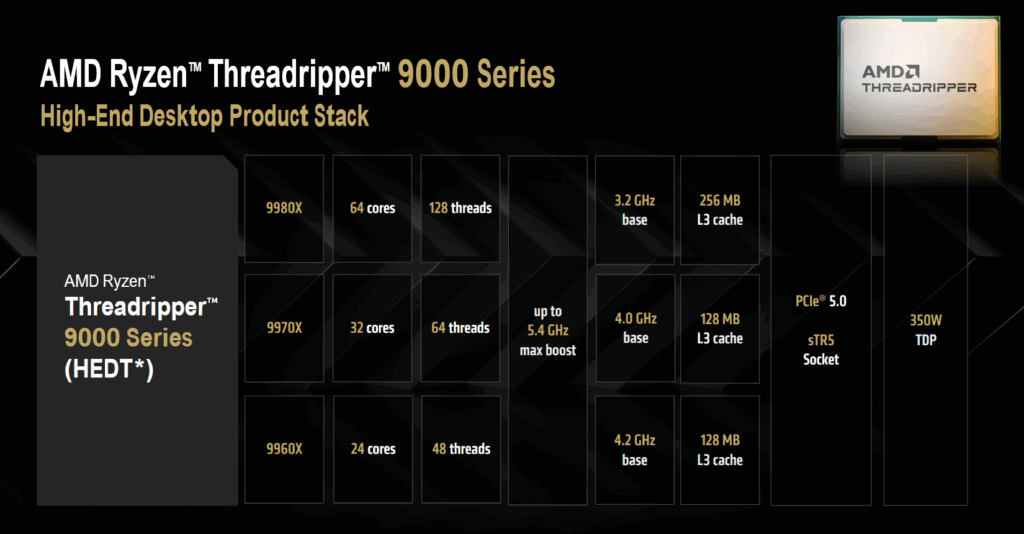
Both CPUs are built on AMD’s latest Zen 5 architecture, manufactured on a 4nm process, and feature support for AVX-512 with full 512-bit data paths, a first for this Threadripper class. Boost clocks reach up to 5.4GHz, paired with up to 256MB of L3 cache, and platform support includes 80 lanes of PCIe Gen 5 and quad-channel DDR5-6400 memory, giving these chips ample bandwidth and I/O to handle demanding creative and simulation workloads.
AMD Threadripper 9980X and 9970X: Zen 5 Architecture and Platform
The Zen 5 architecture brings some significant refinements that mean measurable performance gains across professional workloads. At the core is a redesigned front-end with improved branch prediction, wider instruction dispatch, and more efficient scheduling, all of which contribute to better instruction throughput. The architecture’s updated execution engine features wider integer and floating-point pipelines, enabling higher throughput and support for newer data types, which is particularly useful for compute-intensive workloads.
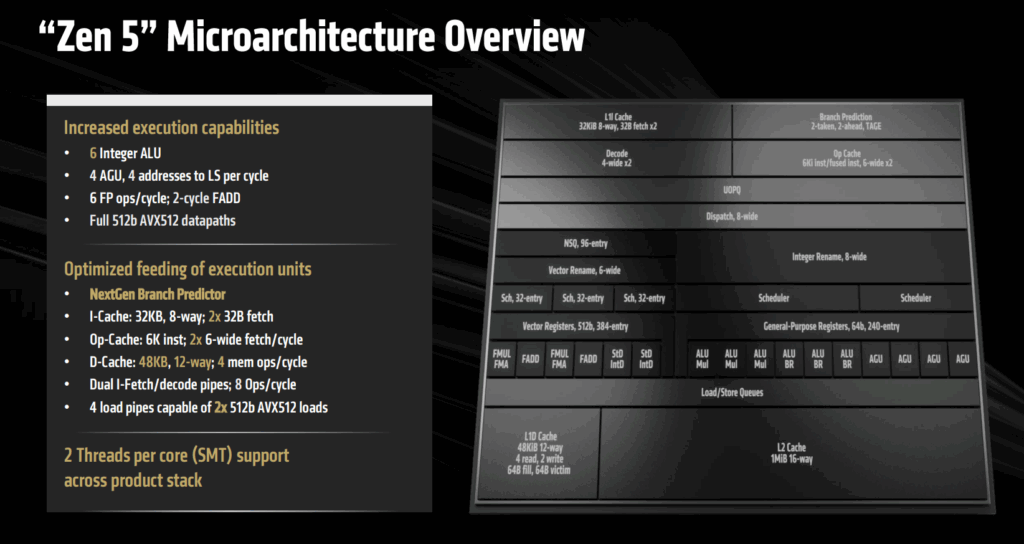
Zen 5 also introduces a fully optimized AVX-512 implementation with native 512-bit execution (previously, AVX-512 was supported in a split 256-bit mode across two cycles in Zen 4), bringing high-throughput vector processing to the mainstream Threadripper line for the first time. That’s especially valuable in scientific and engineering applications, where floating-point intensity is high. Supporting this architecture is a more responsive cache hierarchy, with each CCD offering up to 32MB of L3 and faster access via improved L1/L2 structures and a wider load/store engine.
The platform also retains socket sTR5, which means backward compatibility in terms of mounting and infrastructure, though TRX50 and WRX90 motherboards will dictate broader support. TRX50 supports 4-channel DDR5-6400 memory and 80 PCIe Gen5 lanes, while WRX90 scales up to 8-channel memory and 128 PCIe Gen5 lanes for truly bandwidth-bound environments. ECC RDIMM memory is supported across both platforms.
Power management has also improved thanks to Zen 5’s improved power gating and more granular boost behavior. These enhancements help to maintain higher sustained frequencies under load while also providing better efficiency scaling in idle or lightly threaded scenarios.
AMD Ryzen Threadripper 9000 Series Zen5 SKUs
The Ryzen Threadripper 9000 series brings Zen 5 to both HEDT and workstation markets through two product lines: the standard “X” SKUs (e.g., 9980X, 9970X, 7960X), and the “WX” PRO variants (up to 96 cores in the 7995WX). While core counts remain similar to the previous generation, Zen 5 allows for higher clock speeds and stronger per-core performance across the board. All SKUs have a 350W TDP and support overclocking on supported motherboards.
It’s important to note that none of the Threadripper 9000 CPUs feature integrated graphics, meaning a discrete GPU is required for any display output.
| Model | # of CPU Cores | # of Threads | Max. Boost Clock | Base Clock | Default TDP |
| AMD Ryzen Threadripper 9980X | 64 | 128 | Up to 5.4GHz | 3.2GHz | 350W |
| AMD Ryzen Threadripper 9970X | 32 | 64 | Up to 5.4GHz | 4.0GHz | 350W |
| AMD Ryzen Threadripper 7980X | 64 | 128 | Up to 5.1GHz | 3.2GHz | 350W |
| AMD Ryzen Threadripper 7970X | 32 | 64 | Up to 5.3GHz | 4.0GHz | 350W |
| AMD Ryzen Threadripper 7960X | 24 | 48 | Up to 5.3GHz | 4.2GHz | 350W |
| AMD Ryzen Threadripper PRO 7995WX | 96 | 192 | Up to 5.1GHz | 2.5GHz | 350W |
| AMD Ryzen Threadripper PRO 7985WX | 64 | 128 | Up to 5.1GHz | 3.2GHz | 350W |
| AMD Ryzen Threadripper PRO 7975WX | 32 | 64 | Up to 5.3GHz | 4.0GHz | 350W |
| AMD Ryzen Threadripper PRO 7965WX | 24 | 48 | Up to 5.3GHz | 4.2GHz | 350W |
| AMD Ryzen Threadripper PRO 7955WX | 16 | 32 | Up to 5.3GHz | 4.5GHz | 350W |
| AMD Ryzen Threadripper PRO 7945WX | 12 | 24 | Up to 5.3GHz | 4.7GHz | 350W |
AMD Threadripper 9980X and 9970X: Potential Real-World Performance with Zen5
The use of AMD’s Zen 5 cores allows for a substantial improvement in per-core efficiency over Zen 4. According to AMD’s internal testing using a fixed-frequency (e.g., the noted 9980X 12+1 CCD configuration above), Zen 5 delivers an average ~16% IPC gain across a geomean of 10 workstation benchmarks. This reflects general improvements to core front-end efficiency, branch prediction, and scheduling. In workloads tied explicitly to AI and machine learning, AMD reports about a 25% improvement in SPEC Workstation tests that emphasize floating-point performance and inference-related tasks. These kinds of gains matter to users.

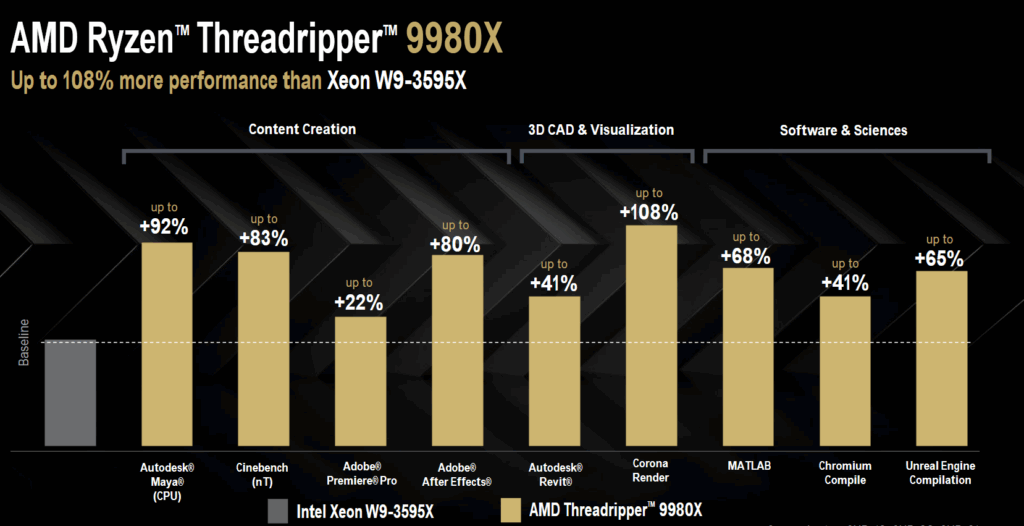
When making a direct comparison between AMD’s 64-core Threadripper 9980X and Intel’s 60-core Xeon W9-3595X, AMD claims substantial performance gains across a wide range of professional workloads. Applications like Autodesk Maya and Cinebench (nT) see improvements of up to 92% and 83%, highlighting the chip’s ability to handle multithreaded rendering and compute-heavy tasks.
In content creation, Adobe Premiere Pro and After Effects show reported gains of up to 22% and 80%. Visualization and 3D rendering workloads also benefit, with Autodesk Revit seeing up to 41% and Corona Render leading with a 108% uplift. On the software development side, MATLAB, Chromium compile, and Unreal Engine compilation show gains between 41% and 68%. These suggest that the 9980X can thrive in use cases with creative, engineering, and development tasks where high core utilization and efficiency matter.
For the 32-core Threadripper 9970X, AMD claims substantial performance gains against Intel’s 44-core Xeon W9-3575X, despite having fewer cores. In creative workloads, AMD reports up to 31% more performance in Adobe Premiere Pro and as much as 79% in After Effects. Maya and Cinebench (nT) also show solid gains, coming in at 26% and 18%. For CAD and visualization tasks, Autodesk Revit sees a 45% uplift, and Corona Render improves by 35%, pointing to consistent benefits in design and rendering.
The most significant leap is in MATLAB, where AMD reports a 137% gain, which means it offers a real advantage in simulation and scientific computing. On the development side, Unreal Engine compilation is up to 69% faster, and even Chromium compilation shows a minor but still measurable 10% bump. While we can’t verify all of these claims, we will, as always, see if there’s any truth to the performance numbers in our benchmarking and real-world testing.
AMD Threadripper 9980X and 9970X: Use Cases
The AMD Threadripper 9980X and 9970X CPUs are positioned for serious professional workloads, and the intended use cases span several high-demand areas. In 3D CAD environments, these chips are aimed at accelerating AI-assisted design workflows, complex 3D rendering, and product visualization pipelines. Their high thread count and strong floating-point performance make them well-suited for compute-heavy simulation tasks. Similarly, in the architectural visualization space, the CPUs are built to handle photorealistic rendering of large, complex models and support for immersive real-time walkthroughs and virtual reality previews, essential for modern design validation.
In the content creation world, AMD highlights support for heavy VFX pipelines, explicitly calling out 8K120 (high frame rate) workloads. This is ideal for real-time rendering in virtual production environments and virtual sets. AI-enhanced video processing, color grading, and transcoding also benefit from the new Threadripper’s architecture.
For software development, AMD mentions that they will pair well with local AI model development and fine-tuning for LLMs. AMD also calls out workloads such as oil and gas exploration, image and data processing, and coding assistance tools. These are areas where the multi-core performance and bandwidth of the 9980X and 9970X are expected to offer clear benefits, and historically, this is the case for Threadripper CPUs.
AMD Threadripper 9980X and 9970X: Overclocking with Zen 5
Overclocking support on the Threadripper 9000 series remains similar to previous generations, with Precision Boost Overdrive (PBO) adapting to the power delivery limits defined by the motherboard’s VRM and BIOS. Power thresholds like PPT, TDC, and EDC adjust automatically, while users can apply Auto-OC to raise boost frequency by up to 200 MHz. Zen 5’s improvements help here, especially with better branch prediction and reduced power state transition times, allowing boosts to sustain longer and recover faster. AMD’s Curve Optimizer is also available, providing per-core voltage tuning that helps improve frequency scaling or reduce heat, all while staying within the same power envelope.
Manual tuning is still viable, but AMD advises serious cooling and power capacity for stability. A 1500W power supply and high-end liquid cooler are recommended for users pushing the limits, as total power draw can exceed 800W under full load. Frequency can be adjusted across all cores or per CCX, and Zen 5 unifies per-CCX and per-CCD tuning behavior. Voltage can be set with either a static value or an offset, and users may benefit from fine-tuning SOC voltage once a stable overclock is found. Thanks to Zen 5’s optimizations around efficiency and scheduling, the Threadripper 9000 series is better equipped to maintain higher performance under heavy workloads with reduced thermal and voltage instability.
In our performance section below, we will determine if they are indeed a refinement of what Threadripper already does well, and if they deliver more for the same footprint.
Performance Testing
We’ll be testing the new AMD Ryzen Threadripper 9980X and 9970X CPUs on our established high-performance workstation platform built around the ASUS Pro WS TRX50-SAGE WIFI motherboard. This test bench has been previously used for evaluating last-generation Threadripper CPUs and high-end GPUs, making it an ideal foundation for consistent performance comparisons. The system is fully water-cooled, ensuring optimal thermal management during sustained heavy workloads.
StorageReview AMD ThreadRipper Test Platform
- Motherboard: ASUS Pro WS TRX50-SAGE WIFI
- RAM: 128GB DDR5 6400MT/s
- Storage: 2TB Samsung 980 Pro
- OS: Windows 11 Pro for Workstations and Ubuntu Server 24.04
Tested Threadripper CPUs
- Threadripper 9980X 64C
- Threadripper 9970X 34C
- Threadripper 7970X 32C
- Threadripper 7980X 64C
UL Procyon: AI Computer Vision Inference
UL Procyon AI Inference is designed to gauge a workstation’s performance in professional applications. It should be noted that this test does not utilize multiple CPU capabilities. Specifically, this tool benchmarks the workstation’s ability to handle AI-driven tasks and workflows, providing a detailed assessment of its efficiency and speed in processing complex AI algorithms and applications.
In UL Procyon’s AI Computer Vision tests, both new Threadrippers show significant improvement in inference times over the previous generation, particularly in complex models. The 9970X achieves the highest overall score of 240, followed by the 9980X at 222, well ahead of the 7980X’s 154 and 7970X’s 187.
| UL Procyon: AI Computer Vision Inference Times CPU (Lower is better) | Threadripper 9980X 64C | Threadripper 9970X 32C | Threadripper 7980X 64C | Threadripper 7970X 32C |
|---|---|---|---|---|
| MobileNet V3 | 3.58ms | 1.68ms | 3.66ms | 2.08ms |
| ResNet 50 | 5.09ms | 5.07ms | 6.33ms | 5.74ms |
| Inception V4 | 14.63ms | 13.50ms | 23.84ms | 21.35ms |
| DeepLab V3 | 19.76ms | 21.20ms | 31.22ms | 25.66ms |
| YOLO V3 | 21.71ms | 24.95ms | 32.44ms | 31.91ms |
| Real-ESRGAN | 1,122.61ms | 1,312ms | 2,059.92ms | 1,704.68ms |
| Overall Score (higher is better) | 222 | 240 | 154 | 187 |
SPECworkstation 4
The SPECworkstation 4.0 benchmark is a comprehensive tool that evaluates all key aspects of workstation performance. It offers a real-world measure of CPU, graphics, accelerator, and disk performance, ensuring professionals have the data to make informed decisions about their hardware investments. The benchmark includes a dedicated set of tests focusing on AI and ML workloads, including data science tasks and ONNX runtime-based inference tests, reflecting the growing importance of AI/ML in workstation environments. It encompasses seven industry verticals and four hardware subsystems, providing a detailed and relevant measure of the performance of today’s workstations.
In SPECworkstation 4.0.0, AMD’s new Threadripper 9980X (64-core) and 9970X (32-core) deliver noticeable gains over the previous generation. The 9980X consistently leads across heavily threaded workloads like Energy (6.88 vs. 5.75) and Financial Services (7.82 vs. 6.98) compared to the 7980X, showing a clear generational uplift. In AI & machine learning, it edges ahead at 4.28 vs. 3.56, while also pulling slightly ahead in Life Sciences and Media & Entertainment.
The 9970X, while having half the cores of the 9980X, still beats the 7970X across the board. Notably, it scores 3.00 in Productivity & Development, outperforming both 64-core chips, showing that lightly threaded tasks benefit from its higher clocks and lower core contention.
| SPECworkstation 4.0.0 (Higher is better) | Threadripper 9980X 64C | Threadripper 9970X 32C | Threadripper 7980X 64C | Threadripper 7970X 32C |
| AI & machine learning | 4.28 | 3.89 | 3.56 | 3.22 |
| Energy | 6.88 | 4.63 | 5.75 | 4.04 |
| Financial Services | 7.82 | 4.94 | 6.98 | 4.44 |
| Life Sciences | 4.70 | 3.77 | 4.17 | 3.38 |
| Media & Entertainment | 4.43 | 3.84 | 4.14 | 3.54 |
| Productivity & Development | 1.57 | 3.00 | 1.51 | 1.43 |
| Product Design | 3.56 | 1.54 | 3.23 | 2.74 |
3DMark CPU Profile
The 3DMark CPU Profile evaluates processor performance across six threading levels: 1, 2, 4, 8, 16, and max threads. Each test runs the same boid-based simulation workload to assess how well the CPU scales under different thread counts, with minimal GPU involvement. The benchmark helps identify single-thread efficiency as well as multithreaded potential for tasks like gaming, content creation, and rendering. Scores at eight threads often align with modern DirectX 12 gaming performance, while 1–4 thread results reflect older or esports game scenarios.
In 3DMark’s CPU Profile, AMD’s Threadripper 9980X and 9970X show clear generational gains over the 7980X and 7970X, particularly as thread count increases. At Max Threads, the 9980X reaches 30,442, a 21% increase over the 7980X’s 25,224, while the 9970X scores 23,771, up 15% from the 7970X.
Performance at 1 and 2 threads remains nearly identical across both generations, indicating AMD prioritized multithreaded scaling over single-thread improvements in this release.
At eight threads, gains start to separate more clearly, and by 16 threads, the 9970X leads the 9980X with a score of 17,049 versus 15,526. This likely reflects the 9970X’s higher boost behavior on fewer cores. When all cores are fully engaged, the 9980X pulls ahead decisively.
| 3DMark CPU Profile (Higher is better) | Threadripper 9980X 64C | Threadripper 9970X 32C | Threadripper 7980X 64C | Threadripper 7970X 32C |
| 1 Thread | 1,245 | 1,243 | 1,103 | 1,123 |
| 2 Threads | 2,477 | 2,471 | 2,136 | 2,193 |
| 4 Threads | 4,691 | 4,866 | 4,132 | 4,223 |
| 8 Threads | 9,041 | 9,071 | 7,285 | 7,482 |
| 16 Threads | 15,526 | 17,049 | 13,843 | 13,775 |
| Max Threads | 30,442 | 23,771 | 25,224 | 20,593 |
Geekbench 6
The Geekbench 6 cross-platform benchmark measures a system’s performance and provides a comparison score. It is designed to work on multiple platforms and offers consistent performance measurement across various devices, including smartphones, tablets, desktops, and servers.
In Geekbench 6, the new AMD CPUs show modest gains in single-core performance, with the 9980X and 9970X scoring 3,267 and 3,260, respectively. These are incremental improvements over the 7980X and 7970X, which landed at 2,956 and 2,940. The minimal gap here highlights AMD’s architectural refinement rather than a complete redesign.
Where things get interesting is in multi-core performance. The 9970X tops the chart with a score of 28,039, outpacing even the 64-core 9980X, which scores 26,621. This result suggests the 32-core part is boosting more aggressively under Geekbench’s test profile. Still, both chips deliver healthy gains over the previous gen, with the 7980X at 24,812 and the 7970X at 21,836.
| Geekbench 6 (higher is better) | Threadripper 9980X 64C | Threadripper 9970X 32C | Threadripper 7980X 64C | Threadripper 7970X 32C |
| Single Core | 3,267 | 3,260 | 2,956 | 2,940 |
| Multi-Core | 26,621 | 28,039 | 24,812 | 21,836 |
Blackmagic RAW Speed Test
We ran the Blackmagic RAW Speed Test to evaluate how well the new AMD CPUs handle Blackmagic RAW decoding tasks using only the CPU, as no GPUs were installed. This test measures performance across various resolutions and compression levels.
In the RAW Speed Test, the 9970X delivers the strongest performance in CPU-based 8K processing, reaching 202 FPS, slightly ahead of the 9980X at 187 FPS. The older 7980X lags at 151 FPS, while the 7970X nearly matches the newer 32-core chip at 197 FPS, likely due to similar clock behavior in this specific workload.
| RAW Speed Test | Threadripper 9980X 64C | Threadripper 9970X 32C | Threadripper 7980X 64C | Threadripper 7970X 32C |
| 8K CPU FPS | 187 | 202 | 151 | 197 |
PCMark 10
PCMark 10 is an industry-standard benchmark designed to measure complete system performance for modern office environments. It features updated workloads for Windows 10 and evaluates everyday tasks such as productivity, web browsing, video conferencing, and content creation. The benchmark is easy to run, delivers multi-level scoring (from high-level overall to detailed workload scores), and includes dedicated battery life and storage tests. While UL Solutions now recommends Procyon for newer, application-based testing, PCMark 10 remains a reliable and widely-used tool for assessing general PC performance.
In PCMark 10, the 9980X scores 9,406, with the 9970X just behind at 9,398. These results show a modest improvement over the 7980X’s 8,467 and the 7970X’s 8,614, with the new generation offering around a 10% gain.
The near-identical performance between the 64-core and 32-core models suggests that PCMark’s workloads rely more on clock speed and efficiency than raw core count. This trend is consistent across both generations.
| PCMark 10 (higher is better) | Threadripper 9980X 64C | Threadripper 9970X 32C | Threadripper 7980X 64C | Threadripper 7970X 32C |
| Score CPU | 9,406 | 9,398 | 8,467 | 8,614 |
Maxon Cinebench
Cinebench is a widely used benchmarking tool that measures the performance of CPUs and GPUs using Maxon Cinema 4D for rendering. It provides a score that allows you to compare the performance of different systems and components. We ran four popular versions of Cinebench so you can compare the results on popular leaderboards online.
In Cinebench 2024, the 9980X leads in multi-core performance with 6,429 points, a 15% improvement over the 7980X’s 5,575 points. The 9970X scores 4,083 points, up from the 7970X’s 3,571, marking a similar uplift for the 32-core models.
Single-core scores remain close across all chips. The 9970X leads at 128 points, followed closely by the 9980X at 126, while both last-gen chips score 115. This reflects modest architectural gains in per-core performance between generations.
| Cinebench 2024 (higher is better) | Threadripper 9980X 64C | Threadripper 9970X 32C | Threadripper 7980X 64C | Threadripper 7970X 32C |
| CPU (Multi Core) | 6,429 pts | 4,083 pts | 5,575 pts | 3,571 pts |
| CPU (Single Core) | 126 pts | 128 pts | 115 pts | 115 pts |
In Cinebench 2023, the 9980X scores 115,279 points in multi-core, a 15% gain over the 7980X’s 100,009, while the 9970X reaches 76,075, improving on the 7970X’s 64,916 by about 17%. This shows consistent scaling across both core tiers.
For single-core, performance remains stable across the new generation. The 9980X and 9970X both score just over 2,190 points, compared to 1,969 and 2,007 for the previous-gen models. These results confirm a modest generational bump in single-thread responsiveness, with more substantial gains on the multi-core side.
| Cinebench R23 (higher is better) | Threadripper 9980X 64C | Threadripper 9970X 32C | Threadripper 7980X 64C | Threadripper 7970X 32C |
| CPU (Multi Core) | 115,279 pts | 76,075 pts | 100,009 pts | 64,916 pts |
| CPU (Single Core) | 2,191 pts | 2,192 pts | 1,969 pts | 2,007 pts |
y-cruncher
y-cruncher is a multithreaded, scalable program that can compute Pi and other mathematical constants to trillions of digits. Since its launch in 2009, it has become a popular benchmarking and stress-testing application for overclockers and hardware enthusiasts.
In y-cruncher, the 9980X consistently outperforms the 7980X across all Pi computation sizes. At 10 billion digits, it completes in 88.97 seconds, an improvement of nearly 14 seconds over the 7980X’s 102.77 seconds. The 9970X also improves on the 7970X, though with smaller margins at larger data sets due to the lower core count.
At 1 billion digits, the 9970X finishes fastest at 7.25 seconds, edging out the 9980X, which leads only as the workloads scale past 10 billion digits. This reflects better boost behavior on lighter loads.
In the BBP tests, which are more memory- and cache-sensitive, the 9980X leads at all levels. For example, at 100 billion digits, it completes in 16.07 seconds, significantly faster than the 7980X’s 25.70 seconds and the 9970X’s 24.15 seconds. The gap widens even more against the 7970X, which trails at 41.89 seconds.
| y-cruncher Total Computation Time (Lower is Better) | Threadripper 9980X 64C | Threadripper 9970X 32C | Threadripper 7980X 64C | Threadripper 7970X 32C |
| 1 Billion PI | 8.032 seconds | 7.250 seconds | 9.288 seconds | 8.825 seconds |
| 2.5 Billion PI | 20.456 seconds | 19.577 seconds | 23.395 seconds | 23.810 seconds |
| 5 Billion PI | 41.962 seconds | 42.413 seconds | 48.924 seconds | 51.326 seconds |
| 10 Billion PI | 88.972 seconds | 92.795 seconds | 102.774 seconds | 111.965 seconds |
| 25 Billion PI | 249.660 seconds | 264.683 seconds | 284.471 seconds | 319.469 seconds |
| 1 Billion PI BBP | 0.213 seconds | 0.226 seconds | 0.293 seconds | 0.369 seconds |
| 10 Billion PI BBP | 1.522 seconds | 2.201 seconds | 2.358 seconds | 3.810 seconds |
| 100 Billion PI BBP | 16.070 seconds | 24.147 seconds | 25.701 seconds | 41.896 seconds |
Blender OptiX
Blender OptiX is an open-source 3D modeling application. This benchmark was run using the Blender Benchmark CLI utility. The score is measured in samples per minute, with higher values being better.
In Blender 4.3, the 9980X leads across all scenes, delivering 867.30 samples per minute in the Monster test, a 16% improvement over the 7980X’s 746.73. The 9970X also shows solid generational gains, scoring 503.43 versus the 7970X’s 440.73, an increase of around 14%.
Similar trends appear in the Junkshop and Classroom scenes. The 9980X maintains a clear lead at 620.86 and 429.83, while the 9970X scores 359.39 and 254.06, both outperforming their last-gen equivalents.
| Blender 4.3 CPU Samples Per Minute (Higher is Better) | Threadripper 9980X 64C | Threadripper 9970X 32C | Threadripper 7980X 64C | Threadripper 7970X 32C |
| Monster | 867.30 | 503.43 | 746.73 | 440.73 |
| Junkshop | 620.86 | 359.39 | 535.06 | 312.17 |
| Classroom | 429.83 | 254.06 | 378.69 | 224.50 |
7-Zip Compression Benchmark
The built-in memory benchmark in the 7-Zip utility measures the performance of a system’s CPU and memory during compression and decompression tasks, indicating how well the system can handle data-intensive operations. We run this test at a 128MB dictionary size when possible.
In the 7-Zip benchmark, total performance differences between generations are minimal. The 9970X slightly leads with a total rating of 376.30 GIPS, just ahead of the 9980X at 372.74. The previous-gen 7980X posts the highest result overall at 380.49 GIPS, with the 7970X close behind at 375.48 GIPS.
| 7-Zip Compression Benchmark (Higher is better) | Threadripper 9980X 64C | Threadripper 9970X 32C | Threadripper 7980X 64C | Threadripper 7970X 32C | |
| Compressing | |||||
| Current CPU Usage | 5,789% | 5,664% | 5,701% | 5,648% | |
| Current Rating / Usage | 5.283 GIPS | 5.361 GIPS | 5.251 GIPS | 5.257 GIPS | |
| Current Rating | 305.856 GIPS | 303.636 GIPS | 299.398 GIPS | 296.903 GIPS | |
| Resulting CPU Usage | 5,785% | 5,670% | 5,687% | 5,618% | |
| Resulting Rating / Usage | 5.286 GIPS | 5.352 GIPS | 5.210 GIPS | 5.269 GIPS | |
| Resulting Rating | 305.776 GIPS | 303.458 GIPS | 296.314 GIPS | 296.012 GIPS | |
| Decompressing | |||||
| Current CPU Usage | 6,150% | 6,258% | 6,254% | 6,335% | |
| Current Rating / Usage | 7.170 GIPS | 7.334 GIPS | 7.397 GIPS | 7.195 GIPS | |
| Current Rating | 440.961 GIPS | 458.971 GIPS | 462.602 GIPS | 455.836 GIPS | |
| Resulting CPU Usage | 6,177% | 6,123% | 6,144% | 6,309 | |
| Resulting Rating / Usage | 7.119 GIPS | 7.335 GIPS | 7.563 GIPS | 7.212 GIPS | |
| Resulting Rating | 439.708 GIPS | 449.133 GIPS | 464.659 GIPS | 454.943 GIPS | |
| Total Rating | |||||
| Total CPU Usage | 5,981% | 5,897% | 5,916% | 5,963% | |
| Total Rating / Usage | 6.202 GIPS | 6.343 GIPS | 6.387 GIPS | 6.240 GIPS | |
| Total Rating | 372.742 GIPS | 376.295 GIPS | 380.486 GIPS | 375.478 GIPS | |
vLLM workload
The vLLM benchmark simulates inference performance using large language models. It focuses on how well a CPU can manage token generation, latency, and overall throughput, while stressing concurrency, memory bandwidth, and scheduling. These are critical for local AI development and inference workloads where CPU-side performance still plays a role.
In the vLLM inference benchmark, the Threadripper 9980X delivers the fastest overall performance, completing the test in 193.05 seconds with a total token throughput of 175.20 tok/s. The 9970X follows at 231.56 seconds and 146.06 tok/s, a solid result that still marks a notable improvement over the previous 7970X, which trails at 263.07 seconds and 128.56 tok/s.
The 9980X also leads in latency metrics, with a mean time to first token (TTFT) of 6,235ms and a median TTFT of 2,789ms, compared to 7,350ms mean and 7,697ms median for the 9970X. While the 7980X offers similar TTFT to the 9980X, it lags in throughput and generation efficiency.
For sustained generation, the 9980X posts the lowest time per output token (TPOT) at 84.77ms, while the 9970X comes in at 102.06ms. The same trend holds for inter-token latency (ITL), where the 9980X leads with 85.18ms, compared to 102.28ms on the 9970
| Metric (lower duration / Higher tok/s is better) | Threadripper 9980X 64C | Threadripper 9970X 32C | Threadripper 7980X 64C | Threadripper 7970X 32C |
| Successful Requests | 16 | 16 | 16 | 16 |
| Benchmark Duration (s) | 193.05 | 231.56 | 234.98 | 263.07 |
| Total Input Tokens | 20,308 | 20,308 | 20,308 | 20,308 |
| Total Generated Tokens | 13,513 | 13,513 | 13,513 | 13,513 |
| Request Throughput (req/s) | 0.08 | 0.07 | 0.07 | 0.06 |
| Output Token Throughput (tok/s) | 70.00 | 58.36 | 57.51 | 51.37 |
| Total Token throughput (tok/s): | 175.20 | 146.06 | 143.93 | 128.56 |
| Time to First Token (TTFT) (lower latency is better) | ||||
| Mean TTFT (ms) | 6,235.77 | 7,350.04 | 6,015.70 | 9,368.04 |
| Median TTFT (ms) | 2,789.67 | 7,697.26 | 3,015.48 | 4,464.59 |
| P99 TTFT (ms) | 12,172.51 | 14,720.60 | 11,379.67 | 19,731.04 |
| Time per Output Token (TPOT, excl. 1st token) (lower latency is better) | ||||
| Mean TPOT (ms) | 84.77 | 102.06 | 104.14 | 114.59 |
| Median TPOT (ms) | 84.27 | 103.94 | 97.14 | 113.36 |
| P99 TPOT (ms) | 101.02 | 110.97 | 98.98 | 138.15 |
| Inter-token Latency (ITL) (lower latency is better) | ||||
| Mean ITL (ms) | 85.18 | 102.28 | 98.92 | 115.95 |
| Median ITL (ms) | 78.74 | 93.37 | 97.14 | 104.08 |
| P99 ITL (ms) | 80.60 | 95.01 | 98.92 | 105.74 |
Conclusion
With the Threadripper 9980X and 9970X, it’s pretty evident that Zen 5 brings a range of refinements that directly impact real-world workloads, which translate into significant gains. Take the Threadripper 9980X side by side with the previous 7980X: in UL Procyon AI inference, the 9980X improves complex model times, jumping its overall score from the 7980X’s 154 up to 222, making those MobileNet and Inception runs feel much faster. Over in SPECworkstation, it pulls ahead in areas like Energy and Financial Services, too, nudging past by roughly a point or more in each category. Cinebench multi-core shows similar results, such as a 15% increase over the old 64-core, while the 3DMark’s CPU Profile has the 9980X topping out at over 30,000 in the max-thread test versus about 25,000 for the 7980X.

The 9970X offers the same type of improvements over its 32-core predecessor, the 7970X. For example, in UL Procyon AI inference, it jumps from 187 to 240, and in SPECworkstation 4, it pulls ahead quite noticeably in the Productivity & Development suite. Geekbench 6 tells a similar story, where both single- and multi-core scores surpass those of the prior 32- and 64-core models, while real-world tests like Blackmagic RAW 8K decoding and y-cruncher Pi computations show the same consistent performance uplift. Ultimately, these benchmark results represent solid gains across AI, rendering, compression, and simulation tasks.
In the end, the Threadripper 9980X and 9970X don’t attempt to redefine what high-end desktop CPUs are, but they do push the architecture forward in meaningful ways. Rather than chasing higher core counts or major platform changes, AMD has focused on making Zen 5 more efficient, more responsive, and better at handling real-world workloads. The result is a pair of CPUs that are expected to offer stronger per-core performance and better overall compute density. So, if you’re running heavy creative or scientific workloads on HEDT hardware (or even if you’re simply an enthusiast who wants to get every ounce of performance out of your high-end rig), the 9980X and 9970X deliver a meaningful uplift that justifies an upgrade, even without extra cores.


 Amazon