

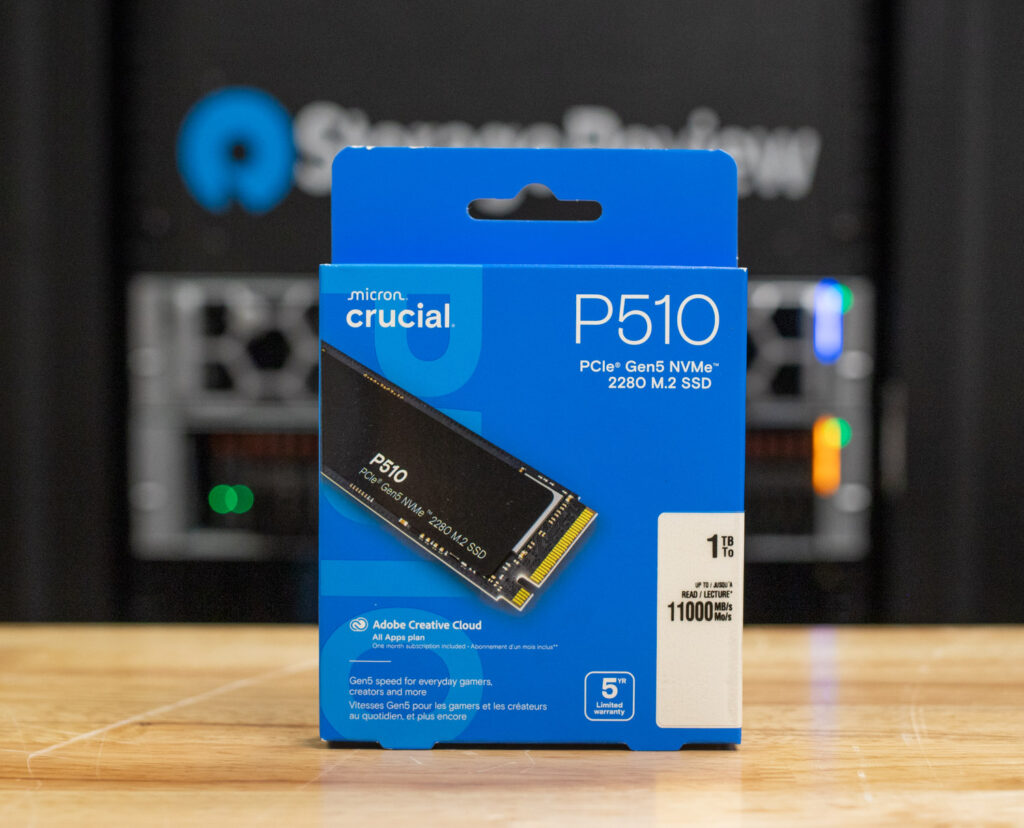
The Crucial P510 is the second PCIe Gen5 M.2 SSD to land in our lab, following the previously reviewed premium-tier Crucial T705. Unlike its high-performance sibling, the P510 takes a more value-focused approach. It targets users who want Gen5 speeds without breaking the bank, designing a drive that caters to notebooks and desktops, focusing on power efficiency, thermals, and broad compatibility. With the rise of AI workloads, large game asset pipelines, and high-resolution content creation, SSDs like the P510 are positioned to serve as a practical middle ground offering solid throughput at a more accessible price point. This review will show how the P510 performs across a range of real-world and synthetic tests, including AI model loading, DirectStorage, and traditional storage benchmarks.
Crucial P510 Specifications
| Specification | Micron Crucial P510 |
| Interface | PCIe 5.0 ×4 |
| Backward Compatibility | Yes |
| Form Factor | M.2 2280 |
| Heatsink Option | Yes |
| NAND Storage Memory | Micron G9 276-layer 3D NAND |
| Controller | Phison PS5031-E31T |
| Capacities | 1TB, 2TB |
| DRAM | Dram-less (uses Host Memory Buffer) |
| Sequential Read Speed (up to) | 11,000 MB/s |
| Sequential Write Speed (up to) | 9,500 MB/s |
| Random Read Speed (QD32) | 1.5M IOPS |
| Random Write Speed (QD32) | 1.5M IOPS |
| Management Software | Crucial Storage Executive |
| Data Encryption | None |
| Endurance (TBW) | 600 TBW per 1TB |
| Warranty | 5-year limited |
| US Launch Price | No Heatsink: 1TB: $119.99, 2TB: $199.99
Plus Heatsink: 1TB: $129.99, 2TB: $209.99 |
Crucial P510 Build and Design
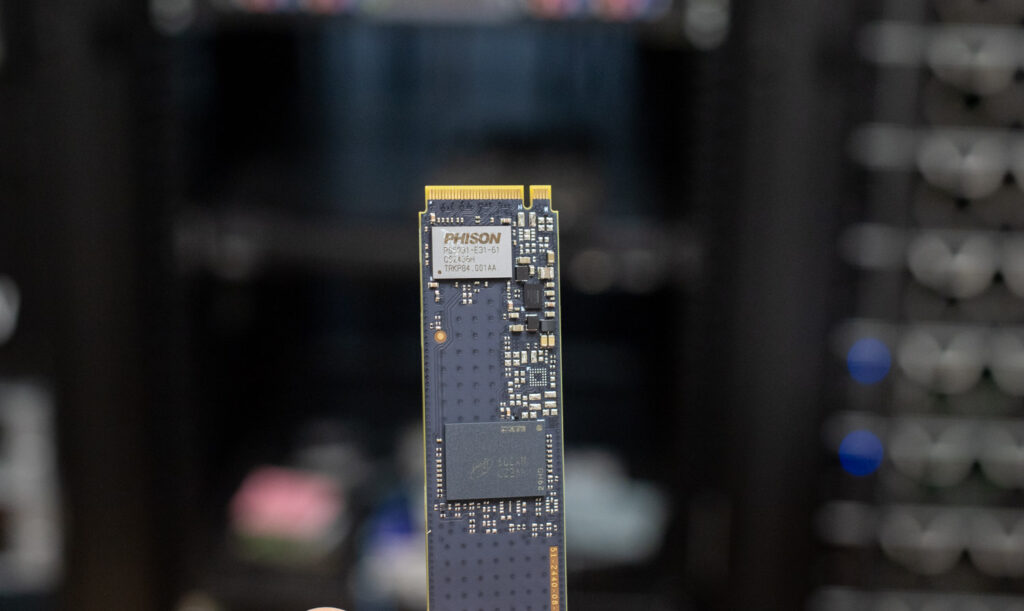
The Crucial P510 is built around Micron’s advanced G9 276-layer TLC NAND. It utilizes the Phison PS5031-E31T controller in a DRAM-less configuration, helping reduce power consumption by up to 25%—ideal for extending battery life in laptops and low-power environments. It comes in the standard M.2 2280 form factor with support for PCIe 5.0 ×4, while maintaining full backward compatibility with earlier PCIe generations.
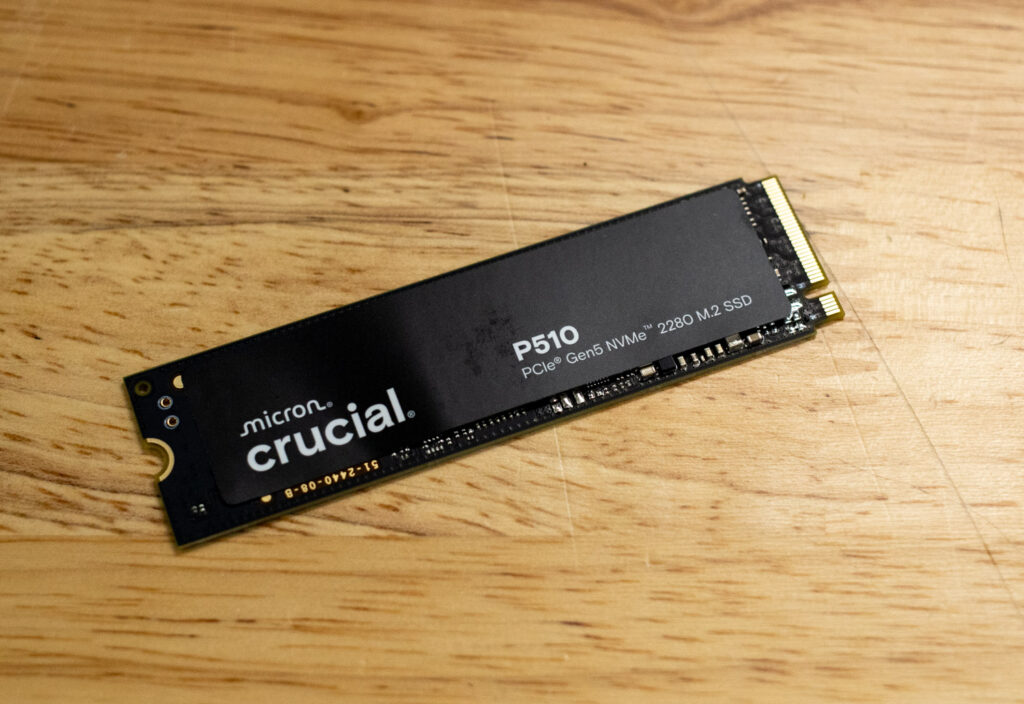
Endurance is rated at up to 600TBW per 1TB, making it suitable for general and heavy-use scenarios. Visually, the P510 features a sleek black PCB that fits cleanly into modern systems. Crucial offers desktop users an optional heatsink to help manage thermals during sustained workloads, ensuring consistent performance under heavier loads.
Management and Software Support
The Crucial P510 is supported by Crucial Storage Executive, a free software tool designed to help users monitor, manage, and optimize their SSDs. This utility lets users easily view drive health, check how much storage space has been used, track operating temperature, and update firmware for improved stability and performance. The software also allows for secure password resets and access to features like Momentum Cache, which can boost SSD operations by up to 10x by leveraging system memory to cache writes. Storage Executive enhances usability and ensures the P510 performs at its best throughout its lifecycle.
Crucial P510 Performance
Before diving into the benchmarks, here’s a list of comparable drives tested alongside the Micron Crucial P510 and their respective PCIe generation:
- Crucial P310 (PCIe Gen4)
- Crucial T705 (PCIe Gen5)
- Samsung 9100 Pro 4TB (PCIe Gen5)
- Samsung 990 Pro (PCIe Gen4)
- WD SN850X (PCIe Gen4)
We’ll test these drives to evaluate real-world and synthetic performance. This includes LLM load times to measure how quickly they handle large AI models. DirectStorage tests to see how fast they load game assets and process in-game data, and Blackmagic Design to assess read and write speeds for high-resolution video editing. We’ll also run PCMark 10 to gauge overall system responsiveness, 3DMark Storage to test gaming performance, and FIO tests to measure peak sequential and random read/write speeds under heavy workloads.
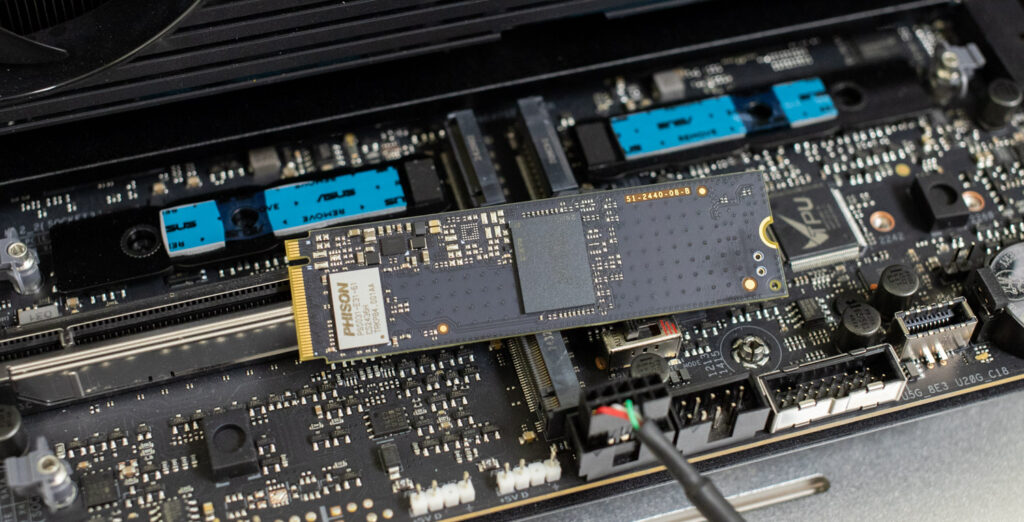
Here’s the high-performance test rig we used for benchmarking:
- CPU: AMD Ryzen 7 9800X3D
- Motherboard: Asus ROG Crosshair X870E Hero
- RAM: G.SKILL Trident Z5 Royal Series DDR5-6000 (2x16GB)
- GPU: NVIDIA GeForce RTX 4090
- OS: Windows 11 Pro, Ubuntu 24.10 Desktop
Peak Synthetic Performance
The FIO test is a flexible and powerful benchmarking tool used to measure the performance of storage devices, including SSDs and HDDs. It evaluates metrics such as bandwidth, IOPS (Input/Output Operations Per Second), and latency under different workloads, like sequential and random read/write operations. This test helps to assess the peak performance of storage systems, making it useful for comparing different devices or configurations. We measured the peak burst performance for this test, limiting the workload to a 10GB footprint on both SSDs.
In the FIO burst test, the Crucial P510 1TB delivers solid peak performance across workloads. It reaches 8,835 MiB/s for sequential reads and 9,961 MiB/s for sequential writes, beating the 990 Pro, P310, and SN850X in both categories. Latency remains low at 0.90 ms read and 0.80 ms write.
For 4K random operations, the P510 records 1.163M IOPS read and 1.196M IOPS write, with average latencies of 0.44 ms and 0.51 ms, respectively. While it doesn’t match the T705 or Samsung 9100 Pro, it outpaces the SN850X in throughput and latency.
| FIO Test (higher MB/s/IOPS Is better) | Crucial P310 2TB | Crucial P510 1TB | Crucial T705 2TB | Samsung 990 Pro 2TB | Samsung 9100 Pro 4TB | WD SN850X 2TB |
|---|---|---|---|---|---|---|
| Sequential 128K Read (2T/64Q) | 7,197 MB/s (1.16ms avg latency) | 8,835 MiB/s (0.90 ms avg latency) | 14,400 MB/s (0.58ms avg latency) | 7,483 MB/s (1.12ms avg latency) | 14,600 MB/s (0.57ms avg latency) | 6,632 MB/s (0.76ms avg latency) |
| Sequential 128K Write (2T/64Q) | 6,376 MB/s (1.31ms avg latency) | 9,961 MiB/s (0.80 ms avg latency) | 12,300 MB/s (0.68ms avg latency) | 7,197 MB/s (1.16ms avg latency) | 13,300 MB/s (0.63ms avg latency) | 7,235 MB/s (0.92ms avg latency) |
| Random 4K Read (16T/32Q) | 1.163M IOPS (0.80ms avg latency) | 1.163M IOPS (0.44ms avg latency) | 1.585M IOPS (0.32ms avg latency) | 1.400M IOPS (0.36ms avg latency) | 2.734M IOPS (0.18ms avg latency) | 1.2M IOPS (0.43ms avg latency) |
| Random 4K Write (16T/32Q) | 1.196M IOPS (0.43ms avg latency) | 1.196M IOPS (0.51ms avg latency) | 2.703M IOPS (0.19ms avg latency) | 1.403M IOPS (0.36ms avg latency) | 2.734M IOPS (0.19ms avg latency) | 825K IOPS (0.62ms avg latency) |
Average LLM Load Time
The Average LLM Load Time test evaluated the load times of three different LLMs: DeepSeek R1 7B, Meta Llama 3.2 11B, and DeepSeek R1 32B. Each model was tested 10 times, and the average load time was calculated. This test measures how quickly the drive can load large language models (LLMs) into memory. LLM load times are critical for AI-related tasks, especially for real-time inference and large dataset processing. Faster loading means the model can quickly process data, improving AI responsiveness and reducing waiting time.
The Crucial P510 1TB delivers competitive results across most models in the Average LLM Load Time test. It loads DeepSeek R1 7B in 2.8817 seconds, slightly behind the T705 (2.8758s) and Samsung 990 Pro (2.8758s), but ahead of the WD SN850X (3.0082s) and Crucial P310 (3.1889s). For Meta Llama 3.2 11B Vision, the P510 posts a time of 3.6631 seconds, which places it behind the top drives but still better than the P310 (3.7083s) and SN850X (3.6543s). It performs more strongly in the DeepSeek R1 32B load, completing it in 5.0594 seconds—faster than the T705 (5.1080s), 990 Pro (5.1080s), SN850X (5.4844s), and P310 (5.4844s), though behind the Samsung 9100 Pro (4.3735s).
Overall, the P510 shows solid performance, particularly with larger models where sustained throughput matters. While not leading in every test, it is a capable and efficient mid-tier SSD for AI workloads.
| Average LLM Load Time (lower is better) | Crucial P310 2TB | Crucial P510 1TB | Crucial T705 2TB | Samsung 990 Pro 2TB | Samsung 9100 Pro 4TB | WD SN850X 2TB |
| DeepSeek R1 7B | 3.1889s | 2.8817s | 2.8758s | 2.8758s | 2.6173s | 3.0082s |
| Meta Llama 3.2 11B Vision | 3.7083s | 3.6631s | 3.6312s | 3.6312s | 3.6017s | 3.6543s |
| DeepSeek R1 32B | 5.4844s | 5.0594s | 5.1080s | 5.1080s | 4.3735s | 5.4844s |
3DMark Direct Storage
The 3DMark DirectStorage Feature Test evaluates how Microsoft’s DirectStorage optimizes game asset loading on PCIe SSDs. By reducing CPU overhead and improving data transfer speeds, DirectStorage enhances loading times, especially when paired with GDeflate compression and Windows 11’s BypassIO. This test isolates storage performance to highlight the potential bandwidth improvements when DirectStorage is enabled.
In the 3DMark DirectStorage Feature Test, the Crucial P510 1TB shows solid performance gains, especially under GDeflate compression, with 19.63 GB/s for Storage to VRAM—well above the P310 (14.81 GB/s), 990 Pro (14.18 GB/s), and SN850X (15.28 GB/s). While it trails the Crucial T705 (25.75 GB/s) and Samsung 9100 Pro (23.77 GB/s), it remains competitive in compressed asset loading.
Uncompressed performance sees the P510 at 8.33 GB/s (DirectStorage on) and 6.92 GB/s (DirectStorage off), trailing others in that scenario. However, it rebounded in Storage to RAM, reaching 9.06 GB/s (DS on) and 7.49 GB/s (DS off)—outperforming several consumer drives. GDeflate decompression bandwidth is consistent with the pack at 66.22 GB/s, matching the rest of the field.
| 3DMark Direct Storage (higher is better) | Crucial P310 2TB | Crucial P510 1TB | Crucial T705 2TB | Samsung 990 Pro 2TB | Samsung 9100 Pro 4TB | WD SN850X 2TB |
| Storage to VRAM (GDeflate Compression) | 14.81 GB/s | 19.63 GB/s | 25.75 GB/s | 14.18 GB/s | 23.77 GB/s | 15.28 GB/s |
| Storage to VRAM (DirectStorage on, Uncompressed) | 10.75 GB/s | 8.33 GB/s | 10.71 GB/s | 11.28 GB/s | 11.26 GB/s | 11.11 GB/s |
| Storage to VRAM (DirectStorage off, Uncompressed) | 8.56 GB/s | 6.92 GB/s | 8.79 GB/s | 8.84 GB/s | 8.92 GB/s | 8.93 GB/s |
| Storage to RAM (DirectStorage on, Uncompressed) | 6.46 GB/s | 9.06 GB/s | 12.03 GB/s | 6.57 GB/s | 11.62 GB/s | 6.78 GB/s |
| Storage to RAM (DirectStorage off, Uncompressed) | 5.87 GB/s | 7.49 GB/s | 8.83 GB/s | 6.20 GB/s | 9.48 GB/s | 6.27 GB/s |
| GDeflate Decompression Bandwidth | 65.43 GB/s | 66.22 GB/s | 66.36 GB/s | 65.71 GB/s | 66.61 GB/s | 64.96 GB/s |
Blackmagic Disk Speed Test
The Blackmagic Disk Speed Test benchmarks a drive’s read and write speeds, estimating its performance, especially for video editing tasks. It helps users ensure their storage is fast enough for high-resolution content, like 4K or 8K video.
In the Blackmagic Disk Speed Test, the Crucial P510 1TB hits 7,853.9 MB/s read and 7,939.6 MB/s write, placing it well ahead of the P310, 990 Pro, and SN850X. While it doesn’t reach the top speeds of the Crucial T705 or Samsung 9100 Pro, it still offers strong performance for tasks like 4K and 8K video editing. The P510 is a fast, capable drive for creative workloads without jumping to flagship-tier pricing.
| Blackmagicdesign (higher is better) | Crucial P310 2TB | Crucial P510 1TB | Crucial T705 2TB | Samsung 990 Pro 2TB | Samsung 9100 Pro 4TB | WD SN850X 2TB |
| Read MB/s | 5,282.4 MB/s | 7,853.9 MB/s | 8,464.2 MB/s | 5,769.5 MB/s | 9,542.3 MB/s | 5,862.6 MB/s |
| Write MB/s | 5,458.9 MB/s | 7,939.6 MB/s | 10,256.4 MB/s | 5,842.9 MB/s | 9,907.9 MB/s | 5,894.8 MB/s |
PCMark10 Storage
PCMark 10 Storage Benchmarks evaluate real-world storage performance using application-based traces. They test the system and data drives, measuring bandwidth, access times, and consistency under load. These benchmarks provide practical insights beyond synthetic tests, helping users compare modern storage solutions effectively.
In the PCMark 10 Data Drive benchmark, the Crucial P510 1TB scores 6,450, landing just above the P310 (6,436) and well ahead of the WD SN850X (4,988). It falls short of the Samsung 990 Pro (7,173), Samsung 9100 Pro (7,552), and Crucial T705 (8,783), but still delivers solid performance for general application workloads. The P510 is a capable mid-range option with consistent responsiveness across typical data tasks.
| PCMark 10 Data Drive (higher is better) | Crucial P310 2TB | Crucial P510 1TB | Crucial T705 2TB | Samsung 990 Pro 2TB | Samsung 9100 Pro 4TB | WD SN850X 2TB |
| Overall Score | 6,436 | 6,450 | 8,783 | 7,173 | 7,552 | 4,988 |
3DMark Storage
The 3DMark Storage Benchmark tests your SSD’s gaming performance by measuring tasks like loading games, saving progress, installing game files, and recording gameplay. It evaluates how well your storage handles real-world gaming activities and supports the latest storage technologies for accurate performance insights.
In the 3DMark Storage Benchmark, the Crucial P510 1TB scores 4,148, outperforming the Crucial P310 (3,848), WD SN850X (3,962), and slightly edging out the Samsung 990 Pro (4,128). It trails the Crucial T705 (5,100) and Samsung 9100 Pro (4,779), but holds a strong mid-range position. The P510 offers competitive gaming performance, especially for tasks like loading, saving, and installing games, without the cost of top-tier drives.
| 3DMark Storage benchmark (higher is better) | Crucial P310 2TB | Crucial P510 1TB | Crucial T705 2TB | Samsung 990 Pro 2TB | Samsung 9100 Pro 4TB | WD SN850X 2TB |
| Overall Score | 3,848 | 4,148 | 5,100 | 4,128 | 4,779 | 3,962 |
GPU Direct Storage
One of the tests we conducted on this testbench was the Magnum IO GPU Direct Storage (GDS) test. GDS is a feature developed by NVIDIA that allows GPUs to bypass the CPU when accessing data stored on NVMe drives or other high-speed storage devices. Instead of routing data through the CPU and system memory, GDS enables direct communication between the GPU and the storage device, significantly reducing latency and improving data throughput.
How GPU Direct Storage Works
Traditionally, when a GPU processes data stored on an NVMe drive, the data must first travel through the CPU and system memory before reaching the GPU. This process introduces bottlenecks, as the CPU becomes a middleman, adding latency and consuming valuable system resources. GPU Direct Storage eliminates this inefficiency by enabling the GPU to access data directly from the storage device via the PCIe bus. This direct path reduces the overhead associated with data movement, allowing faster and more efficient data transfers.
AI workloads, especially those involving deep learning, are highly data-intensive. Training large neural networks requires processing terabytes of data, and any delay in data transfer can lead to underutilized GPUs and longer training times. GPU Direct Storage addresses this challenge by ensuring that data is delivered to the GPU as quickly as possible, minimizing idle time and maximizing computational efficiency.
In addition, GDS is particularly beneficial for workloads that involve streaming large datasets, such as video processing, natural language processing, or real-time inference. By reducing the reliance on the CPU, GDS accelerates data movement and frees up CPU resources for other tasks, further enhancing overall system performance.
Among the lineup of tested SSDs, the Crucial P510 1TB offers mid-tier performance that reflects its value-oriented positioning while still holding up reasonably well in GPU Direct Storage (GDS) workloads. At the 16K block size and a queue depth of 128, the P510 posts 2.3 GiB/s read (0.837ms, 152.2K IOPS) and 2.3 GiB/s write (0.842ms, 151.5K IOPS). These figures are competitive with drives like the Samsung 990 Pro and Crucial T705, which command higher pricing. As block sizes increase, the P510 continues to show respectable throughput: 4.5 GiB/s reads and 4.8 GiB/s writes at 128K, along with solid latency profiles (3.45ms and 3.26ms respectively). At the 1M block size, the P510 reaches 4.8 GiB/s read and 5.0 GiB/s write, again outpacing some consumer-focused options like the WD SN850X and holding close to premium or enterprise drives such as the Samsung 9100 Pro. While not the top performer in absolute terms, the P510 delivers balanced bandwidth and latency across all tested block sizes. It is a solid, cost-effective option for data-heavy AI workflows that benefit from GDS.
| GDSIO Chart (16K,128K,1M Block Size Averages) | Crucial P310 2TB | Crucial P510 1TB | Crucial T705 2TB | Samsung 990 Pro 2TB | Samsung 9100 Pro 4TB | WD SN850X 2TB |
|---|---|---|---|---|---|---|
| (16K Block Size 128 IO Depth) Average Read | 3.1 GiB/s (0.627ms) IOPS: 203.2K | 2.3 GiB/s (0.837ms) IOPS: 152.2K | 3.3 GiB/s (0.587ms) IOPS: 217.0K | 2.7 GiB/s (0.731ms) IOPS: 174.4K | 3.4 GiB/s (0.565ms) IOPS: 226.4K | 2.3 GiB/s (0.736ms) IOPS: 173.2K |
| (16K Block Size 128 IO Depth) Average Write | 2.2 GiB/s (0.902ms) IOPS: 141.4K | 2.3 GiB/s (0.842ms) IOPS: 151.5K | 2.3 GiB/s (0.836ms) IOPS: 152.6K | 2.2 GiB/s (0.903ms) IOPS: 141.2K | 2.3 GiB/s (0.839ms) IOPS: 161.7K | 2.0 GiB/s (0.989ms) IOPS: 129.0K |
| (128K Block Size 128 IO Depth) Average Read | 4.1 GiB/s (3.845ms) IOPS: 33.3K | 4.5 GiB/s (3.450ms) IOPS: 37.1K | 5.5 GiB/s (2.863ms) IOPS: 44.7K | 4.0 GiB/s (3.944ms) IOPS: 32.4K | 5.2 GiB/s (3.001ms) IOPS: 44.9K | 4.1 GiB/s (3.878ms) IOPS: 33.3K |
| (128K Block Size 128 IO Depth) Average Write | 3.9 GiB/s (3.992ms) IOPS: 32.0K | 4.8 GiB/s (3.262ms) IOPS: 39.2K | 5.6 GiB/s (2.799ms) IOPS: 45.7K | 4.1 GiB/s (3.849ms) IOPS: 33.2K | 5.9 GiB/s (2.662ms) IOPS: 47.3K | 4.0 GiB/s (3.958ms) IOPS: 33.0K |
| (1M Block Size 128 IO Depth) Average Read | 4.4 GiB/s (28.462ms) IOPS: 4.5K | 4.8 GiB/s (26.2181ms) IOPS: 4.9K | 6.0 GiB/s (20.738ms) IOPS: 6.2K | 3.9 GiB/s (32.415ms) IOPS: 3.9K | 6.3 GiB/s (19.877ms) IOPS: 6.4K | 4.4 GiB/s (30.501ms) IOPS: 4.5K |
| (1M Block Size 128 IO Depth) Average Write | 4.1 GiB/s (30.964ms) IOPS: 4.2K | 5.0 GiB/s (25.121ms) IOPS: 5.1K | 6.0 GiB/s (20.855ms) IOPS: 6.1K | 4.2 GiB/s (29.520ms) IOPS: 4.3K | 6.1 GiB/s (20.579ms) IOPS: 6.2K | 4.1 GiB/s (30.782ms) IOPS: 4.2K |
Conclusion
The Crucial P510 delivers a well-rounded PCIe Gen5 experience for users who need strong performance without the cost of flagship-tier solutions. It offers solid throughput, low latency, and efficient power usage, making it suitable for various workloads—from AI model handling and gaming to content creation. While it doesn’t lead in every metric, the P510 consistently performs above its class in key areas and maintains competitive thermals and reliability. For professionals and enthusiasts looking to adopt Gen5 speeds in desktop and mobile environments, the P510 represents a capable, cost-effective solution with broad appeal.


 Amazon