

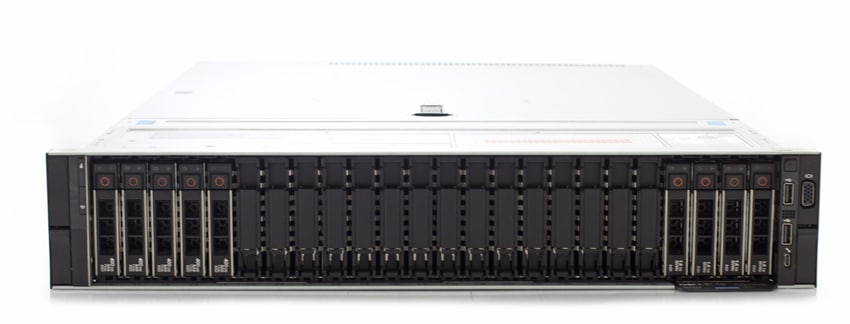
Earlier this year, Dell EMC released 2 new single-socket PowerEdge servers with AMD EPYC processors – the PowerEdge R6415 and the PowerEdge R7415. The PowerEdge R7415 is a 2U single-socket server with enterprise-class AMD EPYC processors available. Being a single-socket server, users can expect a cost savings in both lower licenses costs and power costs, resulting in a better TCO. Of course, AMD has also stated that the price of the CPU is lower than the two CPU counterparts, giving the R7415 access to new workloads where conventional dual-socket systems may not be ideal. The R7415 can be loaded with up to 24 NVMe drives that not only can bring a large performance boost but with the ever increasing density of these drives, can potentially offer incredible capacity. This would position the server ideally for use cases such as software defined storage (SDS) or business analytics.
While AMD EPYC processors offer many features, one of the most significant is its high PCIe lane count per CPU (128 PCIe lanes per single CPU). This is important for two reasons. First, it offers 3x more lanes than single socket x86 systems (only 48 lanes), allowing for more I/O per CPU. More importantly, it unlocks capabilities and performance previously available only in 2-socket architectures without the related overprovisioning. This also allows for new system configurations on a single socket server, focusing more on I/O capabilities.
In addition to leveraging EPYC’s high PCIe lane count, the unique design of the PowerEdge R7415 provides up to 12 direct-connect, hot-swap NVMe drives (maximum 24 drives with some switching). NVME drives pack a performance punch and emerging developments see them increasing density. So if one were to fully load the R7415 they should see a big boost in performance as well as a potentially very dense 2U server. Dell EMC goes on to state that, even fully loaded with 24 NVMe drives, the server still has enough lanes available to power 4 standard rear PCIe slots with an optional 2 x 10GE mezzanine card. Additionally, the PowerEdge R7415 can pack in 2TB of memory with its 16 DDR4 DIMM slots.
Leveraging AMD CPUs hasn’t changed the fundamental value proposition PowerEdge offers; the R7415 has the same features users enjoy and have come to expect from the PowerEdge line. This includes the feature-rich LifeCycle Controller, iDRAC, and OpenManage Mobile offerings. These support features can sway customers away from low-cost white box systems that don’t include the same depth-of-management capabilities. The R7415 also has security options built-in, with features such as cryptographically trusted booting and silicon root of trust.
Dell EMC PowerEdge R7415 Server Specifications
| Form Factor | 2U |
| CPU | AMD EPYC 7551P 2.00GHz/2.55GHz, 32C/64T, 64M Cache (180W) DDR4-2666 |
| Memory | 16 DDR4 2666MT/s RDIMM |
| Drive bays | |
| Front | Up to 24 x 2.5” SATA/SAS/NVMe or up to 12x 3.5” SAS/SATA HDD |
| Rear | Up to 2 x 3.5” SAS/SATA HDD |
| Storage Controllers | |
| Internal | Internal Controllers: PERC H330, H730p, H740p, HBA330 Boot Optimized Storage System: HW RAID 2 x M.2 + Internal USB + Internal Dual SD Module External PERC (RAID): H840 12Gbps PERC9 or 10 series, mini PERC x8 slot |
| Ports | |
| Front | Video, 2 x USB 2.0, dedicated iDRAC Direct Micro-USB |
| Rear | LOM: 2 x 1GE embedded + optional 2 x 1GE or 2 x 10GE LOM Mezzanine card |
| Other | Video, Serial 2 x USB 3.0, dedicated iDRAC network port; Optional hot swap 2 x 3.5” SAS/SATA drive bay (2.5” drives supported in hybrid drive carrier) |
| Riser options | Up to 4 x Gen3 slots – 2 x 16 FHFL PCIe slots and 2 x low profile slots (1 x8, 1 x16) |
| Supported OS | Microsoft Windows Server 2016 |
| Red Hat Enterprise Linux 7.4 | |
| VMware vSphere 2016 U1 (ESXi 6.5 U1) | |
| Microsoft Windows Server 2012 R2 | |
| Power | Titanium 750W, Platinum 495W, 750W, 1600W, and 1100W 240HVDC 750W, Hot Plug power supplies with full redundancy options |
Design and Build
As stated, the Dell EMC PowerEdge R7415 is a 2U server. Across the front of the device are the drive bays that fit up to 24 NVMe SSDs (there are configuration options for users that have different needs such as 3.5” drives). The left side of the device has the LED lights for system health and system ID as well as the iDRAC Quick Sync 2 indicator. The right side of the device has the power button, USB port, iDRAC Direct port, and VGA port.
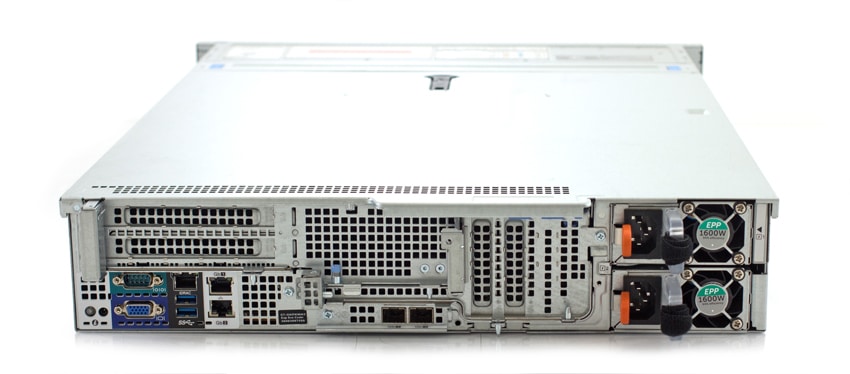
The rear of the server has the usual suspects such as removable PSUs on the right, 2 optional LAN ports are provided by a mezzanine card (2 x 1GE or 2 x 10GE) on the bottom middle two embedded 1GE LAN ports on the left, followed by two USB 3.0 ports, an iDRAC9 dedicated network port, a VGA port, a serial port, a CMA power port, and a system ID button. There are also blank spots for full-height PCIe expansion cards (for two 3.5” drives for instance), and two half-height PCIe expansion cards.
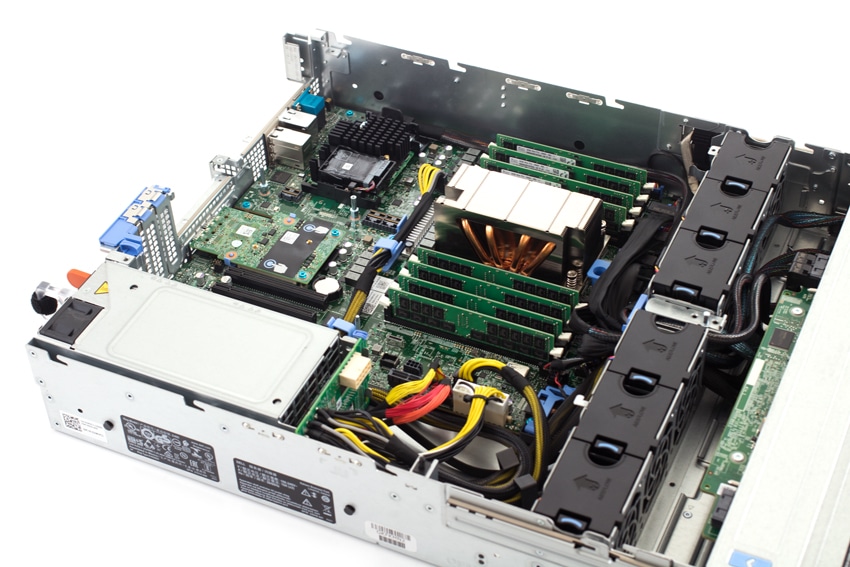
The server opens up easily to reveal the single AMD EPYC CPU roughly in the middle of the device. The 16 DIMM Slots are around the CPU (8 on each side). It also offers easy access to the PSUs, optional low-profile risers, optional mini PERC card, and the optional ability to add two 3.5” drives on the rear backplane.
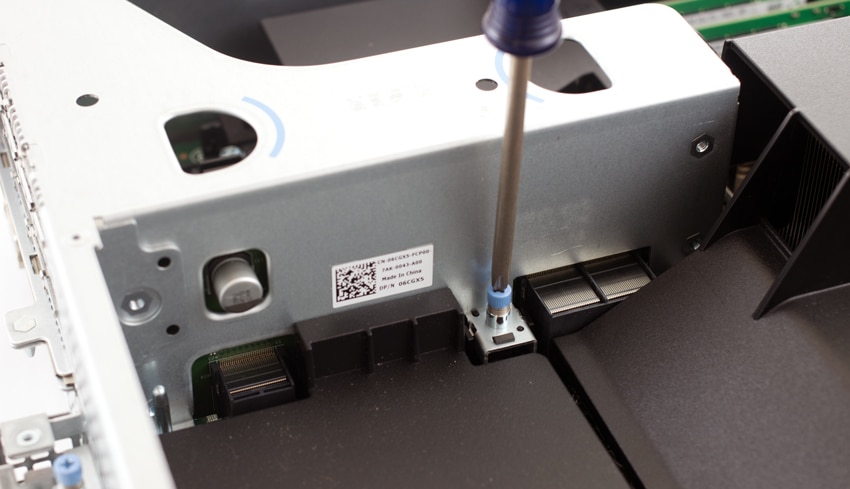
We are no strangers to PowerEdge servers; however, this is the first one we’ve seen in a while that didn’t have easy, tool-less access on the inside. That isn’t to say that it wasn’t still easy to access. It just took a few seconds longer than normal and seemed a bit odd, like a minuscule step backward.
Management
As with other PowerEdge Servers, the R7415 offers a wide range of management options. For a more in-depth look readers can check out our deep dive in the Dell EMC PowerEdge R740xd review and our look into Dell EMC’s OpenManage Mobile app.
Performance
The Dell PowerEdge R7415 our team reviewed came well-equipped with both SAS and NVMe flash. On the CPU front, this system included the 2GHz AMD EPYC 32-core/64-thread 7551P CPU and 256GB of DDR4. In our performance tests, we tested both the NVMe and SAS SSDs with our VDBench synthetic tests, configured in JBOD, and in our SQL Server and Sysbench tested focused on NVMe performance only. Workloads were spread out evenly across all drives.
SQL Server Performance
StorageReview’s Microsoft SQL Server OLTP testing protocol employs the current draft of the Transaction Processing Performance Council’s Benchmark C (TPC-C), an online transaction processing benchmark that simulates the activities found in complex application environments. The TPC-C benchmark comes closer than synthetic performance benchmarks to gauging the performance strengths and bottlenecks of storage infrastructure in database environments.
Each SQL Server VM is configured with two vDisks: 100GB volume for boot and a 500GB volume for the database and log files. From a system resource perspective, we configured each VM with 16 vCPUs, 64GB of DRAM and leveraged the LSI Logic SAS SCSI controller. While our Sysbench workloads tested previously saturated the platform in both storage I/O and capacity, the SQL test looks for latency performance.
This test uses SQL Server 2014 running on Windows Server 2012 R2 guest VMs, and is stressed by Dell’s Benchmark Factory for Databases. While our traditional usage of this benchmark has been to test large 3,000-scale databases on local or shared storage, in this iteration we focus on spreading out four 1,500-scale databases evenly across our servers.
SQL Server Testing Configuration (per VM)
- Windows Server 2012 R2
- Storage Footprint: 600GB allocated, 500GB used
- SQL Server 2014
- Database Size: 1,500 scale
- Virtual Client Load: 15,000
- RAM Buffer: 48GB
- Test Length: 3 hours
- 2.5 hours preconditioning
- 30 minutes sample period
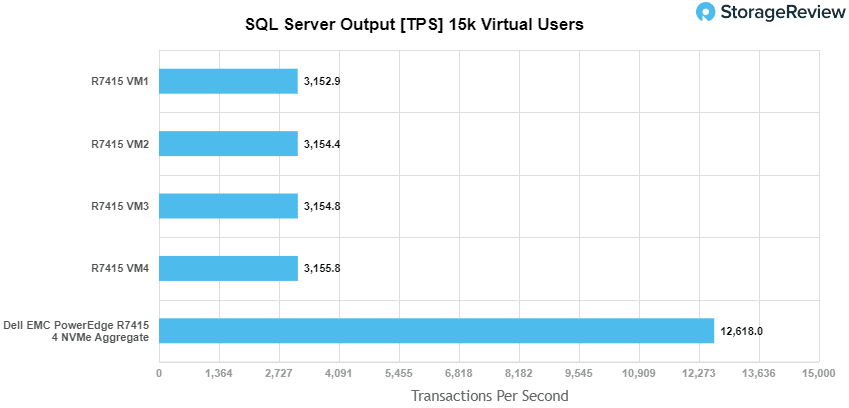
For SQL Server, we looked at individual VMs as well as aggregate scores. The transactional results showed an aggregate score of 12,618.1 TPS with individual VMs ranging from 3,152.9 TPS to 3,155.8 TPS.
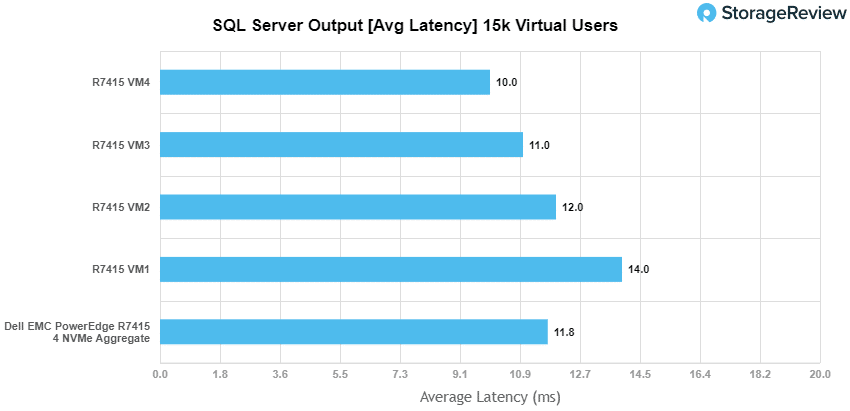
With average latency, the R7415 gave an aggregate score of 11.75ms with individual VMs running between 10ms and 14ms.
Sysbench MySQL Performance
Our first local-storage application benchmark consists of a Percona MySQL OLTP database measured via SysBench. This test measures average TPS (Transactions Per Second), average latency, and average 99th percentile latency as well.
Each Sysbench VM is configured with three vDisks: one for boot (~92GB), one with the pre-built database (~447GB), and the third for the database under test (270GB). From a system resource perspective, we configured each VM with 16 vCPUs, 60GB of DRAM and leveraged the LSI Logic SAS SCSI controller.
Sysbench Testing Configuration (per VM)
- CentOS 6.3 64-bit
- Percona XtraDB 5.5.30-rel30.1
- Database Tables: 100
- Database Size: 10,000,000
- Database Threads: 32
- RAM Buffer: 24GB
- Test Length: 3 hours
- 2 hours preconditioning 32 threads
- 1 hour 32 threads
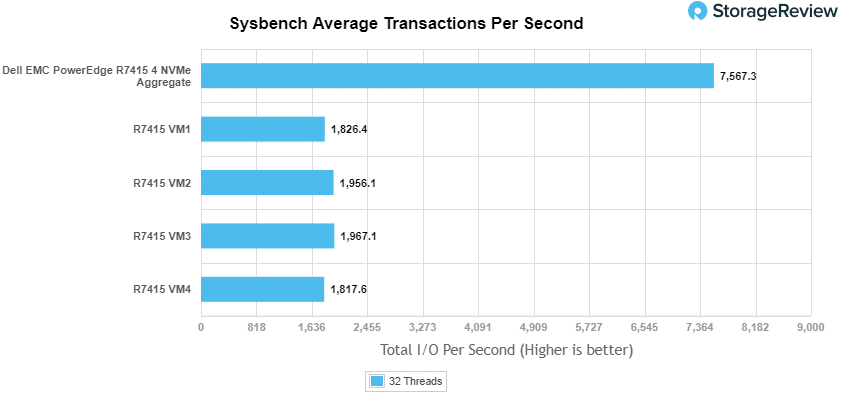
In our Sysbench benchmark, we tested the R7415 with a similar layout to the above. For transactional performance, the sever had an aggregate average TPS of 7,567.3 with individual VMs ranging from 1,817.6 TPS to 1,967.1 TPS.
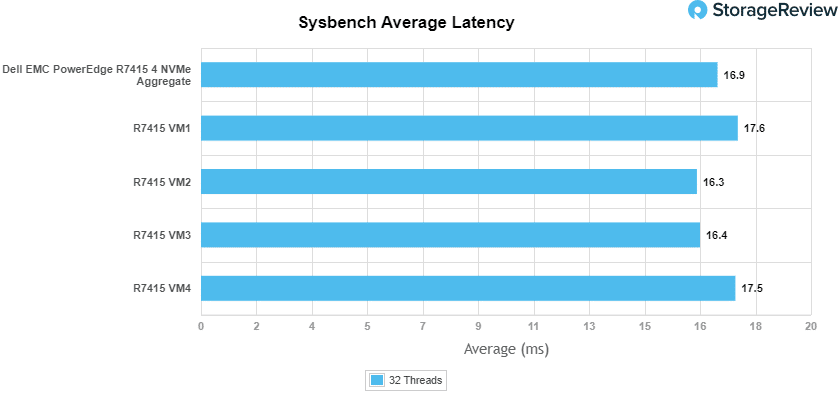
With Average latency, the R7415 had an aggregate latency of 16.9ms, with individual VMs hitting latencies of 16.3ms to 17.6ms.
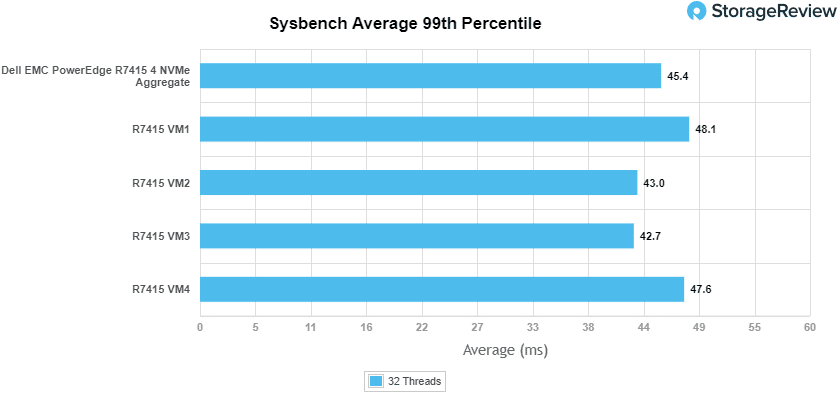
In our worst-case 99th percentile latency measurement, the server hit an aggregate score of 45.4ms with individual VMs ranging from 42.7ms to 48.1ms.
VDBench Workload Analysis
With the latest-and-greatest server, it is highly tempting to toss in the latest-and-greatest storage to get the biggest bang for the buck. However, not everyone is going to do this, and several users will be upgrading their servers with their existing storage or with lower-cost SAS-based flash. For our review, we populated the server with both NVMe and SAS storage for each benchmark. This isn’t a “which one is better” scenario, because from a performance perspective, the NVMe will win. This is more of a “what to expect with the given storage” scenario and should be looked at in this manner.
Our last section of local performance testing focuses in on synthetic-workload performance. In this area, we leveraged four SAS and four NVMe SSDs in a bare-metal environment running Ubuntu 16.04.4. The workload was configured to stress 25% of each drive’s capacity, focusing on sustained performance versus steady-state, worst-case performance.
When it comes to benchmarking storage arrays, application testing is best and synthetic testing comes in second place. While not a perfect representation of actual workloads, synthetic tests do help to baseline storage devices with a repeatability factor that makes it easy to do apples-to-apples comparison between competing solutions. These workloads offer a range of different testing profiles ranging from “four corners” tests, common database transfer size tests, as well as trace captures from different VDI environments. All of these tests leverage the common vdBench workload generator, with a scripting engine to automate and capture results over a large compute testing cluster. This allows us to repeat the same workloads across a wide range of storage devices, including flash arrays and individual storage devices.
Profiles:
- 4K Random Read: 100% Read, 128 threads, 0-120% iorate
- 4K Random Write: 100% Write, 64 threads, 0-120% iorate
- 64K Sequential Read: 100% Read, 16 threads, 0-120% iorate
- 64K Sequential Write: 100% Write, 8 threads, 0-120% iorate
- Synthetic Database: SQL and Oracle
- VDI Full Clone and Linked Clone Traces
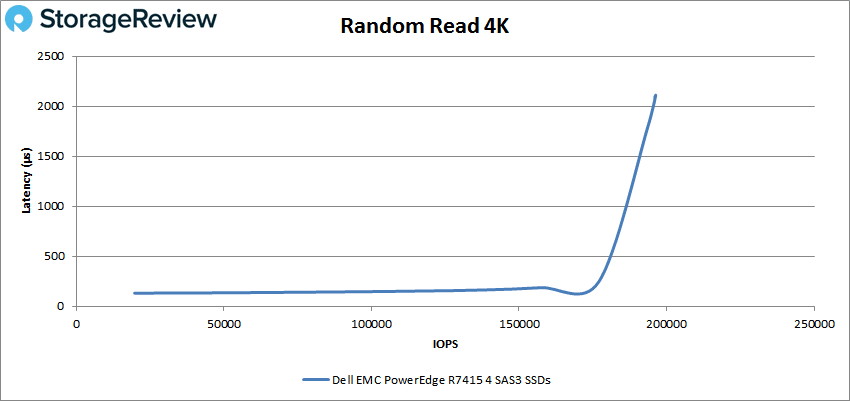
Looking at peak read performance for the SAS drives, the PowerEdge R7415 started at 19,686 IOPS with a latency of 132μs and stayed below 1ms until it hit roughly 180K IOPS and peaked at 196,299 IOPS with a latency of 2.11ms.
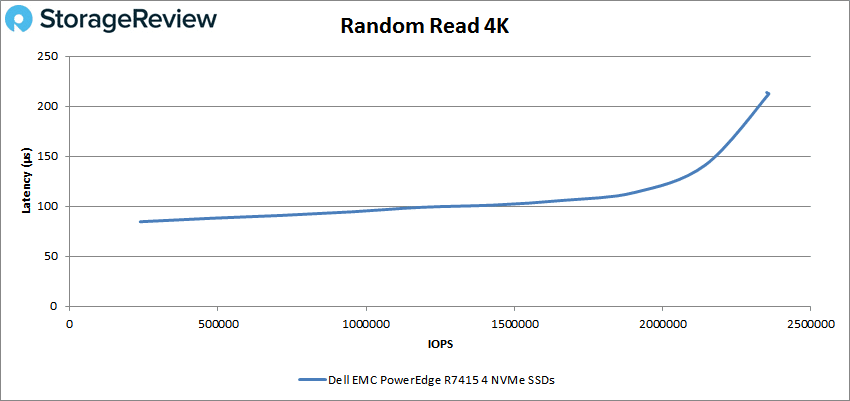
For peak read NVMe performance, the R7415 stayed below 1ms throughout, peaking at 2,358,609 IOPs with a latency of 212μs.
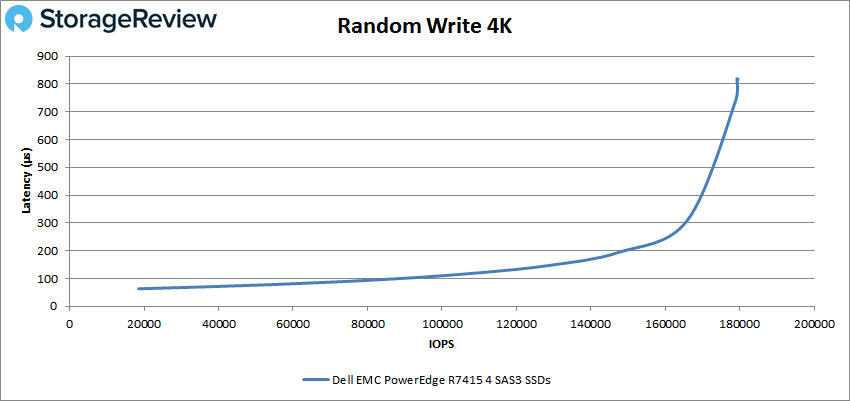
For peak SAS write performance, the R7415 had sub-millisecond throughout starting at 18,519 IOPS and peaking at 179,249 IOPS with a latency of 816μs.
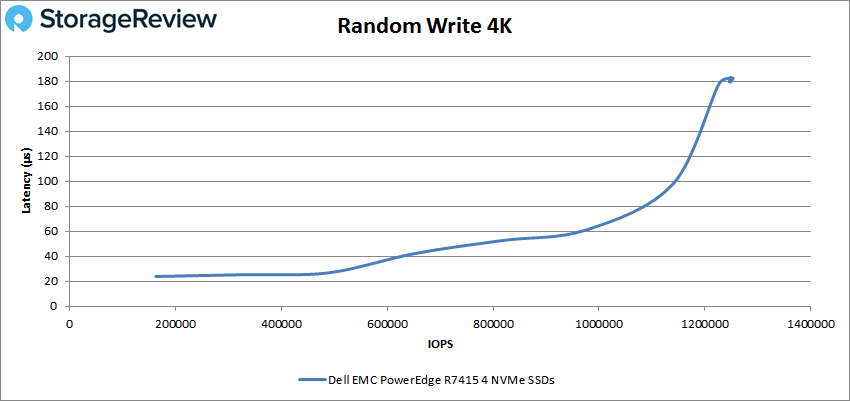
Peak NVMe write performance showed the server hitting 1,252,375 IOPS with a latency of 179μs.
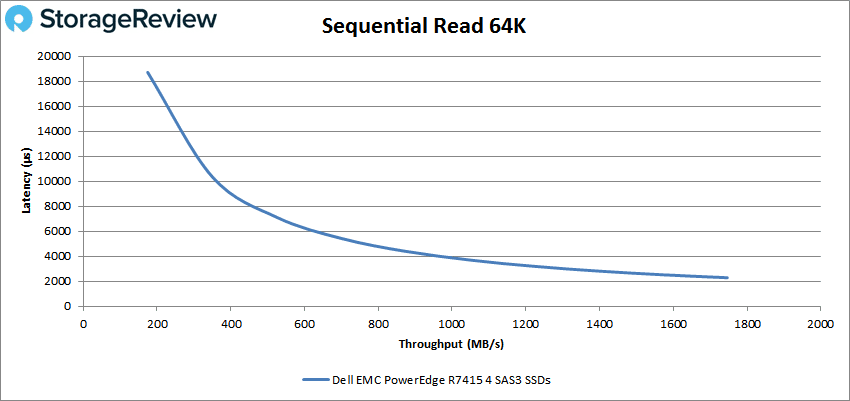
When we switch over to sequential benchmarks (64K), we see a bit of an odd performance from the SAS drives. With the 64K read, the performance starts off with high latency 18.7ms and drops off throughout as the performance improves, finishing at 27,865 IOPS or 1.74GB/s with a latency of 2.3ms.
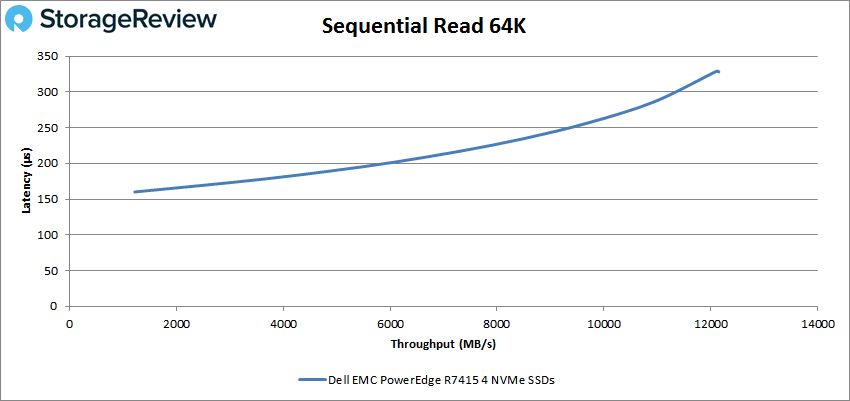
NVMe 64K read has the server hitting 193,835 IOPS or 12.1GB/s with the highest latency being 329μs.
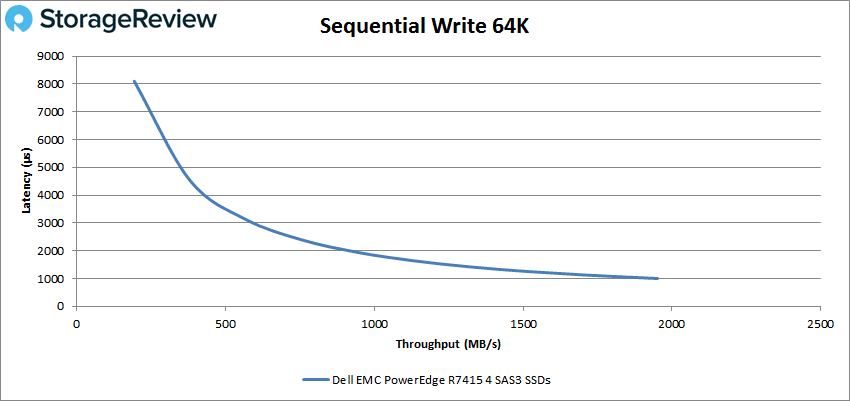
The 64K write with SAS showed similar performance, starting with a latency of 8.1ms and peaking at 1.95GB/s or 31,221 IOPS with a latency of 1ms.
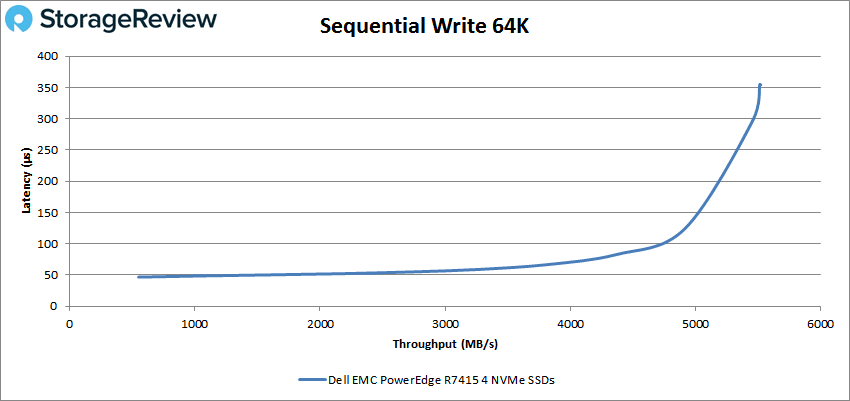
The 64K write performance of the NVMe actually had the server running about 50μs up until about 35K IOPS and peaking at 88,180 IOPS or 5.51GB/s with a latency of 355μs.
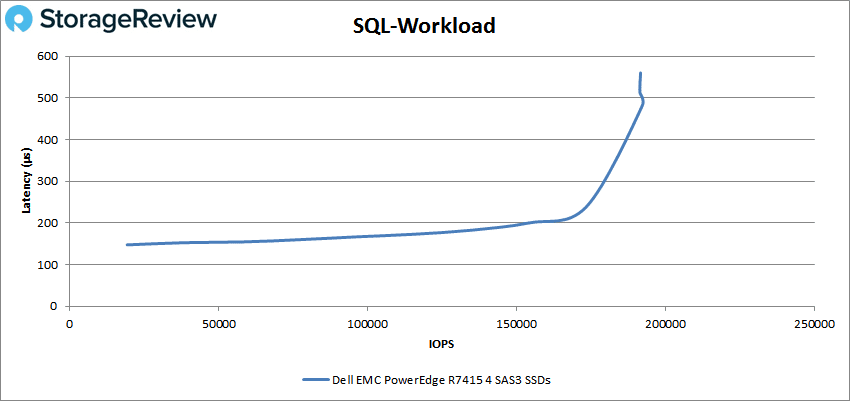
Switching over to our SQL workload, the SAS drives had a better overall showing with sub-millisecond latency throughout, peaking at about 193K IOPS with a latency of 481μs.
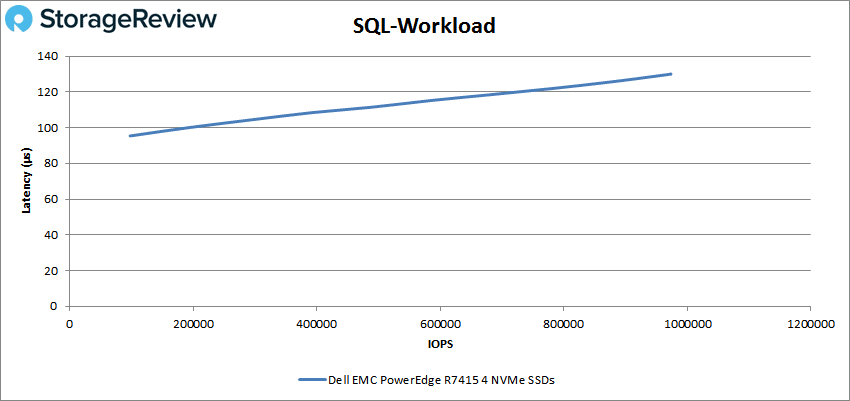
For the SQL results of the NVMe in the R7415, we saw a peak performance of 973,568 IOPS with a latency of just 130μs.
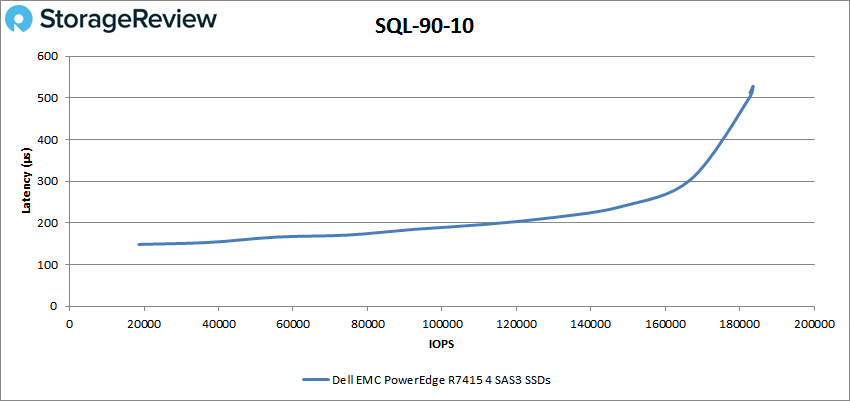
For SQL 90-10, the SAS drives in the R7415 again had sub-millisecond latency throughout, this time peaking at 183,606 IOPS with a latency of 528μs.
The NVMe SQL 90-10 peaked at 802,921 IOPS with a latency of 157μs.

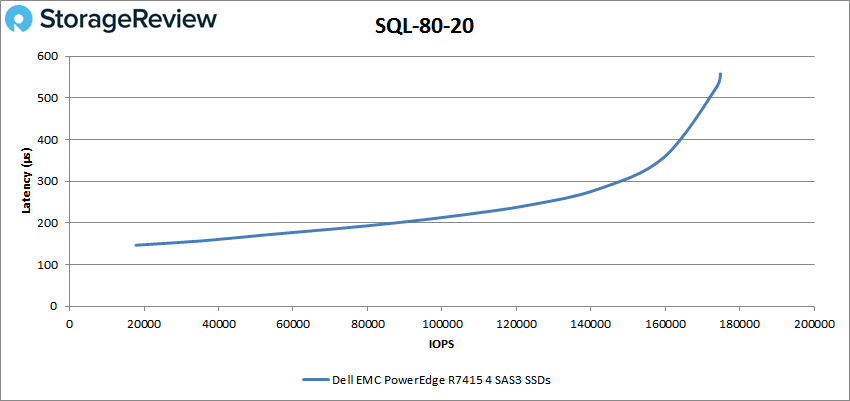
With SAS SQL 80-20, the server had sub-millisecond latency the whole time with a peak performance of 174,882 IOPS and a latency of 557μs.
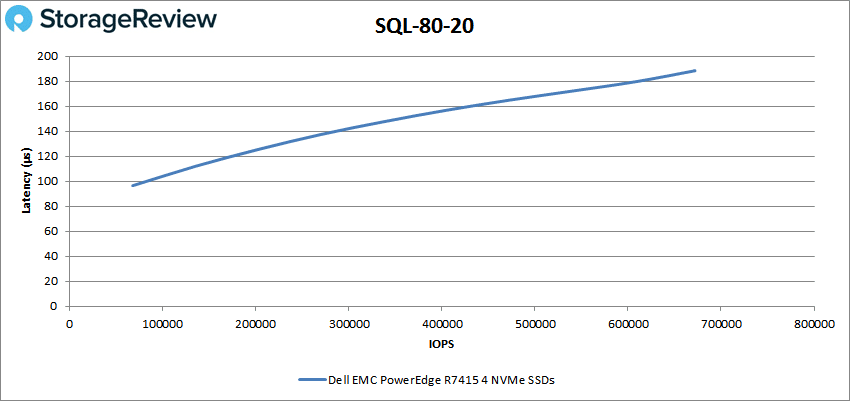
For the SQL 80-20 on the R7415 with NVMe drives, we saw a peak performance of 671,888 IOPS with a latency of only 188μs.
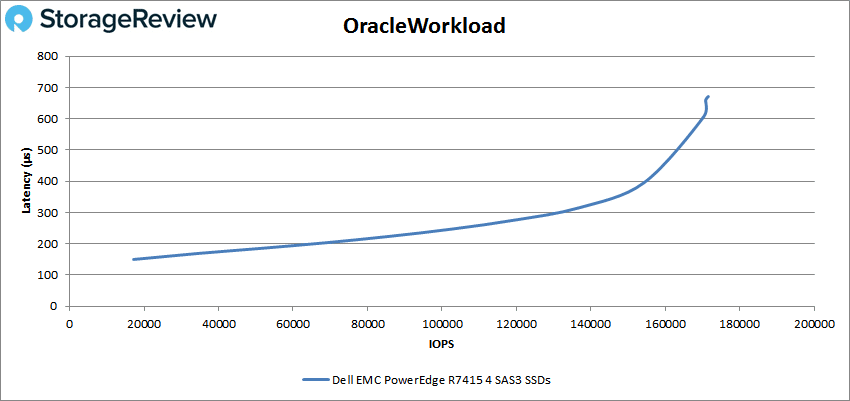
Moving on to Oracle workloads, the SAS-loaded R7415 was able to hit 170,844 IOPS all while maintaining latency under 1ms (peak latency was 671μs).
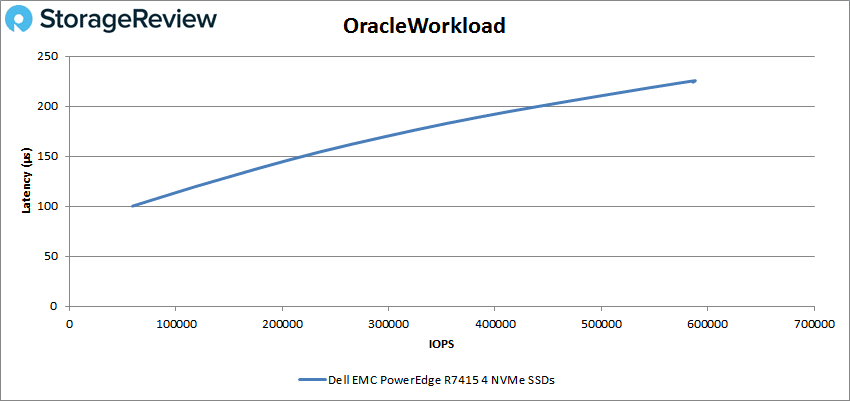
The Oracle NVMe version of the R7415 peaked at 586,026 IOPS at a latency of 226μs.
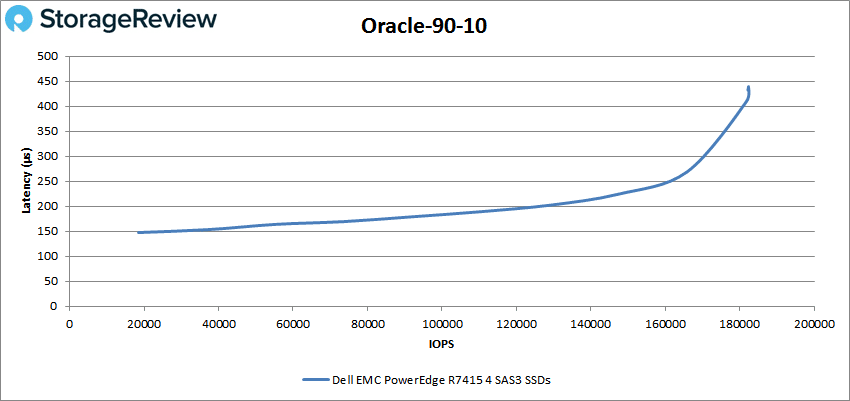
For the Oracle 90-10 performance with SAS drives, the server peaked at 182,345 IOPS with a latency of 439μs.
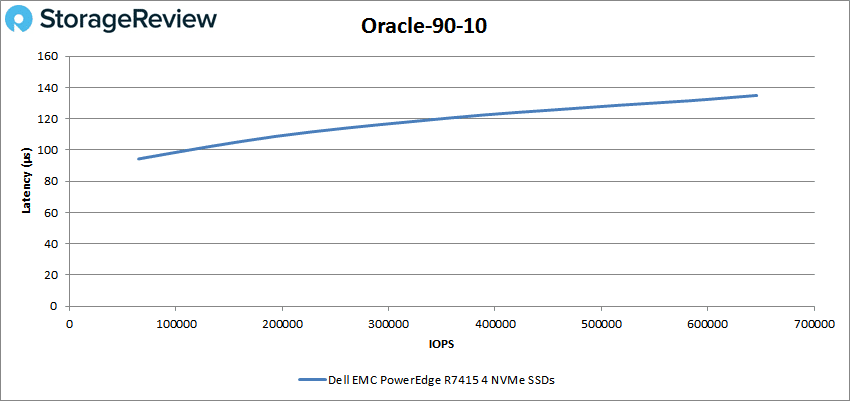
The NVMe version of the Oracle 90-10 benchmark had the server peak at 645,168 IOPS at a latency of only 135μs.
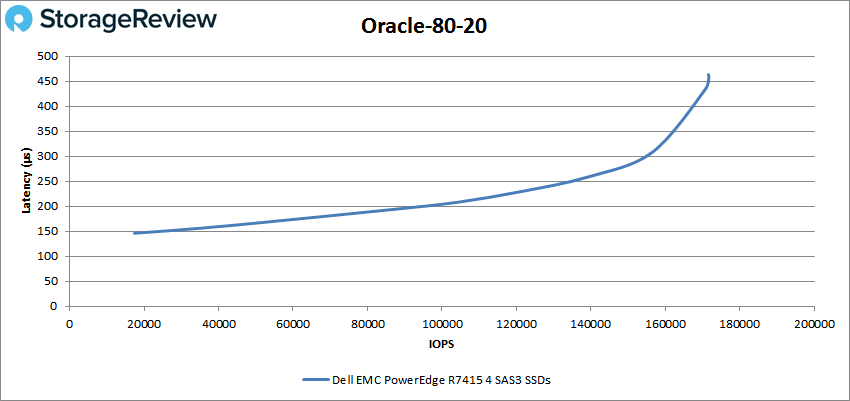
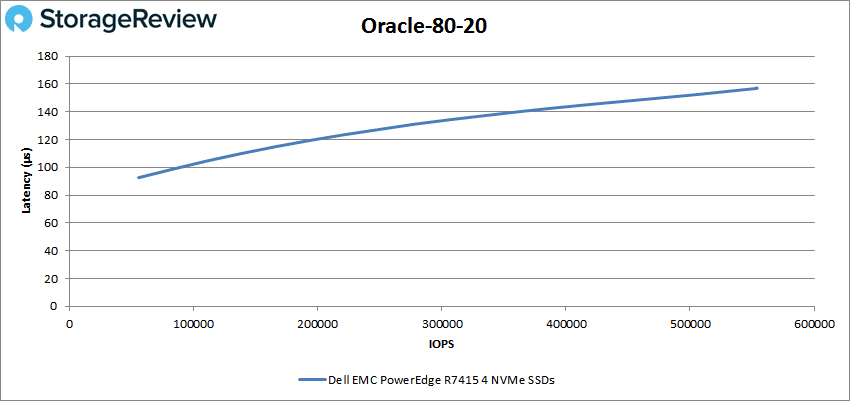
With the Oracle 80-20, the R7415 with SAS peaked at 171,694 IOPS with a latency of 458μs.
The NVMe Oracle 80-20 benchmark saw the R7415 peak at 553,829 IOPS with a latency of 157μs.
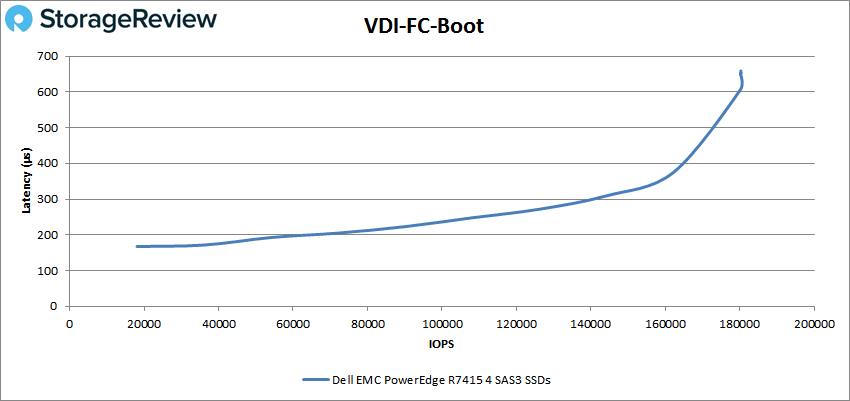
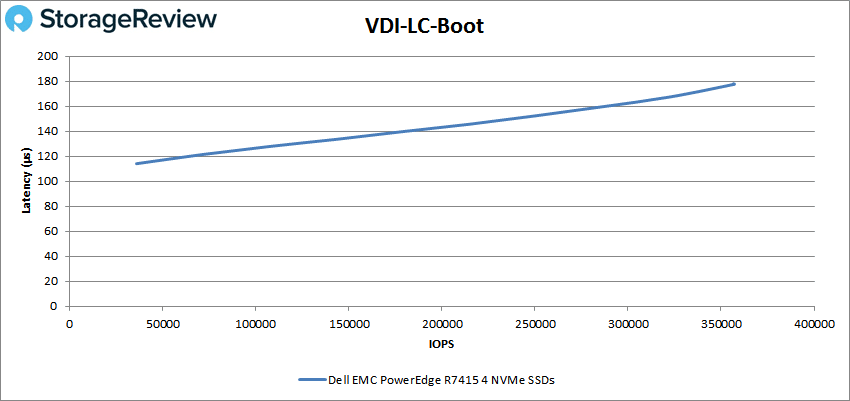
Next we switched over to our VDI Clone Test, Full and Linked. For VDI Full Clone Boot with SAS, the PowerEdge R7415 had sub-millisecond latency throughout with a peak score of roughly 181K IOPS and a latency of about 610μs.
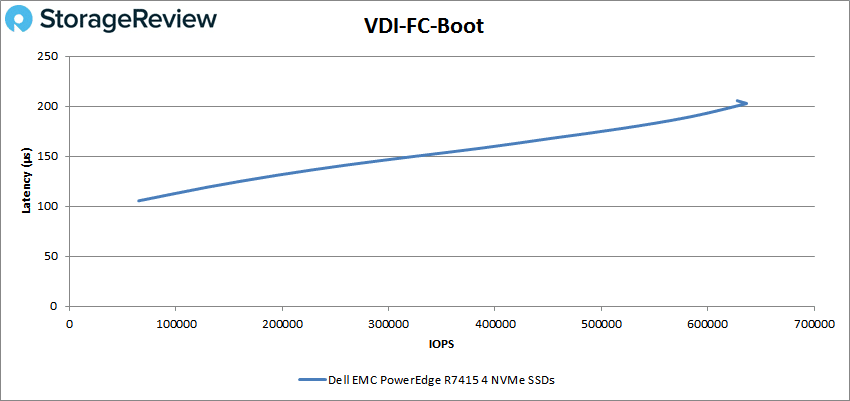
With the NVMe-loaded R7415, the VDI Full Clone Boot test gave us a peak performance of 636,481 IOPS with a latency of 203μs.
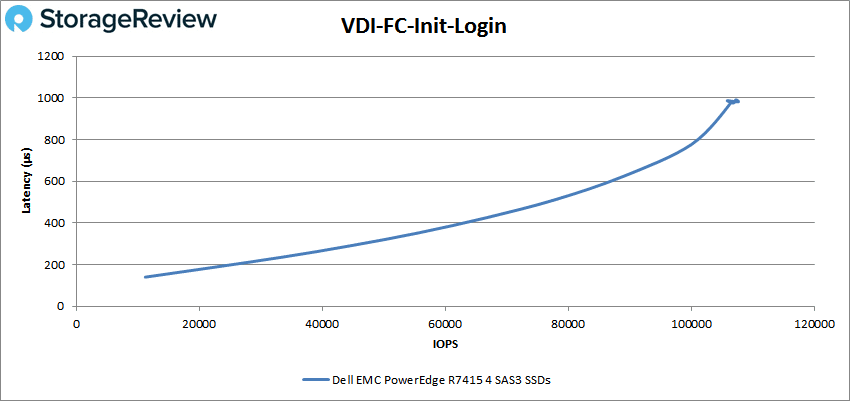
For the VDI Full Clone Initial Login with SAS, the server still had sub-millisecond latency throughout–but only just so. It peaked at 107,633 IOPS with 991μs.
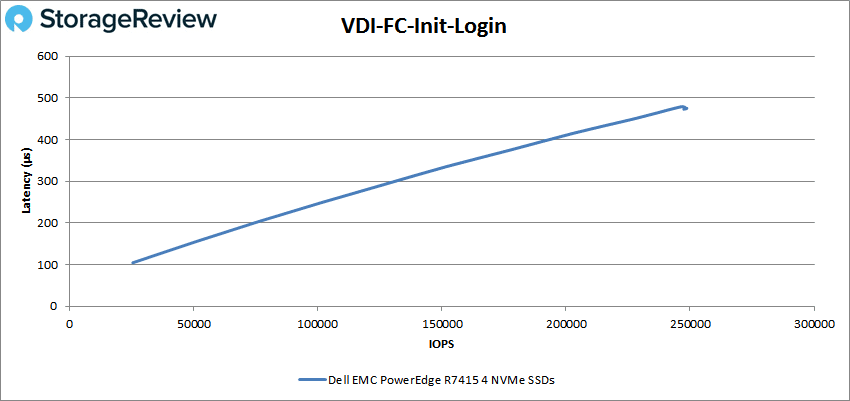
The VDI Full Clone Initial Login with NVMe had the R7415 reach a peak performance of 248,517 IOPS with a latency of 475μs.
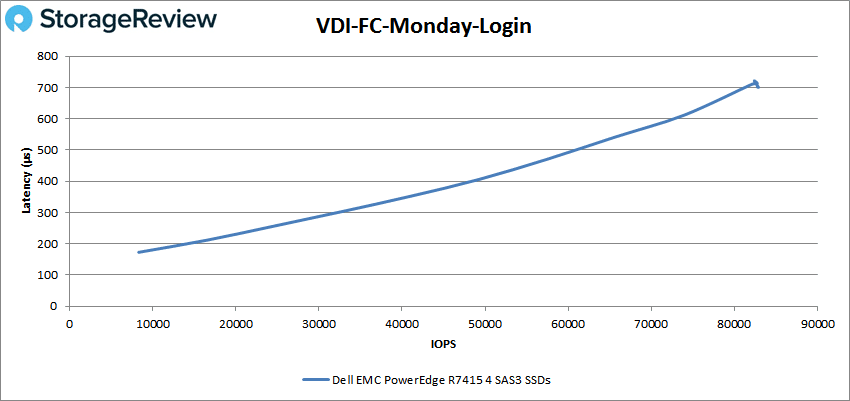
With the VDI Full Clone Monday Login with SAS, the server peaked at 82,754 IOPS and a latency of 712μs.
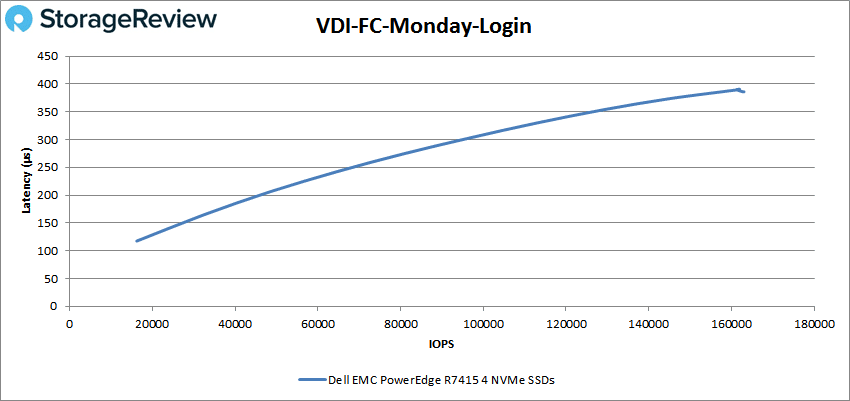
With the NVMe Full Clone Monday Login, the server hit a peak performance of 162,859 IOPS with a latency of 386μs.
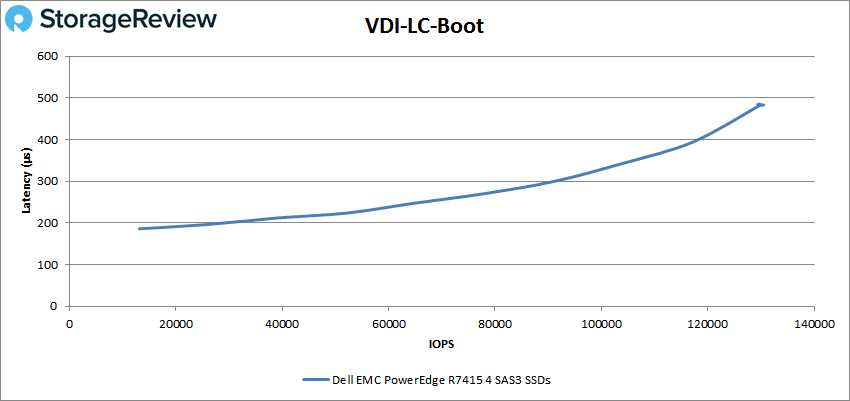
Switching over to VDI Linked Clone, the boot test for SAS showed the PowerEdge R7415 to have a peak performance of 129,826 IOPS with a latency of 482μs.
The NVMe version of the R7415 had peak performance of 357,173 IOPS and a latency of 178μs on the VDI Linked Clone Boot.
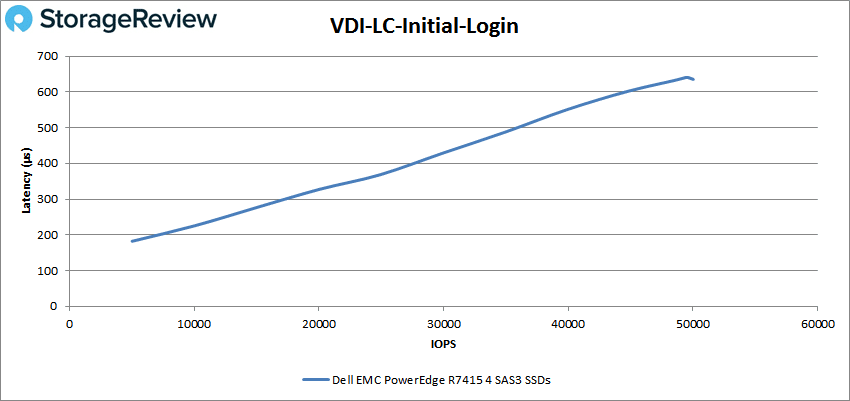
For the SAS VDI Linked Clone Initial Login, the server was able to hit 49,760 IOPS with a latency of 639μs.
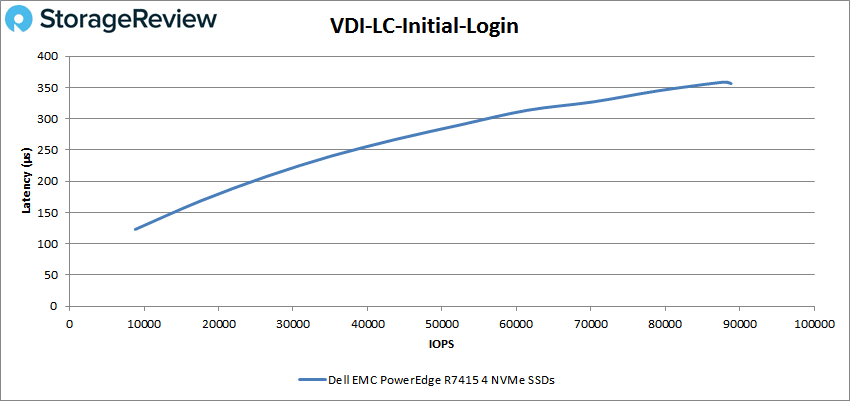
With the VDI Linked Clone Initial Login with NVMe, the R7415 had peak performance of 88,746 IOPS with a latency of 357μs.
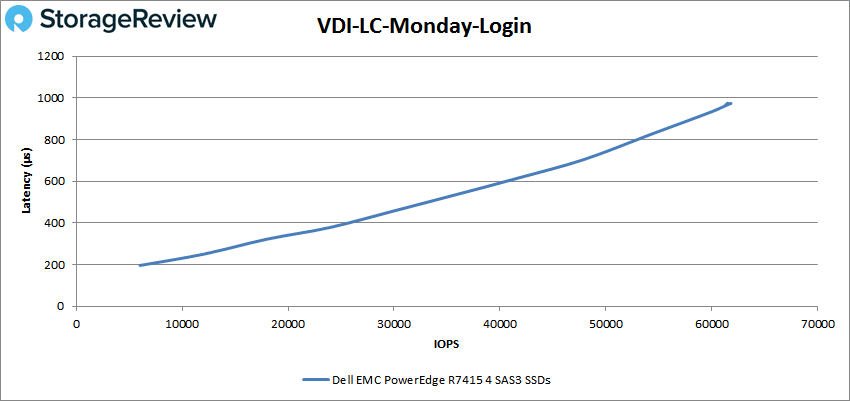
The VDI Linked Clone Monday Login for SAS had a peak performance of 61,513 IOPS with a latency of 974μs.
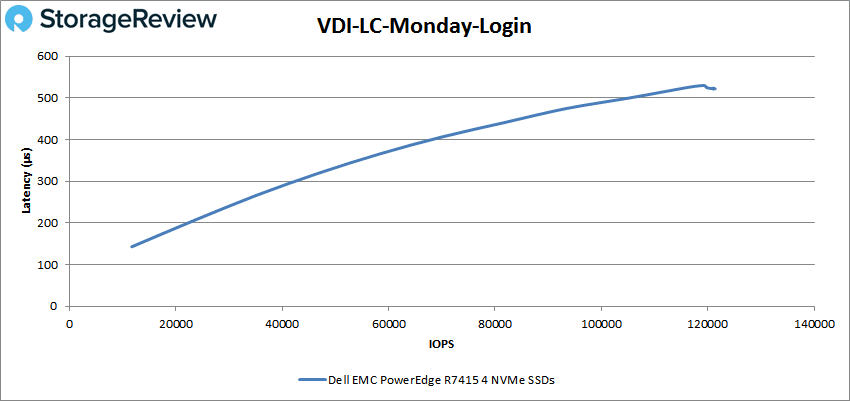
And finally, the VDI Linked Clone Monday Login with NVMe drives had the server hit 121,351 IOPS with a latency of 522μs.
Conclusion
The Dell EMC PowerEdge R7415 is a single-socket server that features a CPU from AMD’s new EPYC line. With the new processor, Dell EMC and AMD claim that users will see a performance bump accompanied by lower TCO through socket licensing and power needs. The R7415 comes with an ample amount of space to add devices to boost performance. For instance, users can add 16 DDR4 DIMMs that can hold up to 2TB of memory and can add up to 24 NVMe SSDs–all within the small 2U footprint. The PowerEdge R7415 comes with all of the features that make PowerEdge servers attractive for potential buyers such as LifeCycle Controller, iDRAC, and OpenManage Mobile, as well as the company’s new built-in security features such as cryptographically trusted booting and silicon root of trust. The PowerEdge R7415 is designed mainly for use in SDS and business analytics, though it could certainly be used for other use cases.
In our applications performance benchmarks, we looked at the performance of the PowerEdge R7415 using 4VMs to see individual performance as well as aggregate. In our SQL Server transactional test, we saw an aggregate score of 12,618.1 TPS, while the individual VMs ran from 3,152.9 TPS to 3,155.8 TPS. For the average latency of the same test, the server had an aggregate score of 11.75ms, while the individual VMs ran from 10ms to 14ms. For Sysbench, we saw aggregate scores of 7,567.3 TPS, an average latency of 16.9ms, and a worst-case scenario latency of 45.4ms.
Key findings in our Application Performance benchmarks:
- SQL Server transactional test: Aggregate score of 12,000+ TPS with an average latency of 11.75ms while individual VMs exceeded 3,150 TPS with latencies under 15ms.
- Sysbench tests: Aggregate scores of 7,500+ TPS with an average latency of 16.9ms.
In our VDBench workloads, we ran both SAS and NVMe storage. As stated above, this wasn’t to see which one is “better,” as obviously NVMe will have a higher performance punch. However, this demonstrates to potential users what they can expect with different types of storage media. Instead of going through every result above, we’ll just look at some highlights of each drive type. For NVMe, there was sub-millisecond latency performance in every test, we saw 4K read performance as high as 2.36 million IOPS with 4K write hitting 1.25 million IOPS. 64K sequential performance for the NVMe was 12.1GB/s read and 5.51GB/s write. The R7415 loaded with NVMe drives was also able to hit nearly 1 million IOPS in our SQL benchmark. The SAS readings were less dramatic, but still strong. The SAS setup on the R7415 only had latency above 1ms on the 4K and 64K tests. With SAS drives, the server was able to hit nearly 200K IOPS on 4K read and 180K IOPS on 4K write. With sequential performance, the SAS drives hit 1.74GB/s read and 1.95GB/s write. During our Oracle and SQL workloads, the SAS-based R7415 had performance near 200K IOPS with sub-millisecond latency.
Key findings in our VDBench workloads:
- All NVMe storage: Sub-millisecond latency performance in every test, with 4K read performance as high as 2.36 million IOPS and 4K write performance hitting 1.25 million IOPS; also, the R7415 was also able to hit nearly 1 million IOPS in our SQL benchmark.
- SAS setup: Latencies above 1ms on the 4K and 64K tests and while hitting nearly 200K IOPS on 4K read and 180K IOPS on 4K write; with Oracle and SQL workloads, achieved almost 200K IOPS with sub-millisecond latency.
The R7415 is clearly a capable system that can be configured with high-performance storage and RAM at a decent pricepoint for value-minded buyers – without cutting back on options. This isn’t insignificant, as many systems that target a more value-minded buyer cut back on options available. With support for 24 bays of NVMe and 2TB of RAM, the R7415 can be tooled for very specific workloads that are less compute intensive and thus see a negative TCO impact when outfitted with dual processors. The PowerEdge EPYC systems are also an interesting option in software-defined situations where end users can save on CPU Socket-based licenses. This is especially true for something like VMware vSAN, where in a remote office, workloads are less heavy but the organization still wants the ease of management that vSAN offers and the quality PowerEdge brings to the table – just in a more affordable configuration.


 Amazon