

Earlier this year, we got hands-on with Dell PowerMax to get a feel for many of the 200 updates in the PowerMaxOS 10 release, highlighted by storage efficiency improvements and cybersecurity enhancements. Now Dell’s back with PowerMaxOS 10.1, further pushing these efficiency and security enhancements.
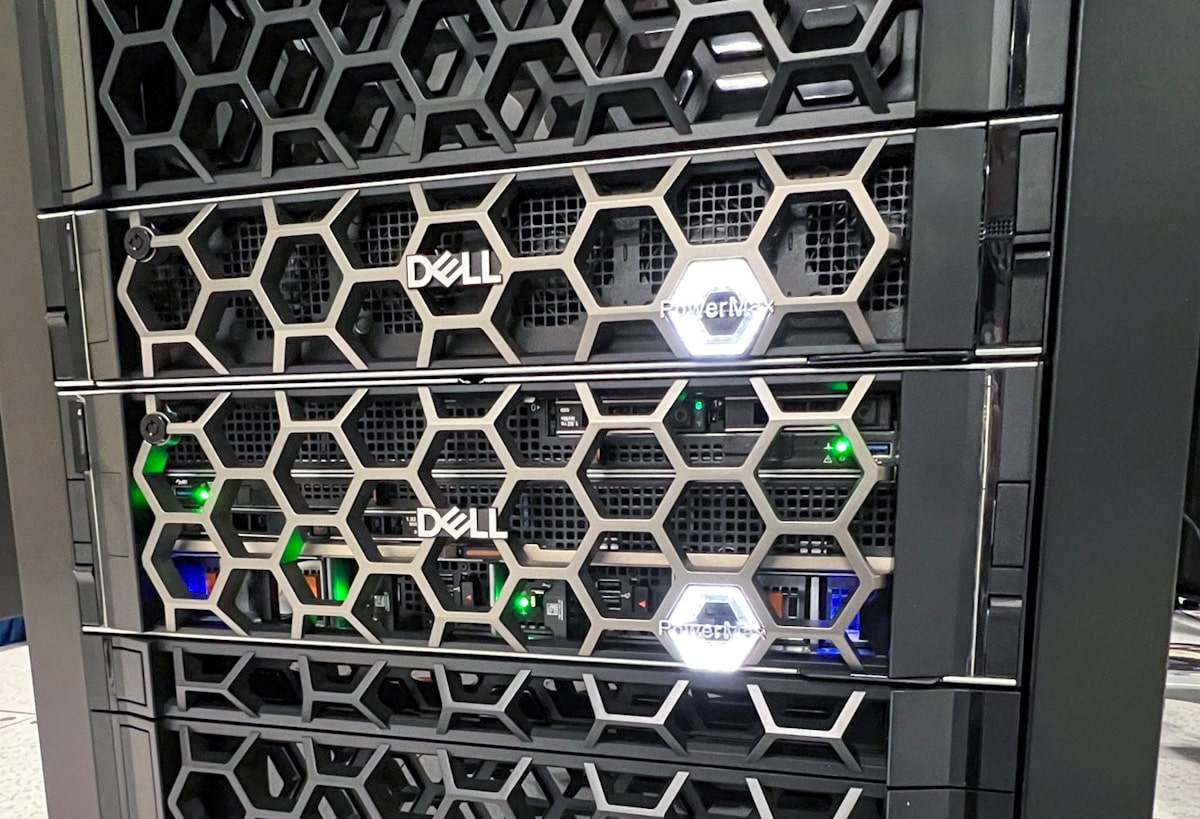
PowerMaxOS 10.1 includes a real-time Power Consumption Dashboard fueled by the new intelligent Power Distribution Unit (iPDU). The iPDU integrates with PowerMax and delivers actionable insights to the dashboard to maximize workloads from a power planning perspective.
The PowerMaxOS 10.1 release for the 2500 and 8500 utilizes AI-driven software to help customers secure, optimize, and improve the sustainability and efficiency of storage with enterprise-class cyber resiliency and performance. The latest software adds many “must-have” features to the PowerMax family, including an increased data reduction guarantee of 5:1.
PowerMax Performance and Efficiency Balancing Act
Significant advancements in productivity and efficiency, especially at scale with AI/ML integration, are key features of the new release. This includes a remarkable 14x increase in capacity per rack unit compared to the previous release. Dynamic data mobility optimizes storage resource utilization across arrays, while real-time health checks and proactive remediation through predictive analytics enhance overall system performance and capacity management.
The entire package makes this new PowerMax release a game-changer for data center efficiency, performance, and management. Dell has redesigned the compute node architecture to deliver mission-critical performance using fewer, but more efficient, components with well-known power consumption and performance profiles. The improved intelligent Board Management Controller (BMC) has temperature-controlled variable-speed fans and redesigned cooling zones, providing better airflow and component cooling.
The PowerMax Dynamic Fabric architecture is designed for efficiency and features end-to-end NVMe-oF (NVMe/PCle and NVMe/IB) that allows for linear and predictable power-consumption increases as systems scale up and scale out. The Dynamic Media Enclosure (DME) is designed for improved airflow and cooling. The new iPDU delivers rack-level power consumption and environmental monitoring. These are just some key enablers that provide power efficiency and reporting improvements.
When Dell talks about PowerMax efficiency, we generally consider that to be things like data reduction and other storage efficiency tactics. With the PowerMaxOS 10.1 release, though, efficiency means much more. Yes, there are improved data footprint efficiencies in PowerMaxOS 10.1 thanks to software updates and a new data compression card. Still, power efficiency takes top billing with the new iPDU and the Power Consumption Dashboard.
With so much focus on reducing our carbon footprint, monitoring, managing usage, and cutting data center operating costs, Dell answered by unveiling the Power Consumption Dashboard in concert with the intelligent Power Distribution Unit (iPDU). Let’s look at the specifics of the iPDU first.
Dell iPDU Hardware
Dell now offers intelligent, proactive power and environmental monitoring and reporting based on actual usage. This is possible because the new iPDU is included in every rack with PowerMax 2500 and 8500 running PowerMaxOS 10.1. To be clear, the iPDU is not simply a power distribution unit. This iPDU enables real-time telemetry and PDU power, voltage, current, external temperature, and humidity monitoring. Customers can monitor power consumption and environmental conditions inside Dell’s 42U Rack. Further, the data gets bubbled up to help storage admins make more informed decisions around data placement and efficient use of resources.
From a hardware perspective, the iPDU supports up to 27x C13 output connectors, 12 breakers, single-phase and 3-phase Delta/WYE, and up to 28.8 kVA per rack. Specifically, the iPDU can support up to 108 power connections across two racks configured with four iPDUs. To level set, the 8500 is typically built out in two 42U racks but can be delivered in one, while customers can fit up to three 2500s in a single rack.
Each rack has dual iPDUs to accommodate the A/B power distribution and can be daisy-chained across racks. Each iPDU has two slots used to connect the intelligent Power Distribution Panel (iPDP). A different iPDP is required for each phase type, whether it is single-phase, 3-phase WYE, or 3-phase Delta. There is one slot for the intelligent Reporting Module (iRM).
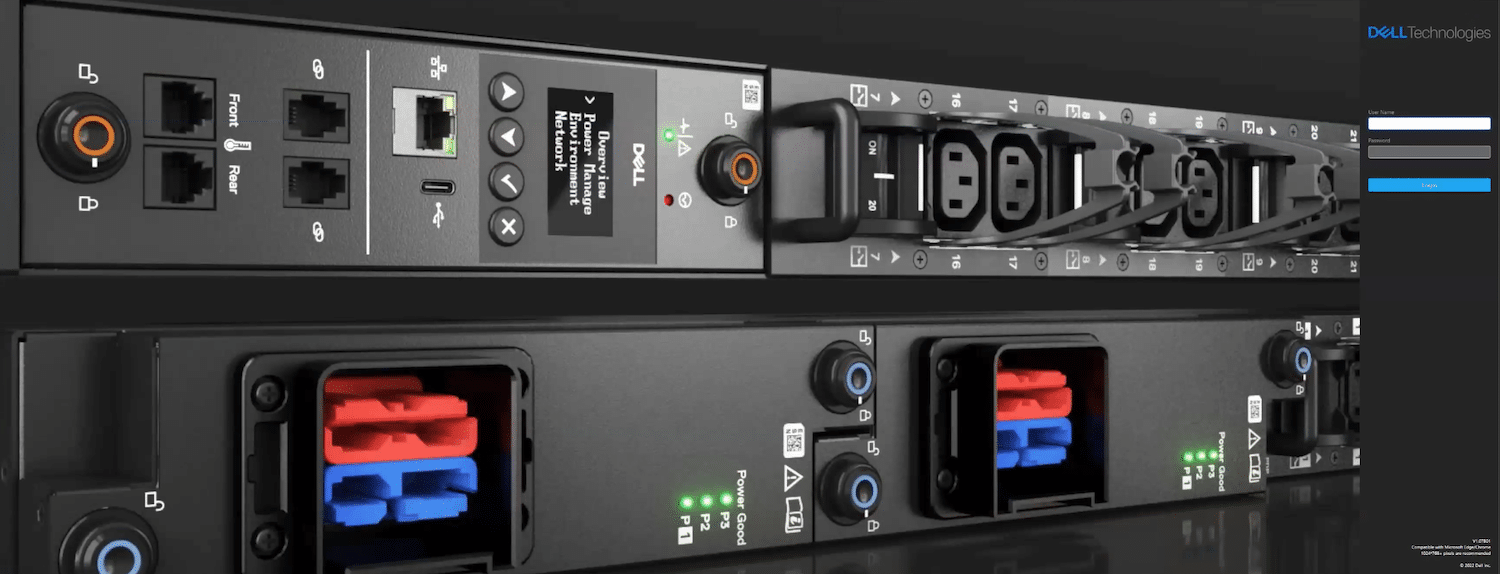
The iRM, think of it as the brains behind the iPDU connects customer hosts and networks to other iRMs in the system and rack, and much more. A USB-C console port provides access for setting up the IP address and is also used for servicing and debugging the unit.
Visually, the iRM has status lights that indicate alerts and an LCD screen that can display IP addresses and identify alerts and alarms, temperature, voltage, and current. The LCD window has limited real estate on the module, so Dell has provided up/down buttons for scrolling through the data. Remote management for the iPDU is supplied by connecting a network cable to the Ethernet port on the iRM module. The iRM also holds the web page, SNMP, and Redfish interfaces.
The iRM has two Daisy Chain RJ11 ports that provide access to as many as four iRMs used to view aggregate data across two cabinets. Two RJ12 ports connect the Environment Monitoring Probe for monitoring temperature and humidity, which is only available for Zone A. For the PowerMax 8500, the four temperature and two humidity sensors are located on the rack’s front and rear doors. The PowerMax 2500 has sensors in the front bezels and rear doors.
Real-time reporting of data related to environment and power is made through the Dell branded application accessed via the customer’s private IP address. Customers that have standardized on other data center monitoring software will be happy to note reporting data is compatible with applications supporting SNMP and Redfish integration.
Dell PowerMax Power Consumption Dashboard
Including the iPDU in PowerMax deployments is significantly more than just a hardware accessory. In addition to making life easier for IT to monitor and support PowerMax, the iPDU provides the interface to the Power Consumption Dashboard. This critical new feature provides power and environmental details for the PowerMax 2500 and 8500.
The Power Consumption Dashboard provides much more than power consumption information. This full-featured dashboard delivers intelligent, proactive, real-time power and environmental monitoring, alerting, and analytics based on actual usage.
Additionally, with customizable alerts and sensors, administrators can leverage the dashboard to act on alerts, such as preventing component failures if a rack is overheating, ultimately increasing availability. Workloads and data can be redistributed to different drives within an array or moved to a completely separate PowerMax in a different location. These are just two examples of the power of the PowerMax Power Consumption Dashboard.
The PowerMax Power Consumption Dashboard remains consistent with Dell’s push for simplicity and ease of use across the portfolio. Setting up access to the dashboard is as easy as adding the IP address to the iPDU from the iRM console port using the USB-C port positioned just above the LCD.
Next, open a console window using a terminal application to gain access to the main console menu. From here, select the “configure network settings” option. Dell has preconfigured the iRM with default settings, making it easy to use the defaults or provide network details using dedicated and isolated physical network parameters to ensure the best security option. This is Dell’s recommended option, but is not required.
The default console display is shown below.
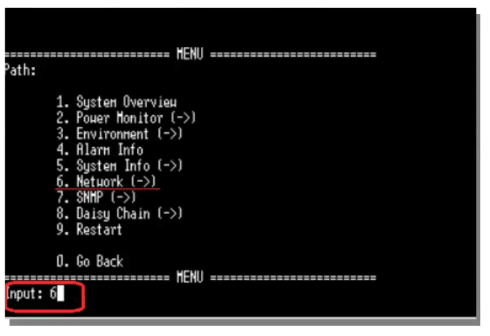
As a security measure, it isn’t possible to make changes to network settings using the buttons on the iRM.
After setting the network parameters through the console port and with the iRM connected physically to the network using the RJ45 port, administrators will have access to the dashboard through SNMP and Redfish. Now, users can continue setting up the iRM and managing other iRM features. Also, although Unisphere is employed for Autonomous Health, there are no plans to add iPDU information to Unisphere. CloudIQ integration is made possible via an OpenManage Enterprise (OME) plugin. OME is the Dell PowerEdge power management tool.
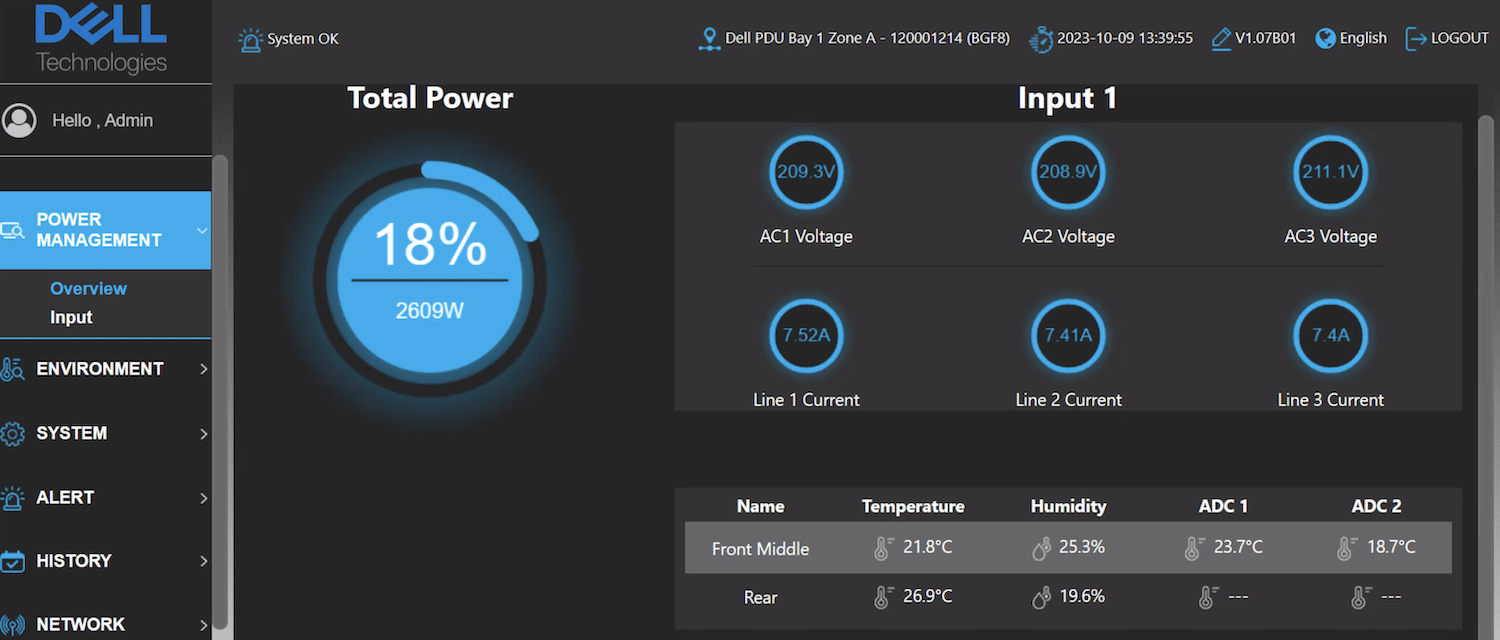
After setting up the network, dashboard access is available via a GUI, as depicted above. The information on the initial dashboard display is the system overview, providing power usage and environment details. Selecting Input will display a table view with more information on everything shown on the initial dashboard.
Each dashboard screen offers options across the top of the display to provide a more granular view of specific functions.
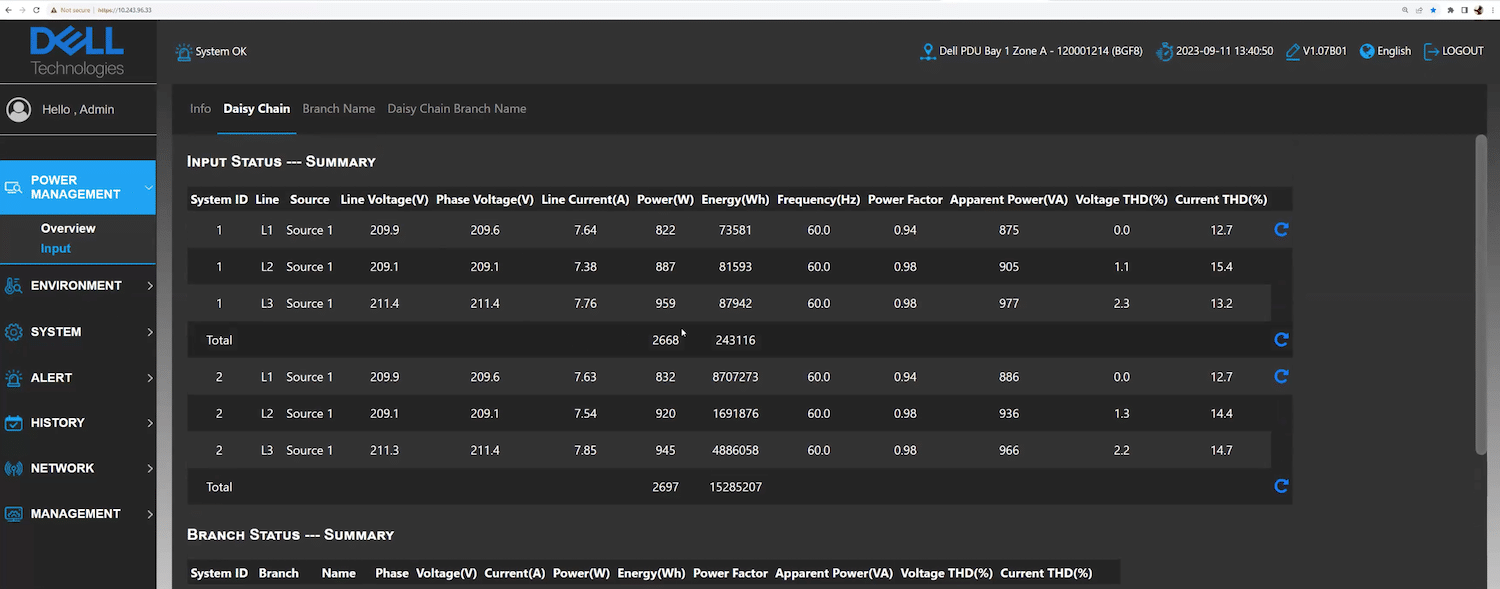
The Input view is an aggregate of everything from the iPDU. The options at the top of the screen provide access to information on Daisy Chain, Branch Name, etc. The Daisy Chain view (shown above) provides details on both iPDUs in a dual rack environment.
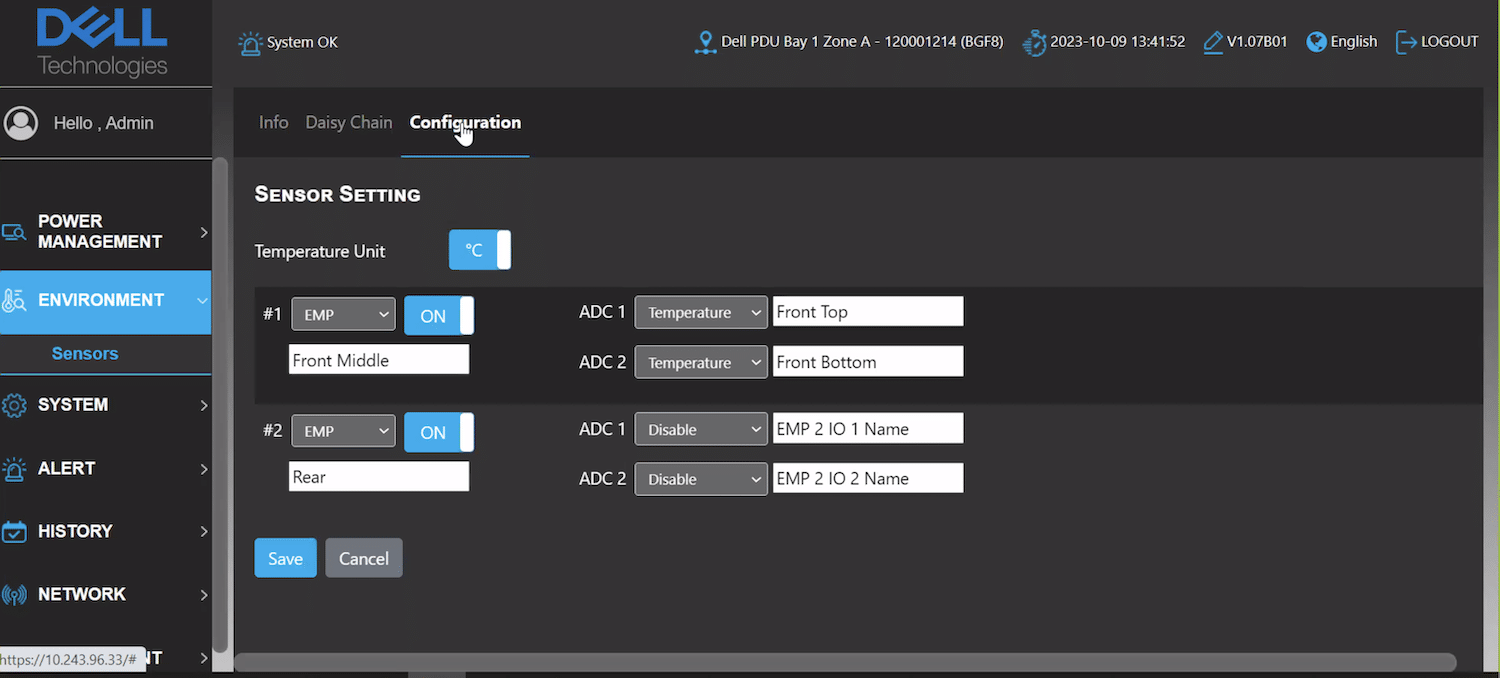
The Environment option displays details gathered by the sensors in an easy-to-read format. Within this view, users have options to configure sensors to better fit the local environment.
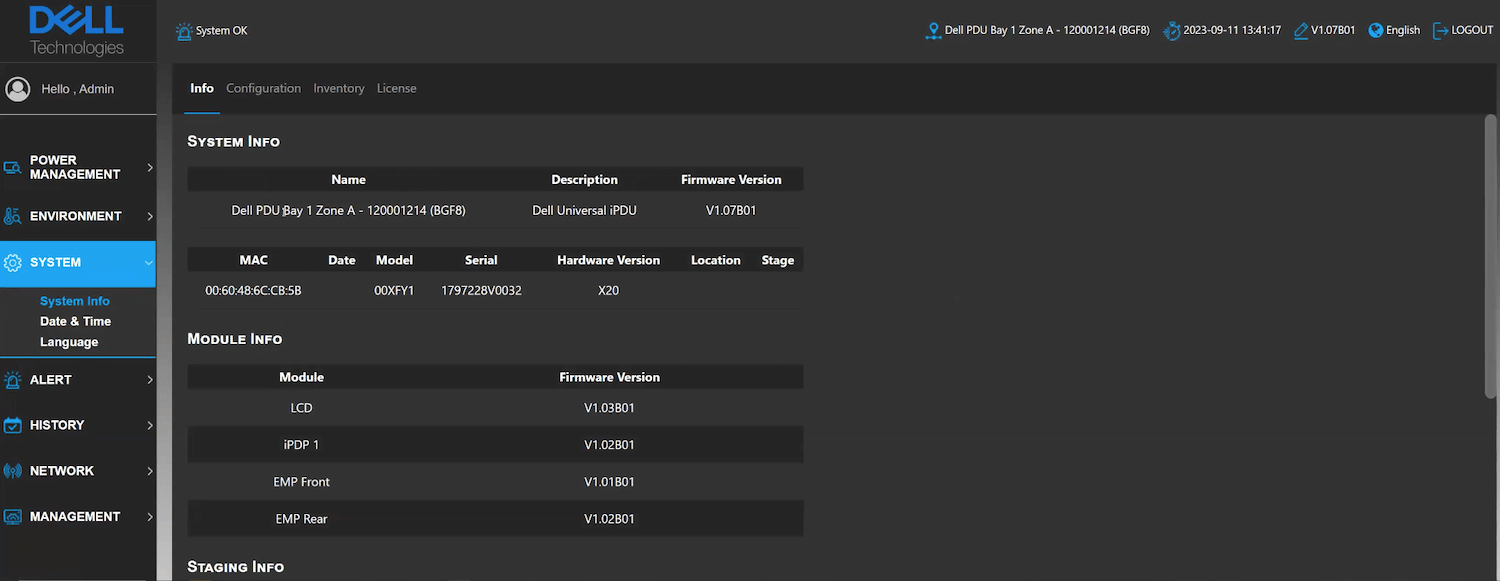
The System option provides overall iPDU system details such as friendly name, description, firmware version, etc. Date and time, and language settings are available within the System view.
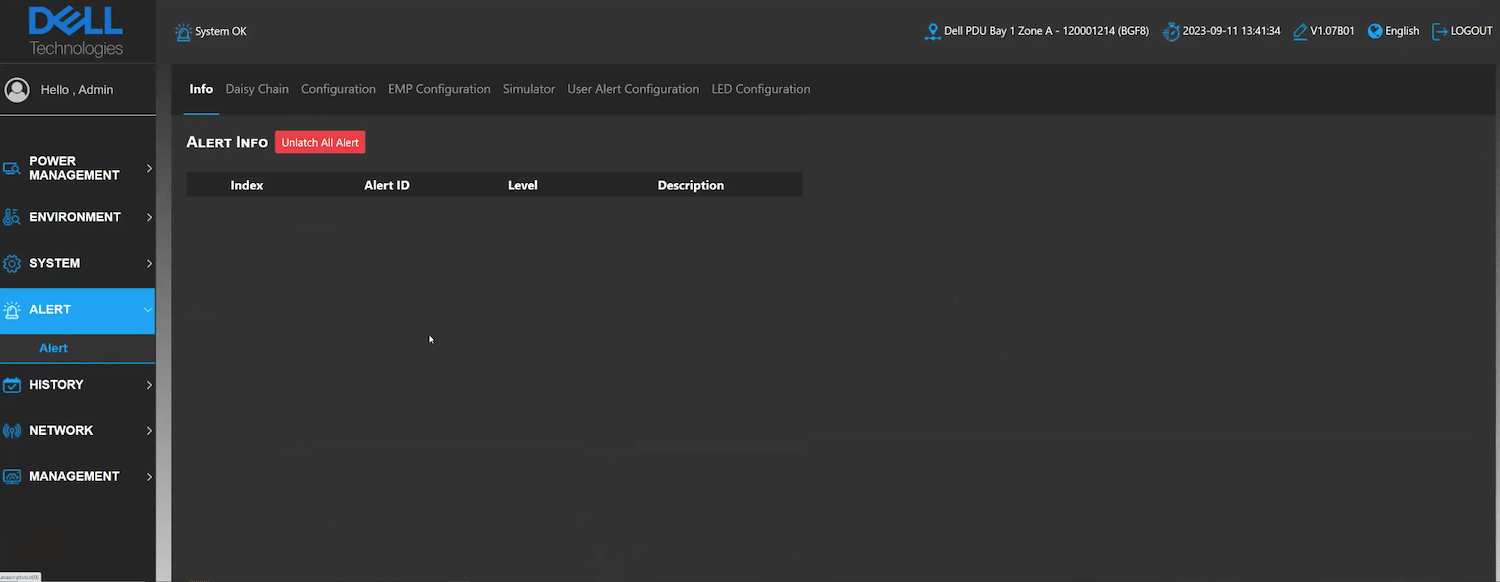
Alerts can be found beneath the System view. From here, administrators can run a simulation based on modified alert parameters to view the potential impact on the system based on the outcome of the simulation. If simulation is selected, all alerts are suspended until the simulation has ended.
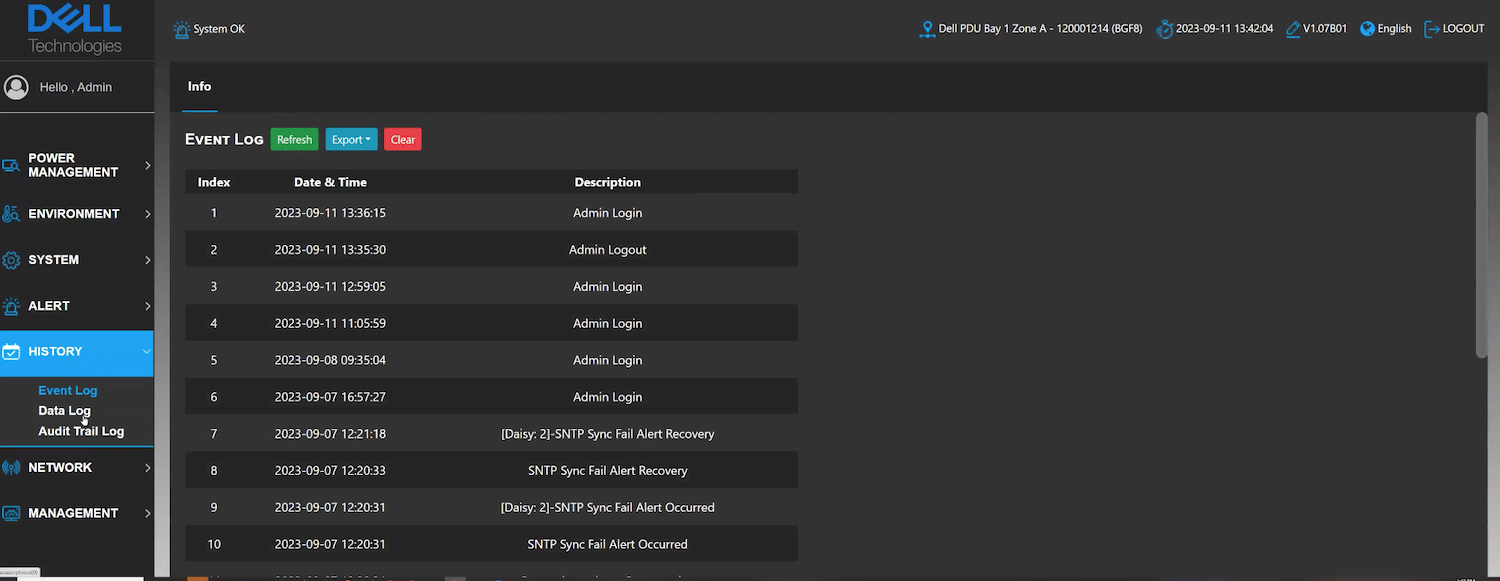
Other options from the panel include History, Network, and Management. The History view displays all event logs, while other history options include a complete data log view expressed in a tabular format that can be exported as a .CSV file and an Audit Trail Log to view the events leading up to an active event.
The Network view allows admins to view and modify network settings. The Management option provides admins the ability to modify user access as well as make configuration changes.
5:1 Data Reduction Guarantee
Dell was the first in the industry to offer mainframe data reduction and a 3:1 guarantee for mainframes and 4:1 for open systems on the PowerMax 2500 and 8500.
Dell has upped the ante with PowerMaxOS 10.1 with a data reduction guarantee of 5:1 for open systems data, significantly improving storage efficiency. Add to that an impressive 82 percent reduction in CO2 emissions compared to previous models, contributing to a more sustainable and environmentally friendly solution. The 3:1 data reduction guarantee for mainframes continues to lead in that space.
The gains in data reduction come in part to enhancements in 10.1 but are primarily due to a new compression engine hardware card installed inside the PowerMax chassis.
Higher Performance per Watt
With PowerMaxOS 10.1, the platform can achieve up to 2.8x more IOPs per watt compared to previous models. It also introduces proactive power consumption planning and analysis, including real-time monitoring, alerts, and management through a dedicated dashboard driven by in-rack hardware, as mentioned above. According to Dell, with the breakthrough efficiencies in PowerMaxOS 10.1 and the new PowerMax hardware, customers can save up to $207K in electricity charges over a five-year period.
PowerMax Cyber Resiliency Improvements
Dell surveyed 1,000 IT decision-makers from organizations worldwide. The results were published in The Global Data Protection Index (GDPI) Snapshot report. The survey revealed nearly half (48 percent) of these organizations were victims of cyber-attacks within the past year. Additionally, research conducted by Enterprise Strategy Group (ESG} found that among companies that experienced an attack, 50 percent paid a ransom. Still, only 40 percent could recover more than 75 percent of their data.
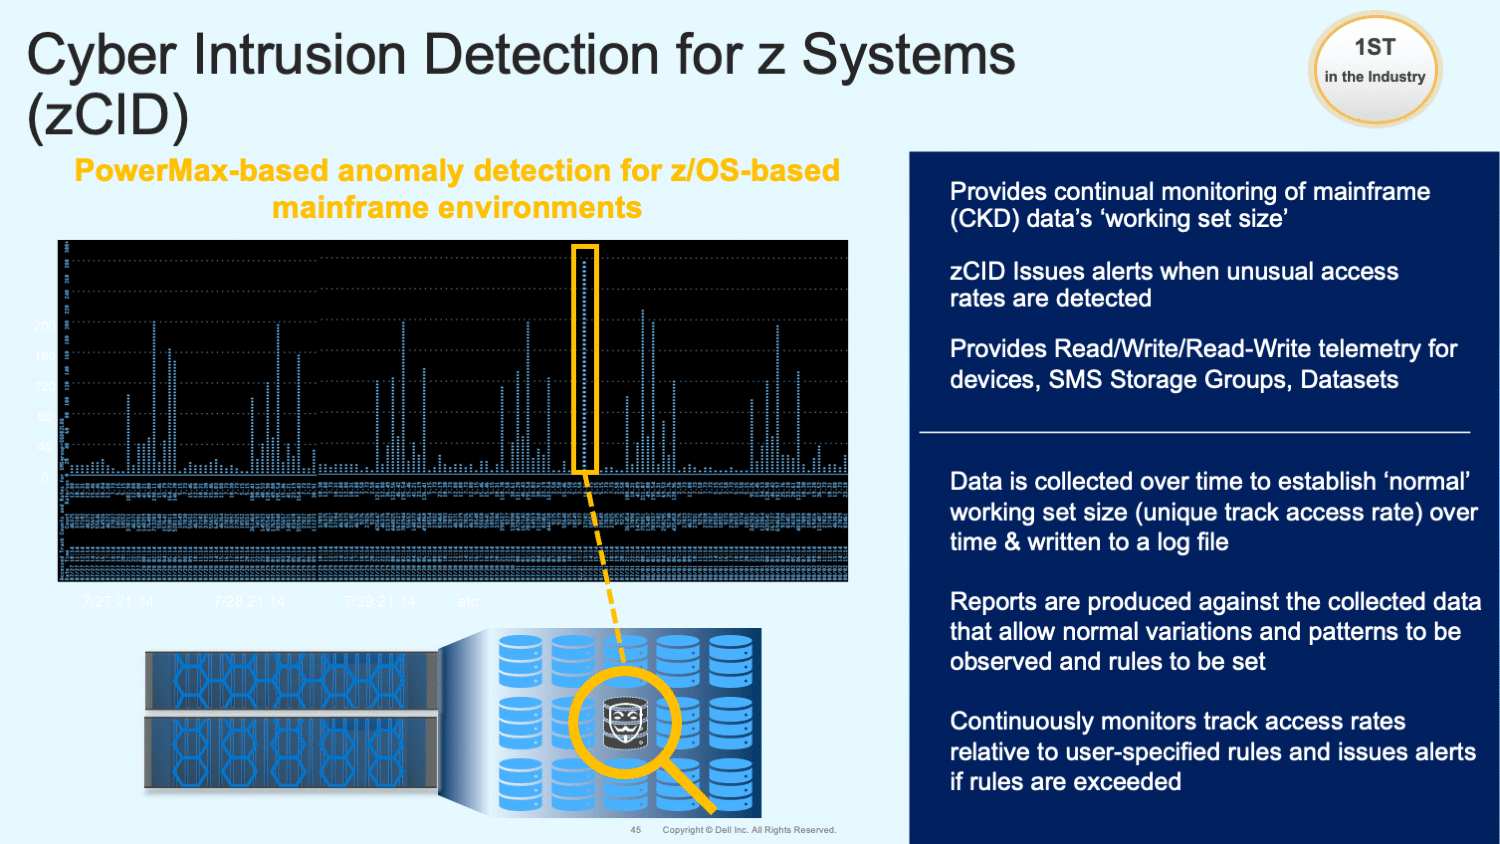
A key feature of Dell PowerMaxOS 10.1 is delivering mission-critical availability and cyber resiliency. The product now offers the industry’s first storage-based cyber detection tailored for mainframe environments. PowerMax also incorporates TLS 1.3 and received certification from the US Federal DoD (listed on Approved Products List), including STIG hardening, intrusion detection alerts, user lockout policies, and other DoD safeguards, ensuring top-level security.
PowerMaxOS 10.1 includes improved SRDF/Metro SmartDR (SRM) for mission-critical availability for VMware and extended connectivity via NVMe/TCP support for VMware vVols.
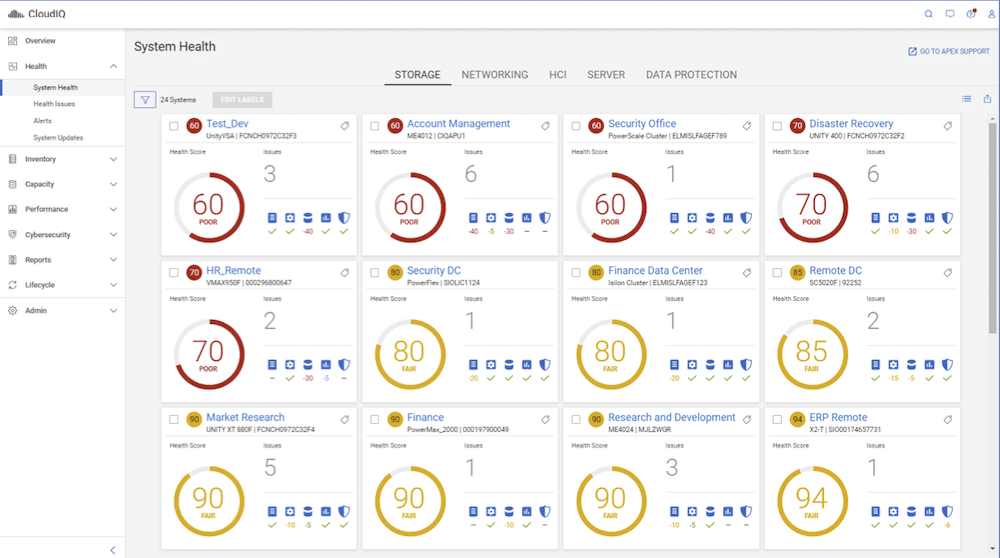
CloudIQ Delivers Proactive Capacity, Cybersecurity Assessments, and Remediation
With Dell PowerMaxOS 10.1, CloudIQ adds an AI/ML-based predictive analytics engine to predict imminent behavior on storage and, with the new AIOps engine, can recommend actions to remediate them proactively. The system can predict capacity headroom and suggest how to reclaim unused storage. The AIOps engine will analyze performance bottlenecks and provide details on balancing workloads.
Additionally, CloudIQ and PowerMax/PowerStore have intelligent anomaly detection based on pattern detection of performance, capacity, or data reduction. The CloudIQ remediation engine provides recommendations on the following:
- When and where to enable or disable data reduction for optimum performance and capacity
- Data mobility recommendations for optimal use of the infrastructure
- QoS recommendations to prevent noisy neighbors or other performance-related issues
- I/O Port rebalancing by distributing traffic via PowerPath
- Deployment best practice recommendations, such as virtual witness deployment suggestions
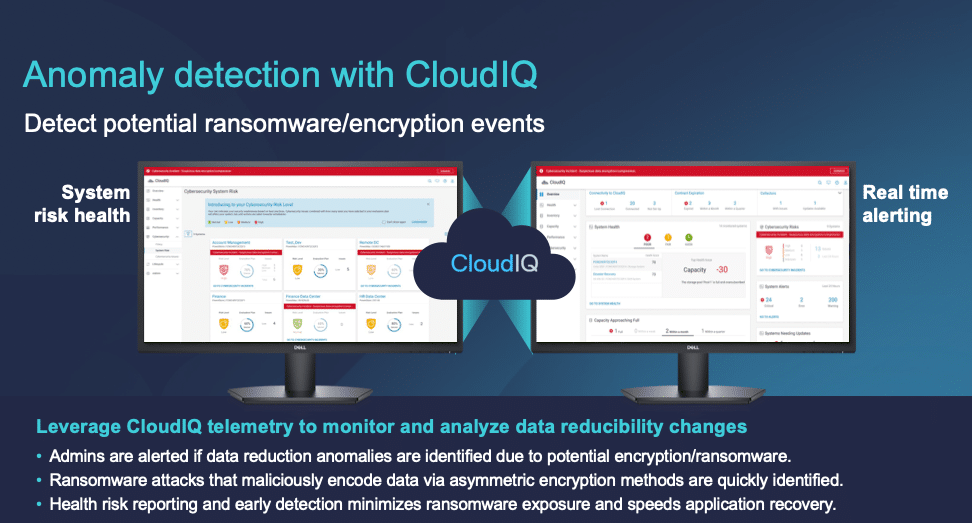
Employing CloudIQ helps mitigate the effects of a cyber attack by proactively monitoring and resolving infrastructure health, capacity, and performance issues and notifying administrators about security risks. CloudIQ and PowerMax use advanced telemetry capabilities to enable CloudIQ to flag every event, describing what, when, and why it happened, who is responsible, and what the impact is.
Anomaly detection based on I/O patterns further enhances cyber resiliency. Admins are alerted if data reduction anomalies are identified due to potential encryption/ransomware.
Additionally, CloudIQ and PowerMax have intelligent anomaly detection based on pattern detection of performance, capacity, or data reduction. The CloudIQ remediation engine provides recommendations on the following:
- When and where to enable or disable data reduction for optimum performance and capacity
- Data mobility recommendations for optimal use of the infrastructure
- QoS recommendations to prevent noisy neighbors or other performance-related issues
- I/O Port rebalancing by distributing traffic via PowerPath
- Deployment best practice recommendations, such as virtual witness deployment suggestions
The most effective approach to implement anomaly detection is to measure the size of verified data at the volume level and calculate the data reduction ratio (DRR). By monitoring the DRR regularly and identifying significant changes detected in the DRR, the volume will be flagged for further analysis and inspection. This method can help in identifying and addressing anomalies efficiently.
CloudIQ improves the time-to-resolution of infrastructure health, performance, and capacity issues by 2x to 10x on average. The security posture of an organization’s IT environment stands to improve with less effort when employing CloudIQ. Anomaly detection for PowerMax is an elegant way to detect malicious activity in storage systems and take corrective action to prevent security hacking.
Unisphere – Autonomous Heath
Until recently, Dell was focused on diagnostics, flagging faults and failures, relaying what has happened, and providing the user with the system status in the current state of operations. With the introduction of AIOps, Dell is taking monitoring and health checks from descriptive to predictive. AlOps combines big data and machine learning to automate IT operations processes, including event correlation, anomaly detection, and causality determination.
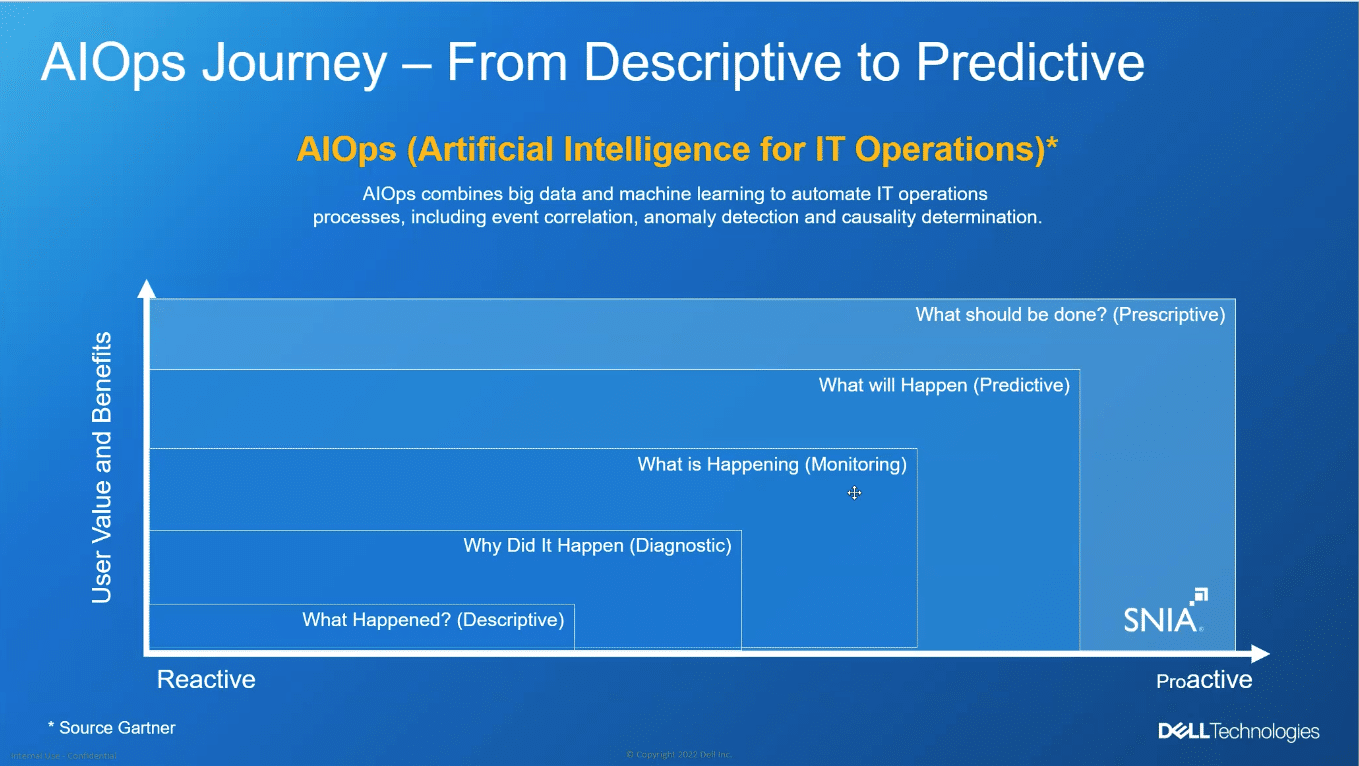
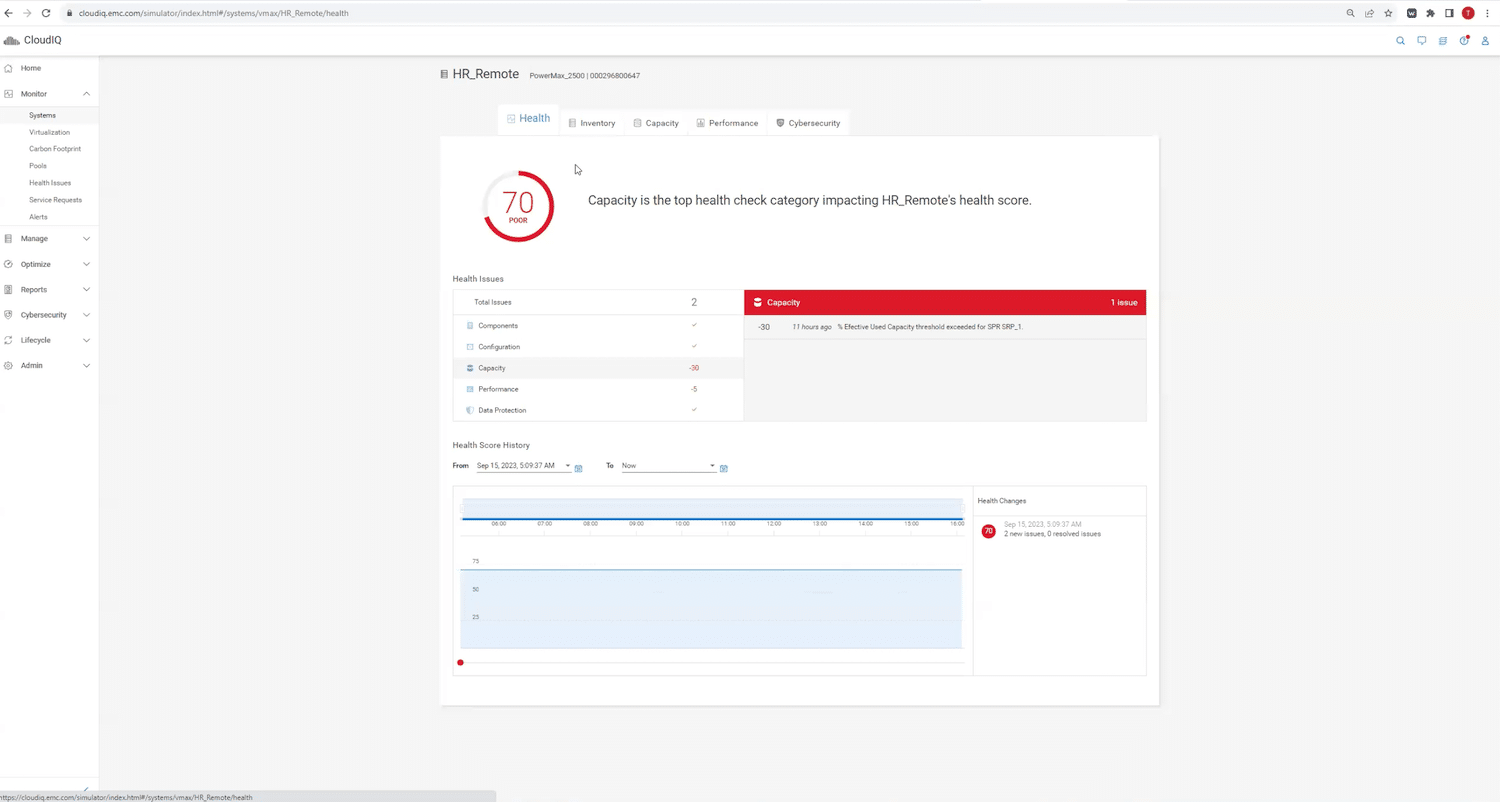
Unisphere for PowerMax is not new. In fact, the management tool has been in the system for several years and is included with CloudIQ. Initially, the system had provided the user with the overall health score in its current state. The new version provides administrators with critical information, such as current effective capacity usage and what to do if capacity has reached an unacceptable threshold. The screen capture below shows the flow from Descriptive to Prescriptive with an intelligent progression that includes Diagnostic, Monitoring, and Predictive, so administrators can act on any unusual activities.
PowerMax element manager has a CloudIQ connector to send performance metrics to CloudIQ, which in turn provides recommendations to deal with any breach. Using our capacity example, if the system has reached max capacity based on system metrics, CloudIQ will search for any available storage and allocate that capacity to the existing system.
Detail from the Unisphere element manager is passed up to CloudIQ.
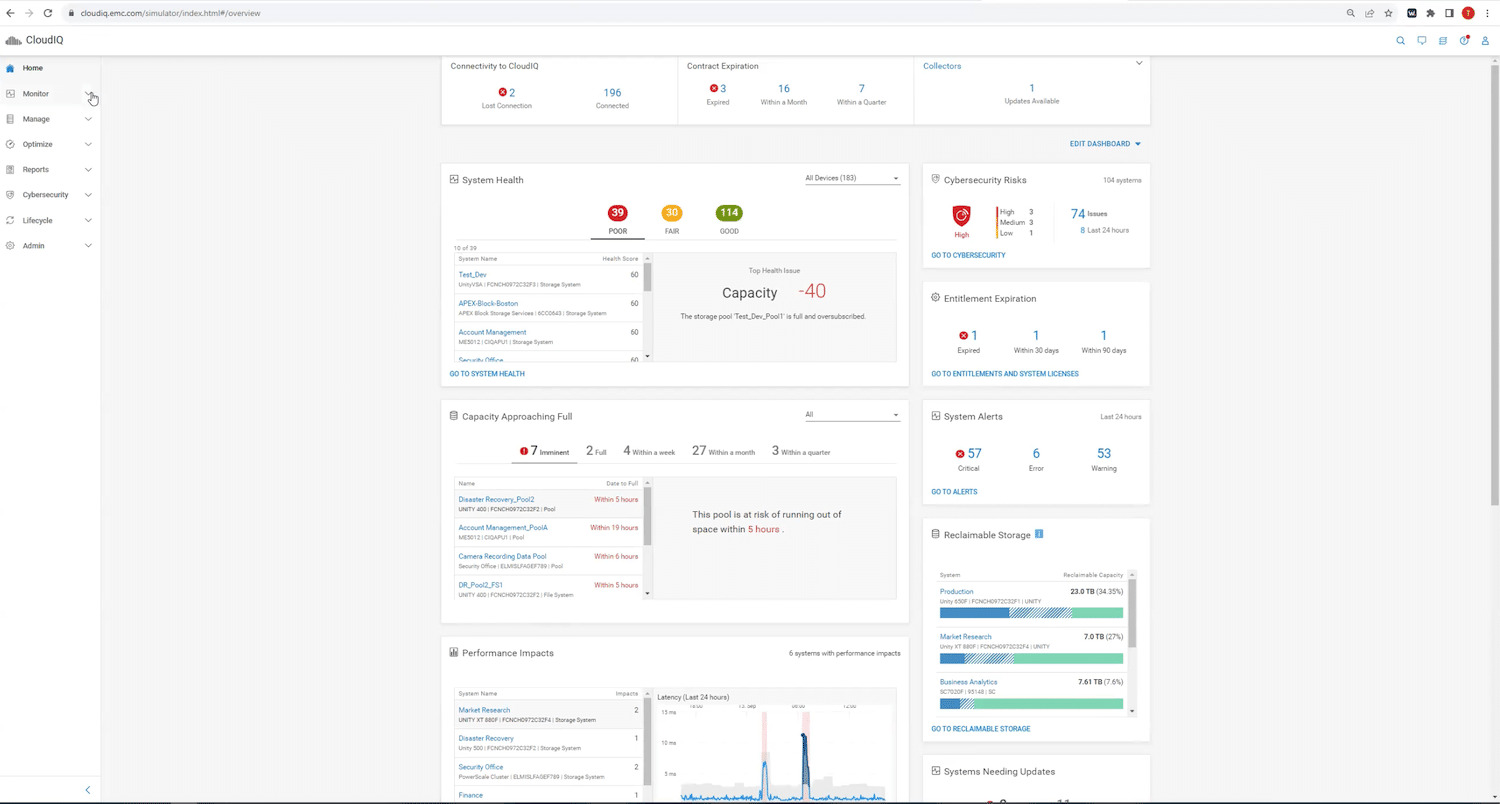
After logging into the Unisphere manager, the user is presented with a screen that provides an overall system view.
Clicking on the recommendation icon in the panel to the right will present the user with all recommendations to mitigate the breach, as illustrated below.
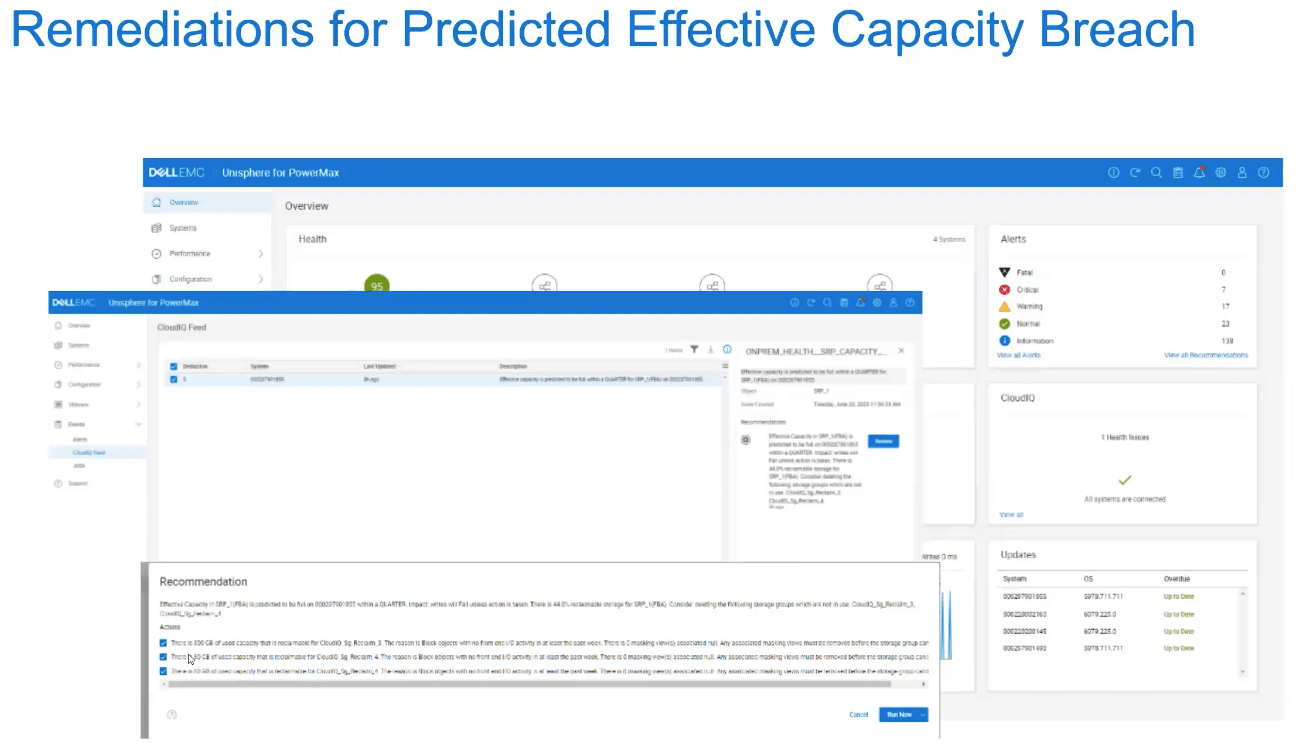
Recommendations are derived from data gathered through the element manager and passed up to Unisphere, where it is scrutinized before being handed up to CloudIQ. The recommendations have been run through rigorous tests to verify validity before being added to Unisphere.
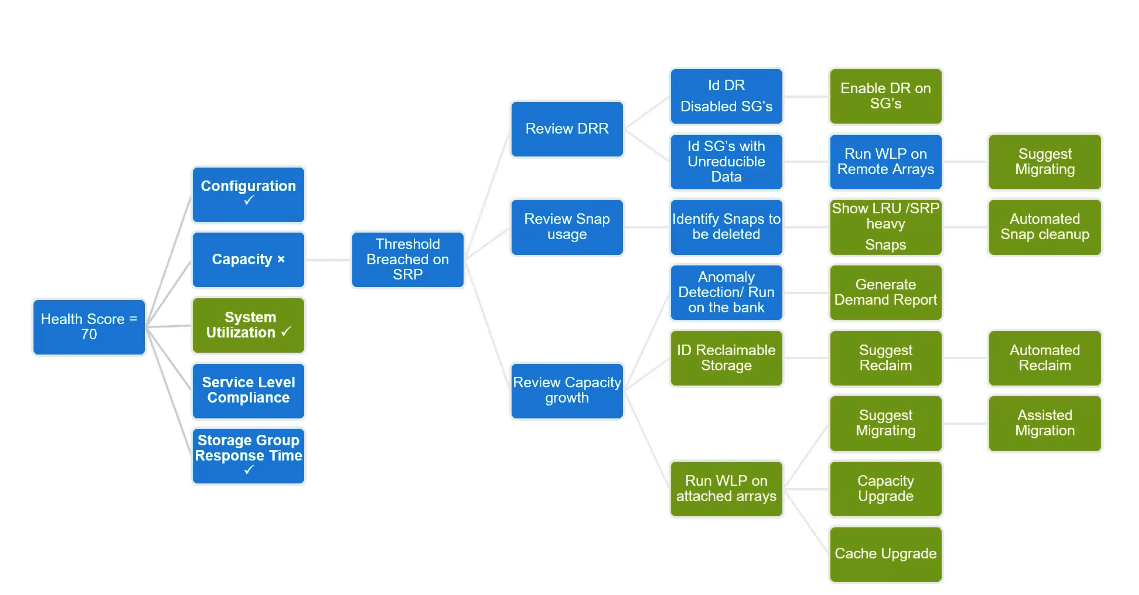
Today, administrators run through a manual process to rectify any system breach. With AIOps, the system performs the same function but uses AI to learn about the system. AIOps will continue to learn and update. Dell meets with customers regularly to review the process, ensuring they understand and are confident in the overall approach.
PowerMax performs AI-driven Autonomous Health Checks through pattern recognition and predictive analytics that identify potential vulnerabilities before they occur. If a vulnerability, such as depleting storage capacity, is identified, proactive remediation recommendations are sent to the system log for corrective action.

Dynamic Data Mobility
PowerMax has built-in migration technology, which enables common data mobility across supported PowerMax and non-PowerMax storage arrays. It leverages array-based orchestration and replication services to discover, configure, and migrate data automatically. Dynamic Data Mobility provides users with the flexibility to relocate workloads as business conditions change. The multi-array workload planner analyzes the storage infrastructure and recommends the best place to host the workloads.
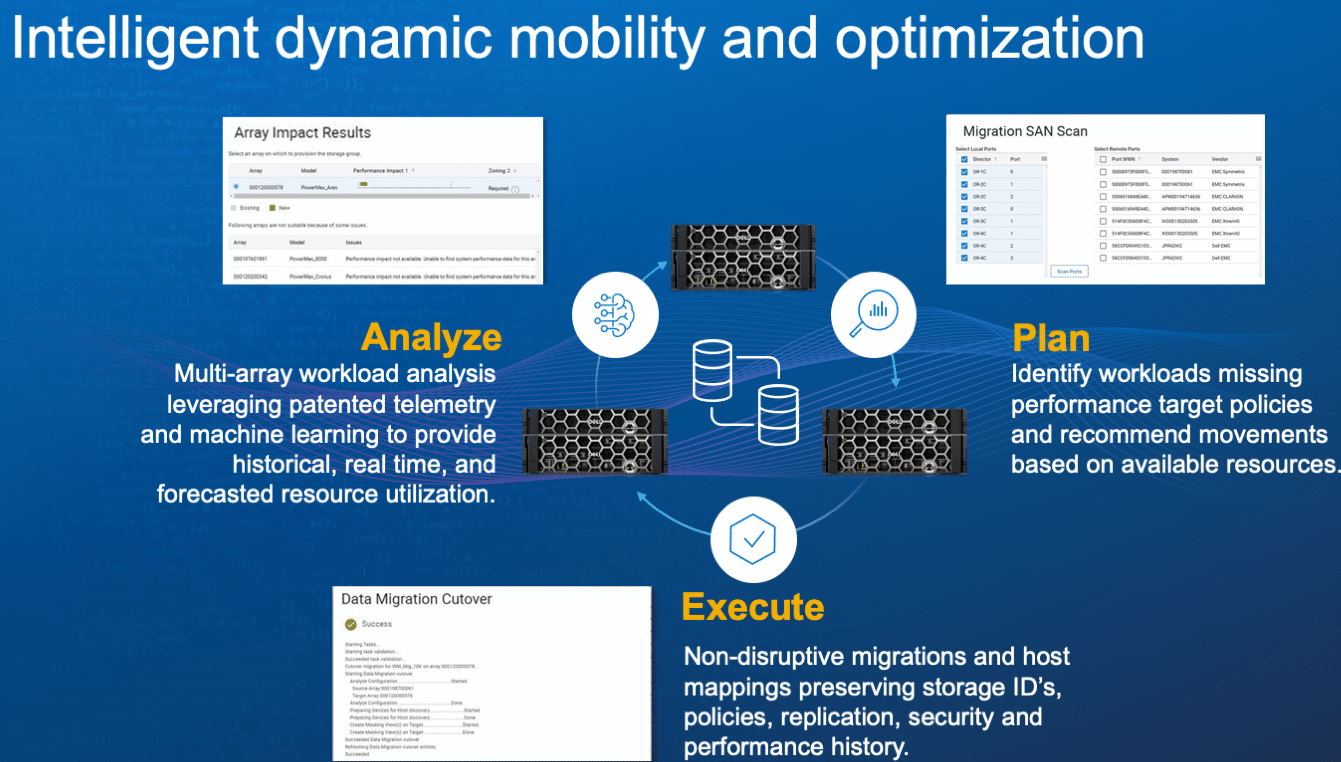
Think of this as vMotion for storage (PowerMax), providing a seamless method to move applications between arrays to optimize performance, load-balancing, and migration. Dynamic Data Mobility can be driven from the UI, fully automating the movement of the data and associated snapshot protection policies and cleaning up the source array.
Final Thoughts
Dell PowerMax customers account for 95 percent of the top Fortune 500. Indeed, the major update discussed in January further solidified those relationships. Now, the Dell PowerMaxOS 10.1 update reaffirms Dell’s intent to offer the industry’s most secure and energy-efficient mission-critical storage.
What’s really interesting to us with 10.1 isn’t just the progression in storage footprint efficiency and added security features; we’re impressed with the new iPDU and the visibility into power consumption that the Power Consumption Dashboard provides. We have yet to see an integration this deep from other vendors’ storage products. The iPDU and dashboard enable a whole new realm of possibilities for making storage and storage management more energy-efficient.
Save energy, accelerate cyber resiliency with PowerMax Blog
This report is sponsored by Dell Technologies. All views and opinions expressed in this report are based on our unbiased view of the product(s) under consideration.


 Amazon