

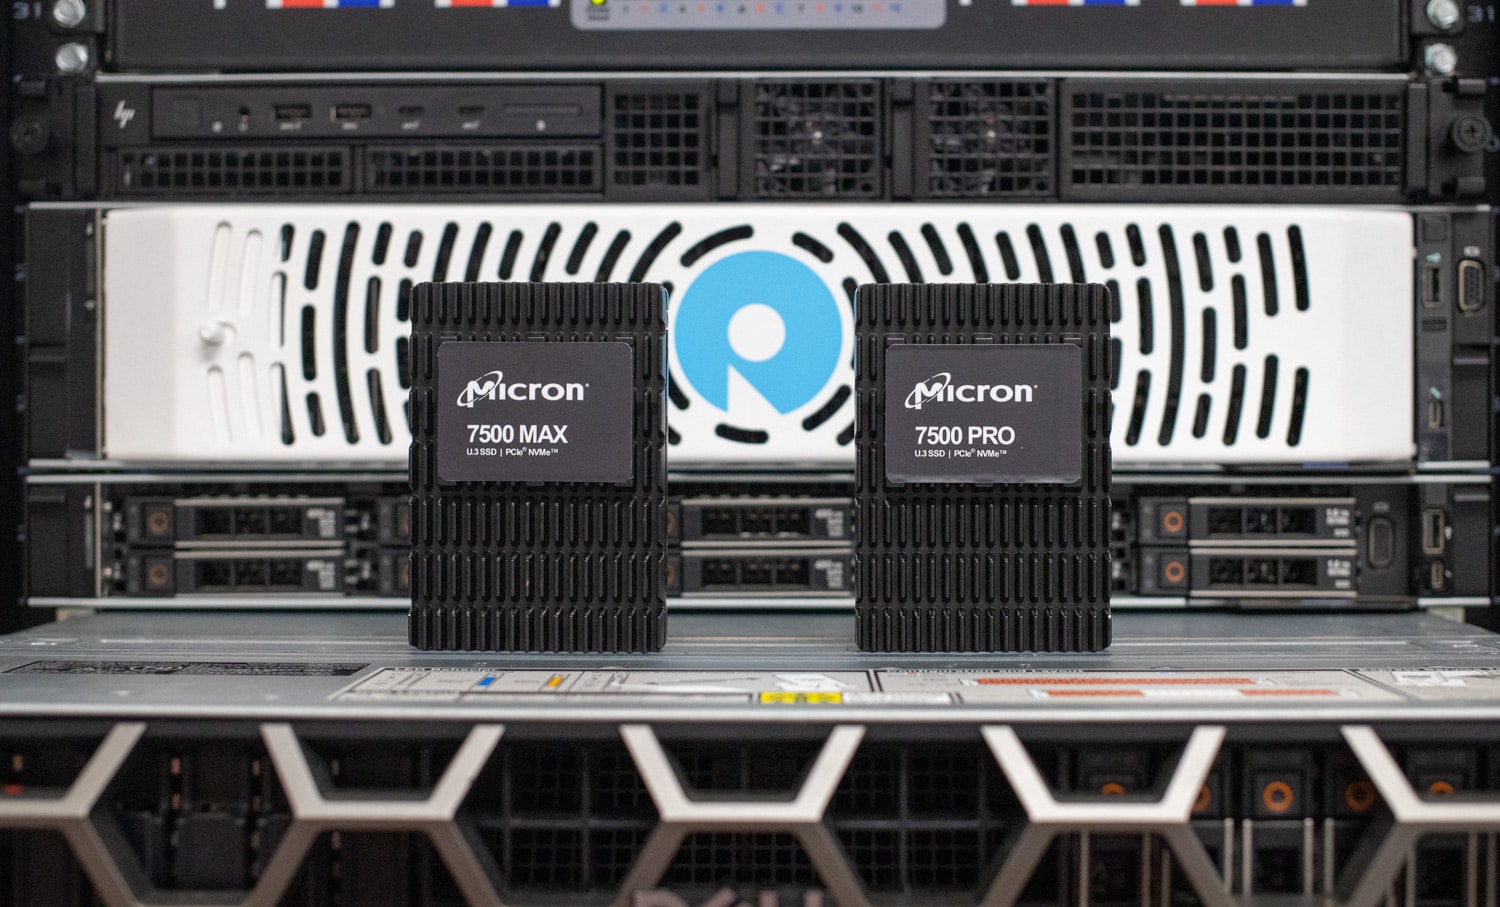
The Micron 7500 Pro and Max enterprise SSD series extend on the success of the 7400 and 7450 SSD families. Still a Gen4 SSD, the Micron 7500 family takes the 7450 platform and equips it with new 232-layer NAND. With the 7500 drives, Micron is trying to address the needs of mainstream enterprise deployments that are largely still on Gen4. The 7500 will come in Pro (1 DWPD) and Max (3 DWPD) iterations to meet customers’ endurance needs and will ship in capacities from 800GB to 15.36TB. The 7500 will be offered in just a U.3 (U.2 backward compatible) form factor.
With Gen5 SSDs making the headlines, Micron clearly feels Gen4 slots will continue to dominate in the data center for some time. On this point they’re probably right, the transition to Gen5 has been a little bit slow and somewhat complicated. Server vendors have largely gone to EDSFF SSDs for Gen5, which means new platforms and SSD shapes, something the industry is generally slow to adopt.
As such, we get the Micron 7500 to address these needs. Compared to other drives in the market, Micron sees major advantages in their vertically integrated design, with an in-house controller, firmware, and now the new 232-layer NAND. This should translate into application performance via consistency and predictability with “best-in-class sub-1ms latency for 99.9999% QoS.”
For this review, Micron sampled our lab one 15.36TB 7500 Pro and 12.8TB 7500 Max.
Micron 7500 Pro and Micron 7500 Max Specifications
| Micron 7500 PRO: U.3/U.2: Read-Intensive, 1 Drive Write per Day | ||||||
| Capacity | 960GB | 1.92TB | 3.84TB | 7.68TB | 15.36TB | |
| Performance | Seq. Read (MB/s) |
6,800 | 6,800 | 6,800 | 7,000 | 7,000 |
| Seq. Write (MB/s) |
1,400 | 2,700 | 5,300 | 5,900 | 5,900 | |
| Rand. Read (K, IOPS) | 800 | 1,000 | 1,100 | 1,100 | 1,100 | |
| Rand. Write (K, IOPS) | 85 | 145 | 180 | 215 | 250 | |
| 70/30 Rand. Read/Write (K, IOPS) |
130 | 260 | 350 | 450 | 530 | |
| Latency | 70 (read) 15 (write) |
70 (read) 15 (write) |
70 (read) 15 (write) |
70 (read) 15 (write) |
70 (read) 15 (write) |
|
| Endurance (TBW in TB) | 1,752 | 3,504 | 7,008 | 14,016 | 28,032 | |
| Micron 7500 MAX: U.3/U.2: Mixed-Use, 3 Drive Writes per Day | ||||||
| Capacity | 800GB | 1.6TB | 3.2TB | 6.4TB | 12.8TB | |
| Performance | Seq. Read (MB/s) |
6,800 | 6,800 | 6,800 | 7,000 | 7,000 |
| Seq. Write (MB/s) |
1,400 | 2,700 | 5,300 | 5,900 | 5,900 | |
| Rand. Read (K, IOPS) | 800 | 1,000 | 1,100 | 1,100 | 1,100 | |
| Rand. Write (K, IOPS) | 145 | 270 | 390 | 400 | 410 | |
| 70/30 Rand. Read/Write (K, IOPS) |
200 | 370 | 510 | 650 | 700 | |
| Latency | 70 (read) 15 (write) |
70 (read) 15 (write) |
70 (read) 15 (write) |
70 (read) 15 (write) |
70 (read) 15 (write) |
|
| Endurance (TBW in TB) | 4,380 | 8,760 | 17,520 | 35,040 | 70,080 | |
| Common features | |
| MTTF | 2 million device hours @ 55C, 2.5 million device hours @ 50C |
| Interface | PCIe Gen4 1×4, NVMe v2.4b |
| NAND | Micron 200+ Layer 3D TLC NAND |
| Warranty | 5 years |
| Power | Seq. read (average RMS value): 15.5W Seq. write (average RMS value): 18.3W |
| Features | TCG Opal 2.01, OCP 2.0-based generic firmware, secure erase, secure boot, secure signed firmware, firmware activate without reset, NVMe-MI, power loss protection (data in-flight & at-rest), enterprise data path protection (user & meta data), Storage Executive SSD management tool, 5-year warranty |
Micron 7500 Max and Pro Performance
Testbed
Our PCIe Gen4 Enterprise SSD reviews leverage a Lenovo ThinkSystem SR635 for application tests and synthetic benchmarks. The ThinkSystem SR635 is a well-equipped single-CPU AMD platform, offering CPU power well over what’s needed to stress high-performance local storage. Synthetic tests don’t require a lot of CPU resources but still leverage the same Lenovo platform. In both cases, the intent is to showcase local storage in the best light possible that aligns with storage vendor maximum drive specs.
PCIe Gen4 Synthetic and Application Platform (Lenovo ThinkSystem SR635)
- 1 x AMD 7742 (2.25GHz x 64 Cores)
- 8 x 64GB DDR4-3200MHz ECC DRAM
- CentOS 7.7 1908
- ESXi 6.7u3
Comps
Most of our new enterprise SSD reviews are Gen5, but we opted to not include them in this review. Instead, we’ve kept it Gen4 only, but there are a few notes worth making. We’ve included Micron’s 9400 Pro for scale in terms of the Micron family. The Solidigm P5430 is a QLC drive but is also the company’s most modern mainstream Gen4 product. The 7500 Max is the Micron’s high-endurance drive with 3DWPD. Lastly, we have a wide variety of capacities represented, this is just because these are the drives we have in for review. Ideally, we’d compare the same capacities, but that’s not possible in this review.
- Samsung PM9A3 7.68TB
- KIOXIA CD6 7.68TB
- Micron 7450 Pro 7.68TB
- Micron 9400 Pro 30.72TB
- Solidigm P5430 15.36TB
Sysbench Performance
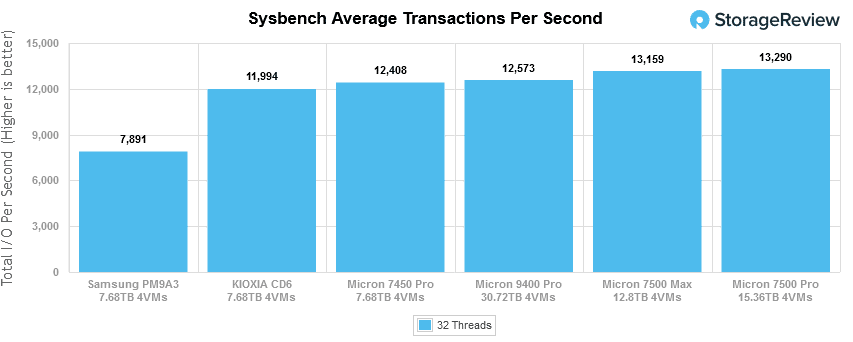
The next application benchmark consists of a Percona MySQL OLTP database measured via SysBench. This test also measures average TPS (Transactions Per Second), average latency, and average 99th percentile latency.
Each Sysbench VM is configured with three vDisks: one for boot (~92GB), one with the pre-built database (~447GB), and the third for the database under test (270GB). From a system resource perspective, we configured each VM with eight vCPUs, and 60GB of DRAM and leveraged the LSI Logic SAS SCSI controller.
Sysbench Testing Configuration (per VM)
- CentOS 6.3 64-bit
- Percona XtraDB 5.5.30-rel30.1
-
- Database Tables: 100
- Database Size: 10,000,000
- Database Threads: 32
- RAM Buffer: 24G
- Test Length: 3 hours
- 2 hours preconditioning 32 threads
- 1 hour 32 threads
For the average TPS test, the Micron 7500 Max and Pro models were at the top of the leaderboard, recording 13,159 and 13,290, respectively. This is a noticeable uptick in performance over the last-gen Micron 9400 Pro, which had 12,572.
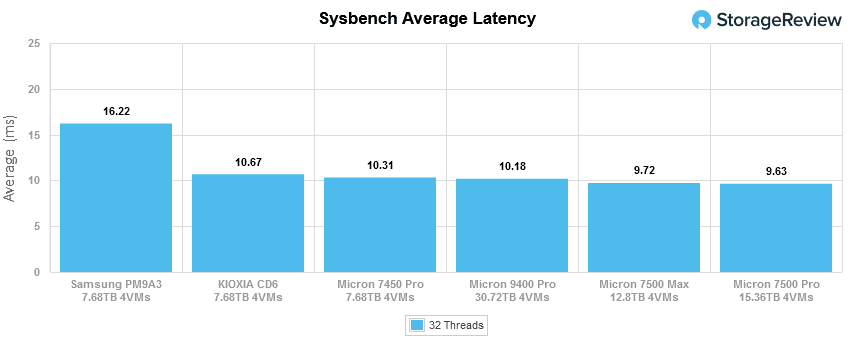
In average latency, both Micron 7500 models edged out the competition again, with 9.72ms for the Max and 9.62ms for the Pro. In comparison, the 9400 Pro model posted 10.18ms.
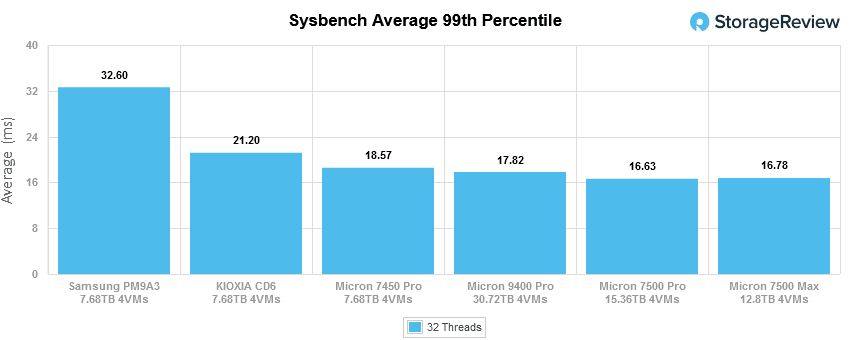
Our worst case (99th percentile) Sysbench test sees the Micron 7500 models take first again, showing 16.63ms (Pro) and 16.76ms (Max).
VDBench Workload Analysis
When it comes to benchmarking storage devices, application testing is best, and synthetic testing comes in second place. While not a perfect representation of actual workloads, synthetic tests help baseline storage devices with a repeatability factor that makes it easy to make apples-to-apples comparisons between competing solutions. These workloads offer a range of testing profiles ranging from “four corners” tests and common database transfer size tests to trace captures from different VDI environments.
All of these tests leverage the common vdBench workload generator, with a scripting engine to automate and capture results over a large compute testing cluster. This allows us to repeat the same workloads across a wide range of storage devices, including flash arrays and individual storage devices. Our testing process for these benchmarks fills the entire drive surface with data and then partitions a drive section equal to 25% of the drive capacity to simulate how the drive might respond to application workloads. This differs from full entropy tests, which use 100 percent of the drive and take them into a steady state. As a result, these figures will reflect higher-sustained write speeds.
Profiles:
- 4K Random Read: 100% Read, 128 threads, 0-120% iorate
- 4K Random Write: 100% Write, 128 threads, 0-120% iorate
- 64K Sequential Read: 100% Read, 32 threads, 0-120% iorate
- 64K Sequential Write: 100% Write, 16 threads, 0-120% iorate
- 64K Random Read: 100% Read, 32 threads, 0-120% iorate
- 64K Random Write: 100% Write, 16 threads, 0-120% iorate
- Synthetic Database: SQL and Oracle
- VDI Full Clone and Linked Clone Traces
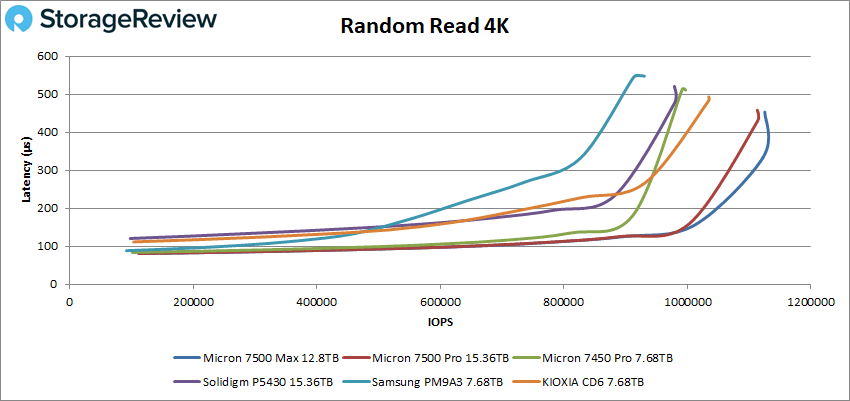
In our first VDBench Workload Analysis, random 4K read, the Micron 7500 Max had a peak performance of 1.13 million IOPS (979 IOPS) at a latency of 453ms while the Pro wasn’t far behind at 1.11 million IOPS at 458ms. This placed the Micron drives at the top of the leaderboard.
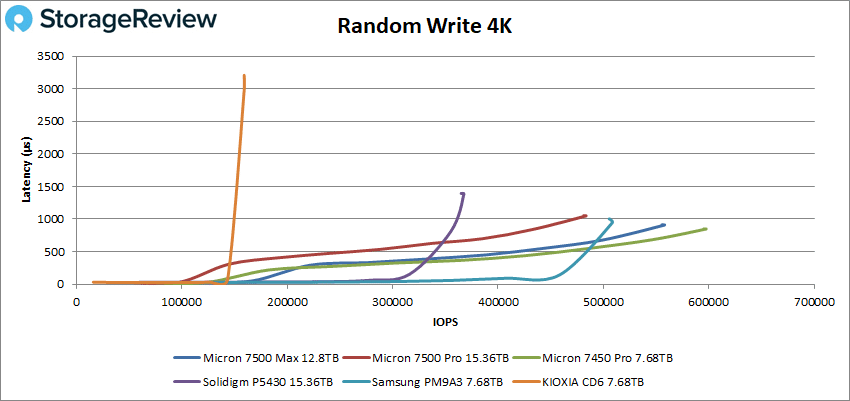
 In 4K random write, the Micron 7500 Max and Pro hit peaks of 558K IOPS and 483K IOPS, respectively, with latencies of 908ms and 1,049µs.
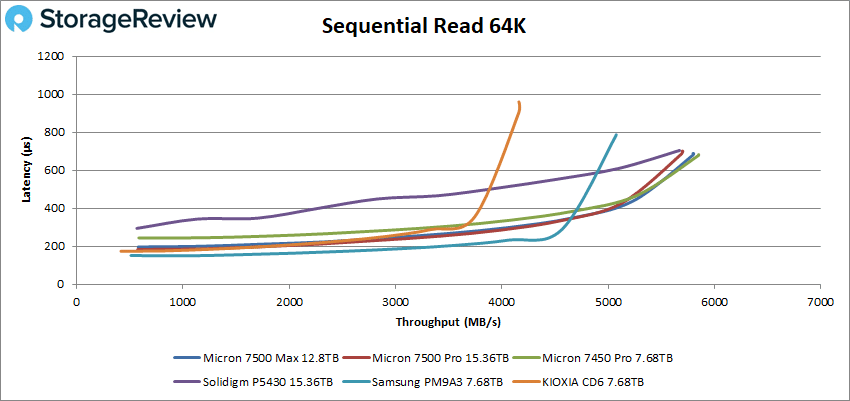
Switching over to 64k sequential workloads, the Micron 7500 Max and Pro continued with their solid performance peaking at 5.8GB/s (93K IOPS) and 5.7GB/s (91K IOPS) with a latency of 688.5µs/700.7ms.
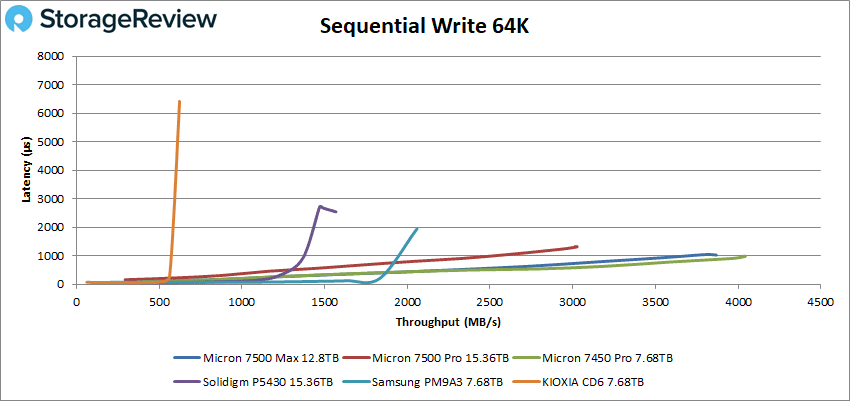
In sequential writes, the Micron Pro and Max peaked at 3.87GB/s and 3.03GB/s, respectively. Latencies were 1,024.5ms and 1,312.5ms.
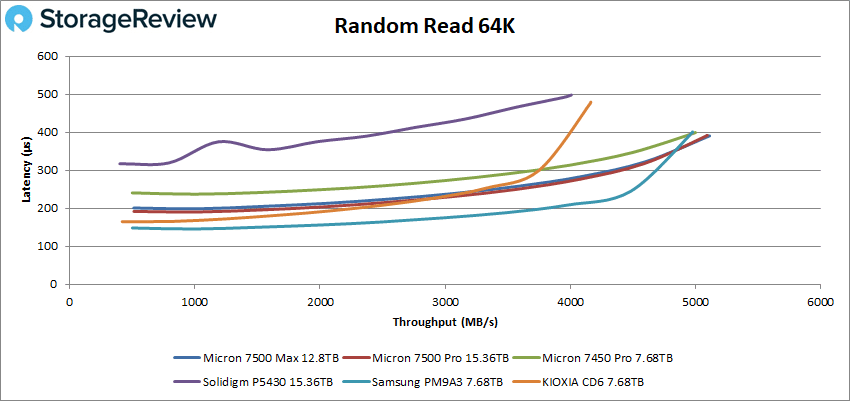
Next up is our 64K random performance. In reads, the Micron 7500 Max and Pro scored nearly identical performance, showing 82K IOPS (5.11GB/s) and 81K IOPS (5.09GB/s) , respectively. In latency, the Pro ended at 391.6ms while the Max hit 390.3ms.
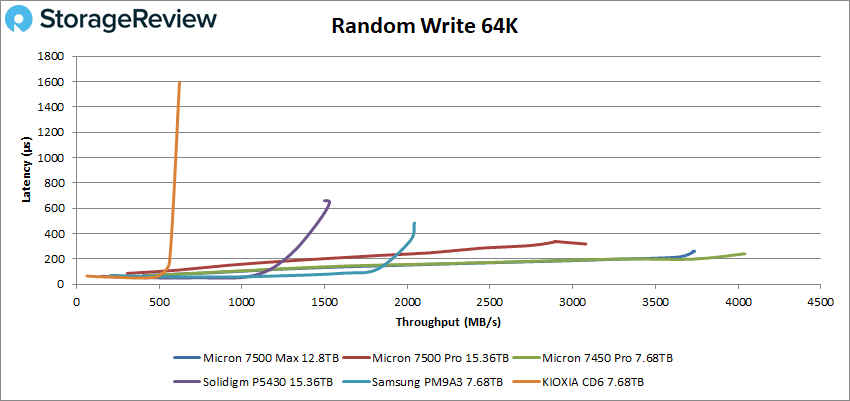
In 64K random write, the Micron 7500 Pro and Max showed 65K IOPS (4.03GB/s) and 49K IOPS (3.08GB/s), while latencies hit 260ms and 317.3ms, respectively.
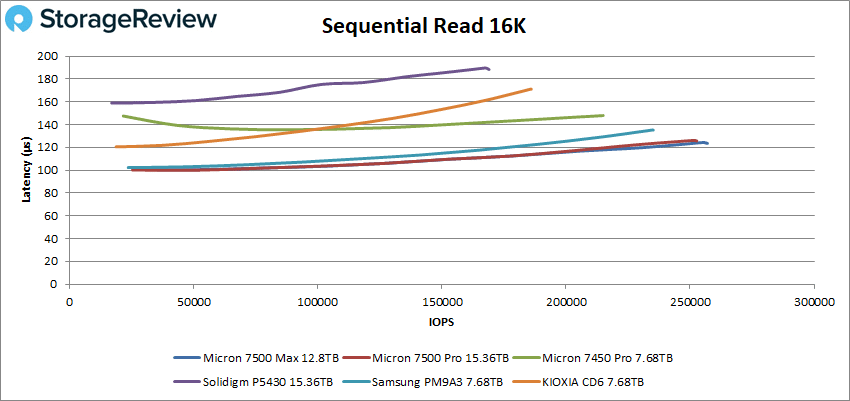
Next up are the 16K tests. In sequential reads, the Micron 7500 Max showed an impressive 257K IOPS (4.01GB/s) at 123.6µs, while the Pro was right on its tail with 253K (3.95GB/s) at 127.3ms.
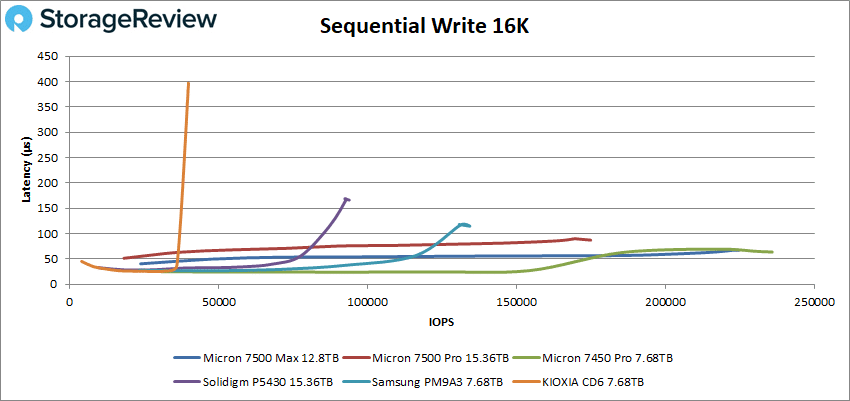
In sequential write 16K, the Micron 7500 Max pulled ahead as expected, reaching 225K IOPS (3.51GB/s) at just 67µs. The Max showed respectable scores of 175K IOPS (2.73GB/s) at 87.1ms.
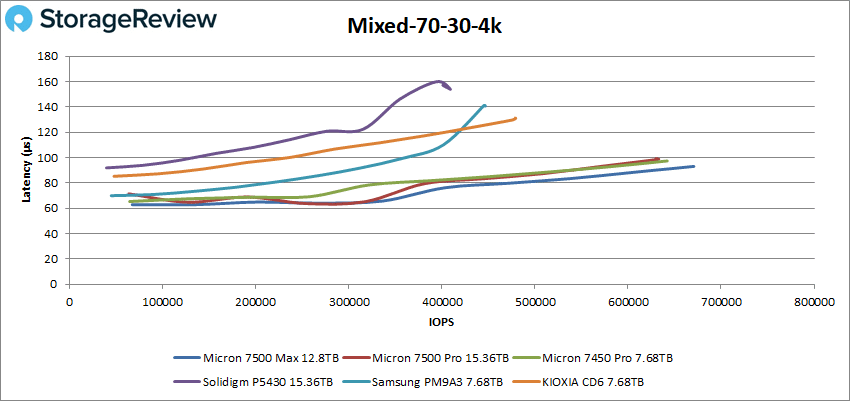
Now for our mixed read/write profiles, starting with 70/30 4K. Here, the Micron 7500 Max drive hit 670K IOPS at 93µs for first, while the Pro iteration recorded a peak of 633K IOPS at 98.7µs.
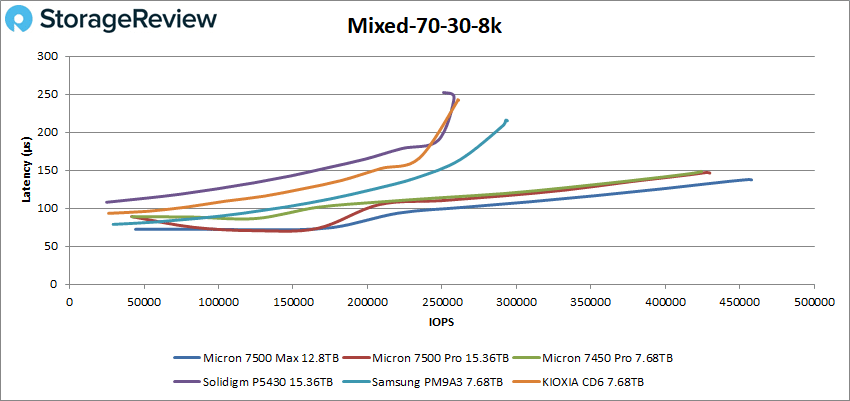
 In the 70/30 8K profile, the impressive performance of the new Micron drives continued. The Max model completed the test at 458K IOPS at 137.3µs, while the Pro model hit 430K IOPS at 146.3ms.
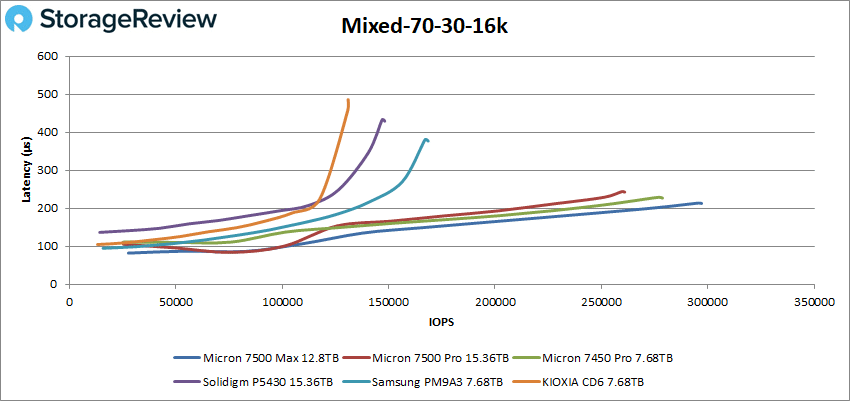
Next up is the 16k 70/30 test, where the Max model posted a leading peak of 297K IOPS at 212.7µs. The Pro was able to hit 261K IOPS with a latency of 242.4ms.
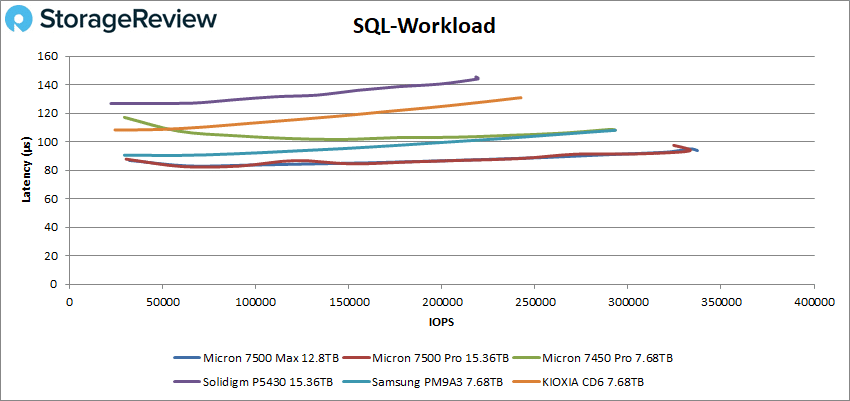
Our next set of tests is our SQL workloads: SQL, SQL 90-10, and SQL 80-20. Starting with SQL, the Micron 7500 Max and Pro had virtually identical results up until the very end when the Pro had a small spike. Here, the Max posted a peak performance of 337K IOPS with a latency of 93.8µs placing it at the top of the leaderboard. The Pro model ended the test at of 325K IOPS with a latency of 97.5ms.
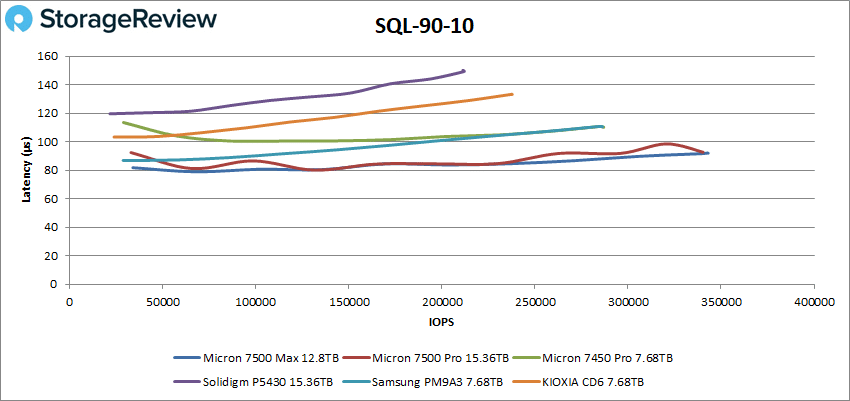
 SQL 90-10, the Max posted a peak performance of 343K IOPS with a latency of 92µs, again placing first. The Pro model was a hair behind, peaking at 340K IOPS with a latency of 92.7µs.
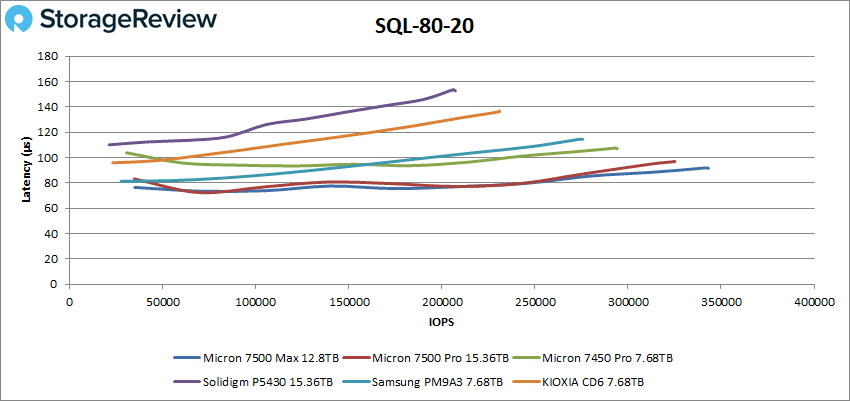
With SQL 80-20, the Micron 7500 Max posted a peak performance of 343K IOPS with a latency of 91.6µs placing it at the top of the leaderboard. The Pro model wasn’t too far behind with a peak of 325K IOPS at 96.8ms.
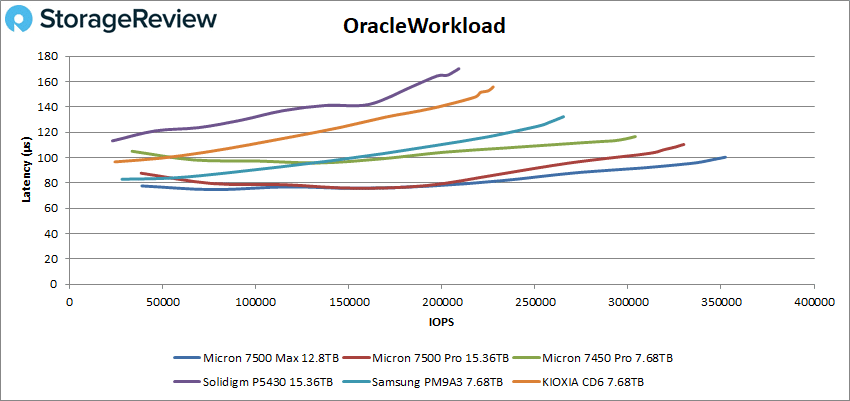
Next up are our Oracle workloads: Oracle, Oracle 90-10, and Oracle 80-20. As with the SQL benchmarks and others, the Micron 7500 Max continued to take first place. In the general SQL test, the Max showed peak performance of 352K IOPS with a latency of 100.3µs, while the Pro model ended the test at of 330K IOPS with a latency of 110.4ms.
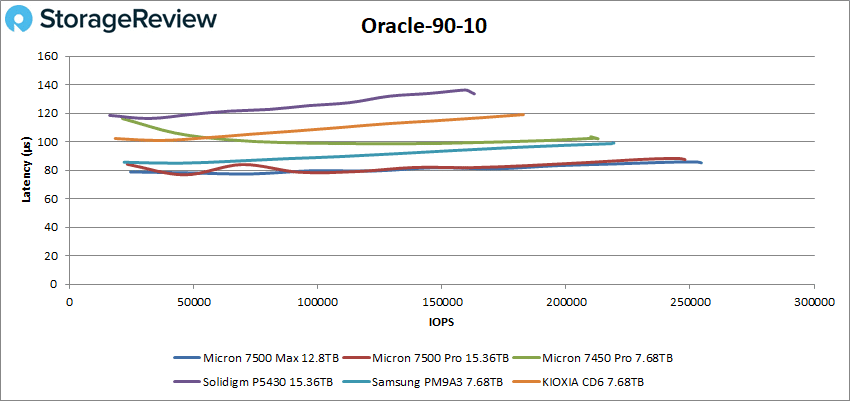
Looking at Oracle 90-10, the Max posted a peak performance of 255K IOPS with a latency of 85.2µs, again placing first. The Pro model peaked at 248K IOPS with a latency of 87.5µs.
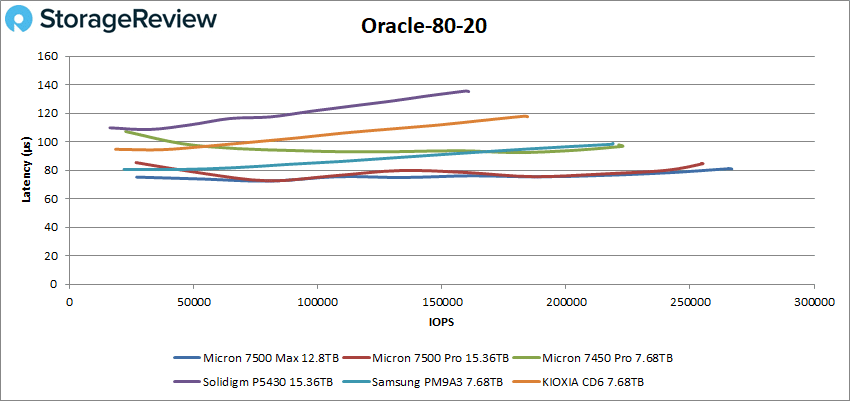
Next up is Oracle 80-20, where the Max posted a peak performance of 267K IOPS with a latency of 80.9µs, while the Pro model ended the test at of 255K IOPS with a latency of 84.6ms.
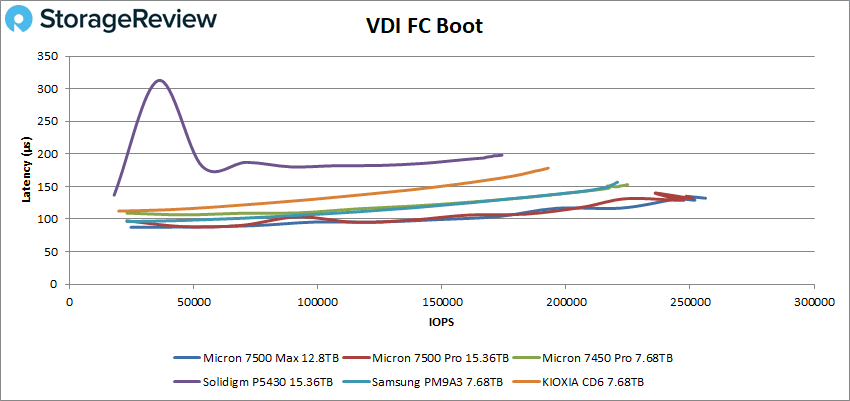
Next, we switched to our VDI clone test, Full and Linked. For VDI Full Clone (FC) Boot, the Max peaked at 256K IOPS with a latency of 132.1µs, while the Pro hit 251K IOPS at 131.7ms.
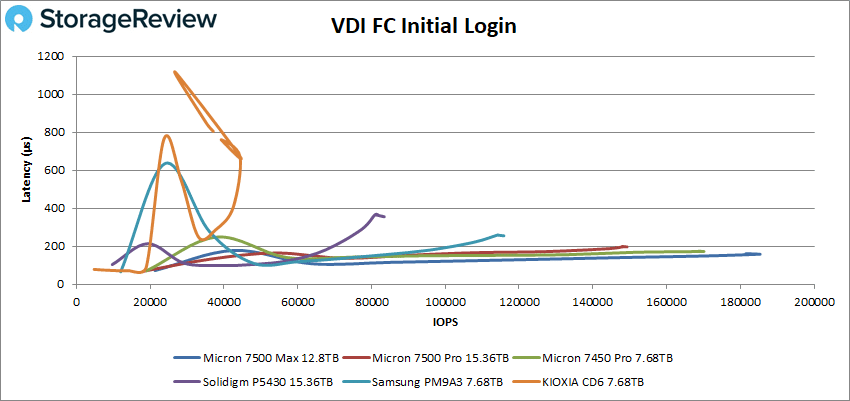
 During VDI FC Initial Login, the Micron 7500 Max peaked at 185K IOPS with a latency of 157.8µs, while the Pro model was able to reach 150K IOPS at 196.9ms.
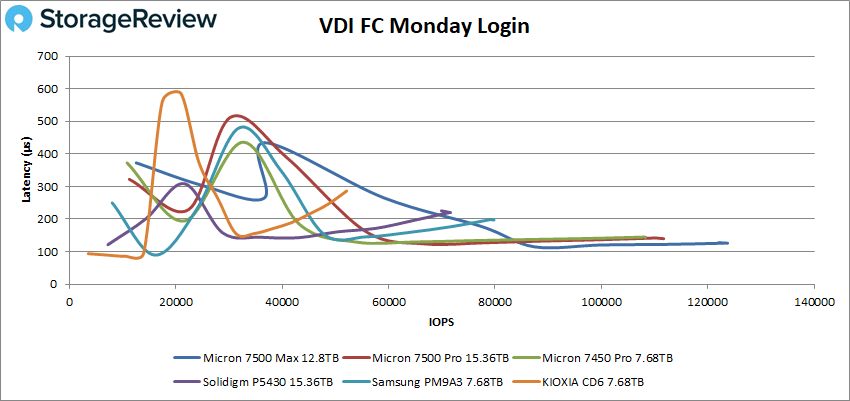
With VDI FC Monday Login, the Micron 7500 Max posted 124K IOPS at a latency of 126.1µs before (once again, taking first place), while the Pro hit a respectable 112K IOPS and 140ms in latency.
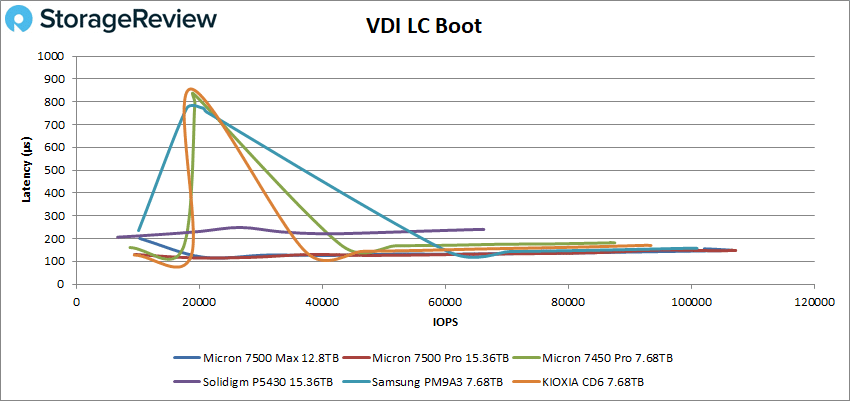
For VDI Linked Clone (LC), the Micron drives finally slowed down in some of the tests. In boot, the Pro model actually outperformed the Max ending the test at 107K IOPS with a latency of 148µs. The Max showed 102K IOPS with a latency ending at 155.5ms.
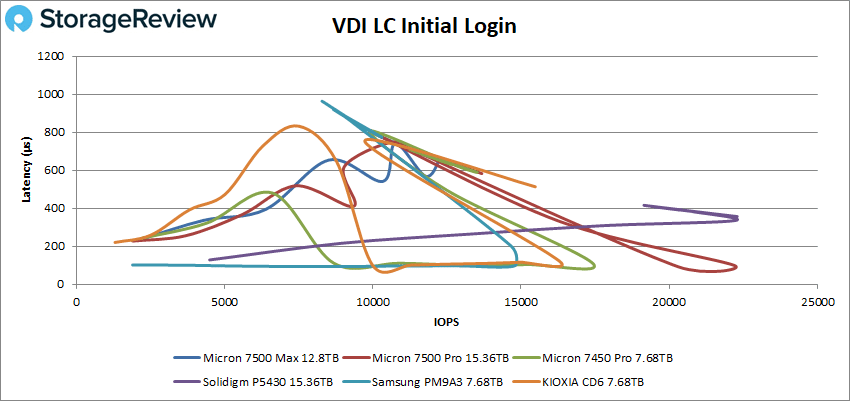
 In VDI LC Initial Login, the Micron 7500 drives showed instability, where the Max peaked at 12K IOPS at roughly 652.4µs, before taking a fairly big spike in performance at the end. The Pro hit 22K at one point before taking a huge spike at the end.
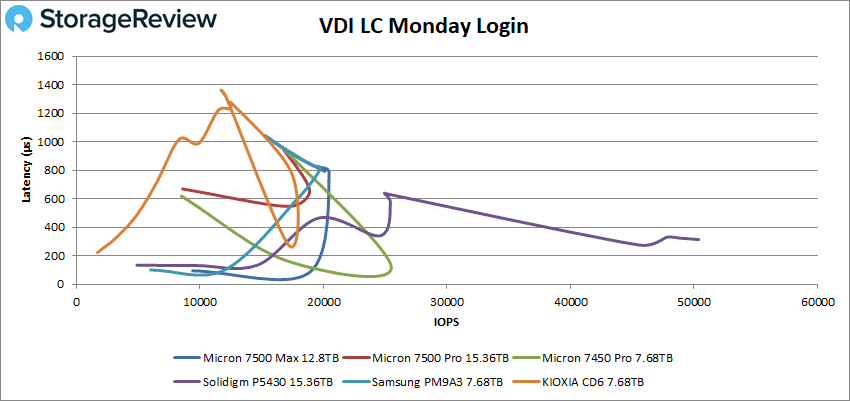
For VDI LC Monday Login, the Micron 7500 Pro didn’t last long before it stopped, peaking at 19K before taking another big spike in performance. The Max didn’t fare much better, taking another spike in performance once it hit 20K IOPS.
Conclusion
The Micron 7500 Pro and Max series have firmly established themselves as top-performing SSDs in the enterprise market, consistently topping leaderboards in our performance metrics. Notably, the Max model demonstrates a modest but important advantage over the Pro model in most tests, especially in write performance. This clearly identifies the Max model as a particularly robust option for applications that demand high write, and mixed-used capabilities due to its higher endurance rating.
Ultimately, the Micron 7500 series is a solid advancement in mainstream enterprise computing, thanks to its vertically integrated design that includes an in-house controller, firmware, and the new 232-layer NAND. This is an important step forward for Micron, which has often relied on third-party controllers while adding their own NAND. Owning a complete platform enhances the company’s competitive edge, providing them with greater control over performance metrics like consistency and latency. We look forward to seeing Micron continue investing in its intellectual property to create even more outstanding SSDs.
Although the 7500 series exhibited impressive performance across the board, it’s worth noting that there were some minor inconsistencies, especially in the VDI Linked Clone tests. However, these hiccups do little to tarnish the otherwise exceptional results of both the 7500 Pro and Max models. They excel in meeting the requirements of different endurance and capacity needs, making them highly adaptable for diverse enterprise deployments.
Overall, the Micron 7500 series clearly demonstrates the full capabilities of Gen4 SSD technology. As we transition into an era where Gen5 technology is starting to take center stage, both the Micron 7500 Pro and Max present themselves as great robust, options for organizations aiming to optimize their data centers right now.


 Amazon