

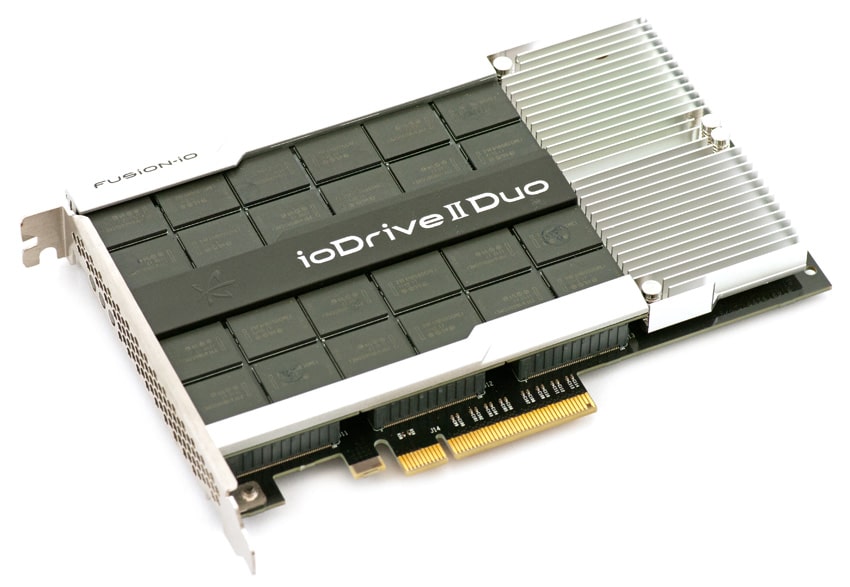
The Fusion-io ioDrive2 Duo MLC is a full-height half-length (FHHL) application accelerator that provides up to 2.4TB of capacity via x8 PCI Express slot. Fusion-io cards are notorious for their throughput performance as well as their low latencies, the combination of which drives some of the best responsiveness in the industry. Fusion-io's ioDrive2 cards are all fundamentally all the same, with hardware differences that differentiate. In this case, the ioDrive2 Duo combines a second controller and doubles the NAND pool compared to a standard ioDrive2. Fusion-io is also using MLC in this iteration, meaning users can get twice the capacity when compared to the SLC versions of the drives. Performance wise the MLC and SLC ioDrive2 Duo cards perform pretty similarly, the most obvious differences come in read latency, 68µs for the MLC and 47µs for the SLC, and endurance.
In prior reviews of the ioDrive2 Duo SLC and ioDrive2 MLC, we've heavily detailed the updates and enhancements over the Gen1 cards both in terms hardware and software features. It is worth noting each time a few fundamental tenants that come with Fusion-io cards. ioMemory cards rely on host CPU for offloading much of the work. This leverages one of the most expensive resources within the server that is often underutilized, even in heavily virtualized environments. Fusion-io also uses an FPGA as the NAND controller, which gives them more programmability and opportunities to make greater enhancements over the life of the product when compared to an ASIC. The drive also features Adaptive FlashBack technology which allows the drive to suffer from NAND failures without risking any data loss or down time while the drive remaps. Fusion-io has also enhanced their VSL software to provide improved small block performance, and it provides the most robust drive management software on the market with ioSphere.
The ioDrive2 Duo currently ships in two versions, a 2.4TB MLC model and 1.2TB SLC model.
Fusion-io ioDrive2 Duo MLC Specifications
- Performance
- Read Bandwidth (1MB): 3.0 GB/s
- Write Bandwidth (1MB): 2.5 GB/s
- Ran. Read IOPS (512B): 540,000
- Ran. Write IOPS (512B): 1,100,000
- Ran. Read IOPS (4K): 480,000
- Ran. Write IOPS (4K): 490,000
- Read Access Latency: 68us
- Write Access Latency: 15us
- 2xnm NAND Flash Memory Multi-Level Cell (MLC)
- Bus Interface: PCI-Express 2.0 x8 electrical x8 physical
- Weight: <11 ounces
- Form Factor: full-height, half-length (FHHL)
- Warranty: 5 years or maximum endurance used
- Supported Operating Systems
- Microsoft Windows: Windows Server 2012, Windows Server 2008 R2, 64-bit Windows Server 2008, 64-bit Windows Server 2003
- Linux: RHEL 5/6; SLES 10/11; OEL 5/6; CentOS 5/6; Debian Squeeze; Fedora 16/17; openSUSE 12; Ubuntu 10/11/12
- UNIX: Solaris 10/11 x64; OpenSolaris 2009.06 x64; OSX 10.6/10.7/10.8
- Hypervisors:
- VMware ESX 4.0/4.1/ESXi 4.1/5.0/5.1, Windows 2008 R2 with Hyper-V, Hyper-V Server 2008 R2
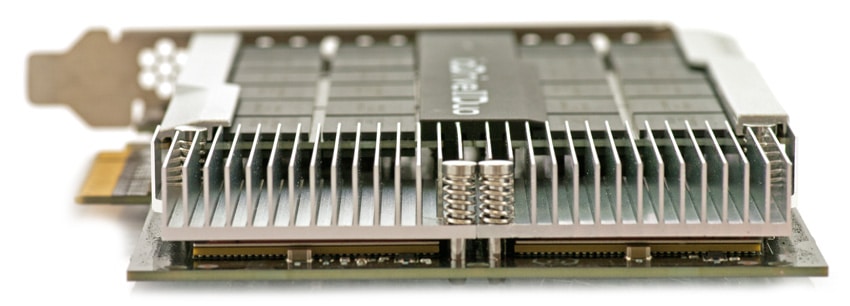
Design and Build
The Fusion ioDrive2 Duo 2.4TB MLC is a Full-Height Half-Length (FHHL) x8 PCI-Express 2.0 card, with two controllers and a PCIe switch attached to the main circuit board. The NAND is attached through two daughter boards, giving Fusion a manufacturing advantage when switching to new NAND configurations. Instead of redesigning the card each time a lithography change rolls around (NAND die shrink), they can install a new daughter board and flash new firmware onto the FPGA. Our MLC ioDrive2 Duo is formed with two 1,200GB ioMemory devices, each using 4 lanes of the PCIe connection. The PCB layout is very efficient, with large passive heatsinks covering the two controllers on the right side of the card.
The ioDrive2 Duo MLC shares the same layout, as well as management software with other ioMemory products from Fusion-io. For additional information on those, see our review of the ioDrive2 Duo SLC or ioDrive2 MLC.
Testing Background and Comparables
The Fusion-io ioDrive2 Duo MLC uses two 40nm Xilinx Virtex-6 FPGA controller and Intel MLC NAND with a PCIe 2.0 x8 interface.
Comparables for this review:
- Fusion-io ioDrive2 (1.2TB, 1 x Xilinx Virtex-6 FPGA controllers, MLC NAND, PCIe 2.0 x4)
- Huawei Tecal ES3000 (2.4TB, 3 x Proprietary FPGA controllers, MLC NAND, PCIe 2.0 x8)
- Micron P420m (1.6TB, IDT Controller, MLC NAND, PCIe 2.0 x8)
- Virident FlashMAX II (2.2TB, 2 x Proprietary FPGA controllers, eMLC NAND, PCIe 2.0 x8)
All PCIe Application Accelerators are benchmarked on our second-generation enterprise testing platform based on a Lenovo ThinkServer RD630. For synthetic benchmarks, we utilize FIO version 2.0.10 for Linux and version 2.0.12.2 for Windows. In our synthetic testing environment, we use a mainstream server configuration with a clock speed of 2.0GHz, although server configurations with more powerful processors could yield even greater performance.
- 2 x Intel Xeon E5-2620 (2.0GHz, 15MB Cache, 6-cores)
- Intel C602 Chipset
- Memory – 16GB (2 x 8GB) 1333Mhz DDR3 Registered RDIMMs
- Windows Server 2008 R2 SP1 64-bit, Windows Server 2012 Standard, CentOS 6.3 64-Bit
- 100GB Micron P400e Boot SSD
- LSI 9211-4i SAS/SATA 6.0Gb/s HBA (For boot SSDs)
- LSI 9207-8i SAS/SATA 6.0Gb/s HBA (For benchmarking SSDs or HDDs)
It's worth noting that the comparables we've selected are largely MLC-based drives, with the exception of the SLC Micron PCIe drive. That said, not all PCIe drives are created equally both in terms of performance targets and price. Specific applications require specific storage needs, thus we've opted to standardize the comps on NAND type rather than number of controllers, etc.
Application Performance Analysis
In order to understand the performance characteristics of enterprise storage devices, it is essential to model the infrastructure and the application workloads found in live production environments. Our first three benchmarks of the Seagate 1200 SSD are therefore the MarkLogic NoSQL Database Storage Benchmark, MySQL OLTP performance via SysBench and Microsoft SQL Server OLTP performance with a simulated TCP-C workload.
Our MarkLogic NoSQL Database environment requires groups of four SSDs with a usable capacity of at least 200GB, since the NoSQL database requires roughly 650GB of space for its four database nodes. Our protocol uses an SCST host and presents each SSD in JBOD, with one allocated per database node. The test repeats itself over 24 intervals, requiring between 30-36 hours total for the SSDs in this class. MarkLogic records total average latency as well as interval latency for each SSD.
Comparing overall average latency in our MarkLogic NoSQL benchmark, the Fusion-io ioDrive2 Duo MLC performed very well, ranking closely towards the top of the pack.
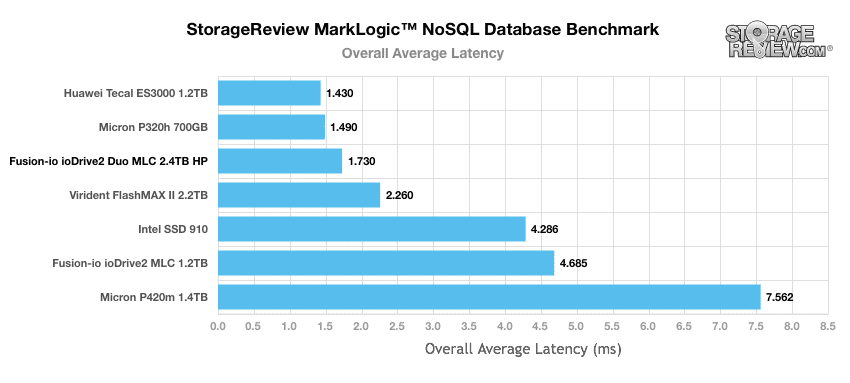
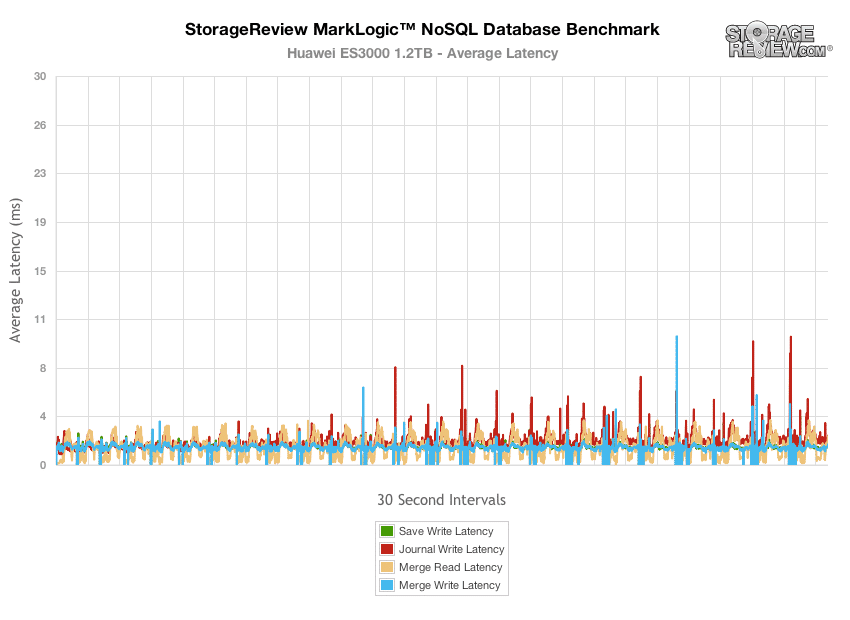
The Huawei ES3000 1.2TB HP offered the best latency in the group, with peak average interval latency measuring between 3.5-9.9ms.
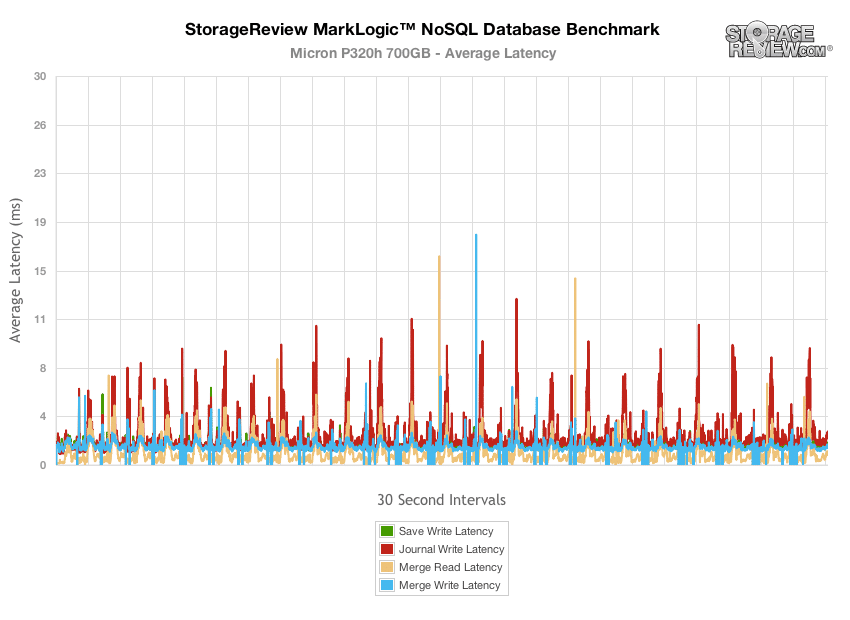
The SLC-based Micron P320h 700GB came in next in the group, with peaks measuring between 12-17.7ms.
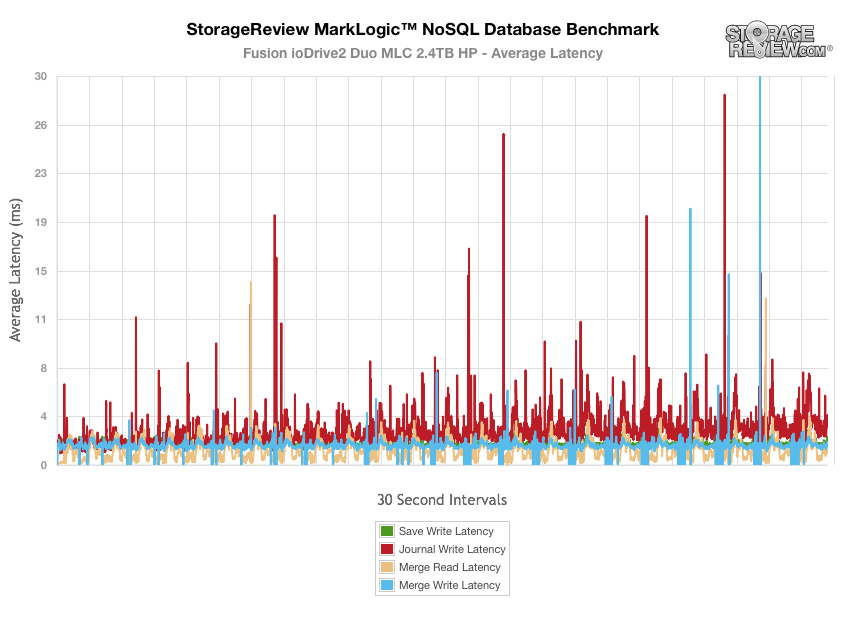
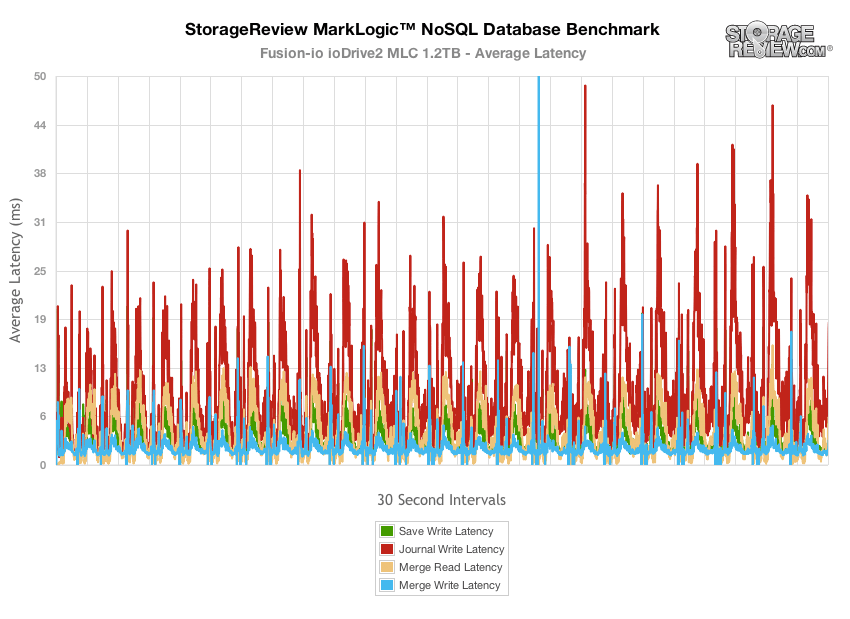
Looking at the full latency output from the ioDrive2 Duo MLC, it kept its response times fairly tight, with a few spikes in the 25-30+ms range.
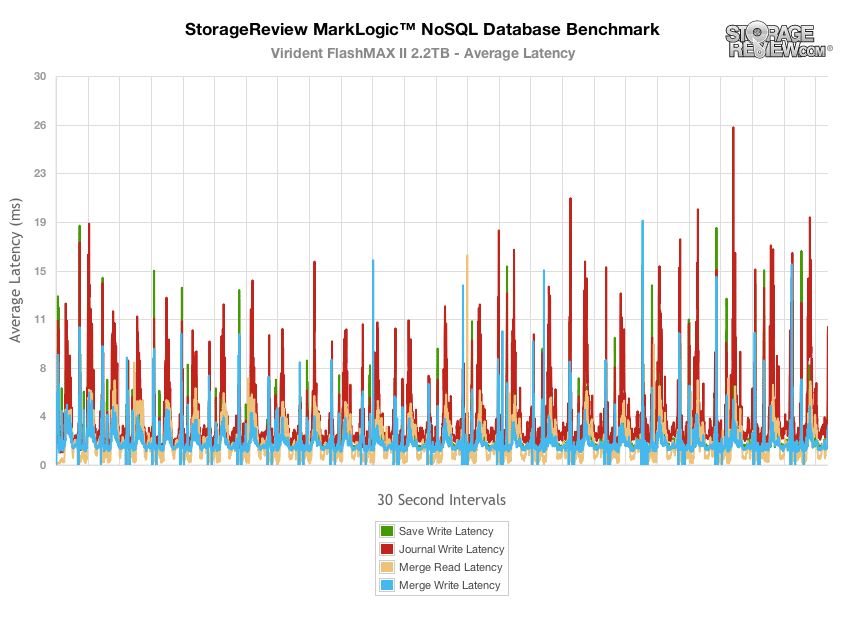
The Virident FlashMAX II 2.2TB HP slotted itself in the middle of our MLC-based PCIe SSD pack, with average latency peaks measuring between 16-26ms.
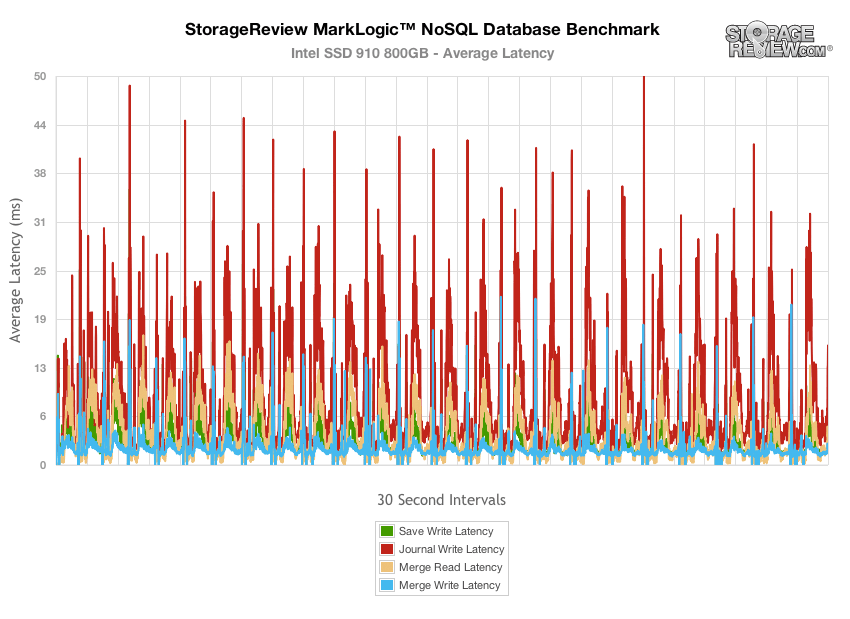
The Intel SSD 910 jumped in overall average latency compared to the Virident FlashMAX II 2.2TB, with peaks ranging from 6-50ms.
The Fusion-io ioDrive2 also trailed the multi-controller PCIe Application Accelerators with peaks also ranging in the 6-50ms range.
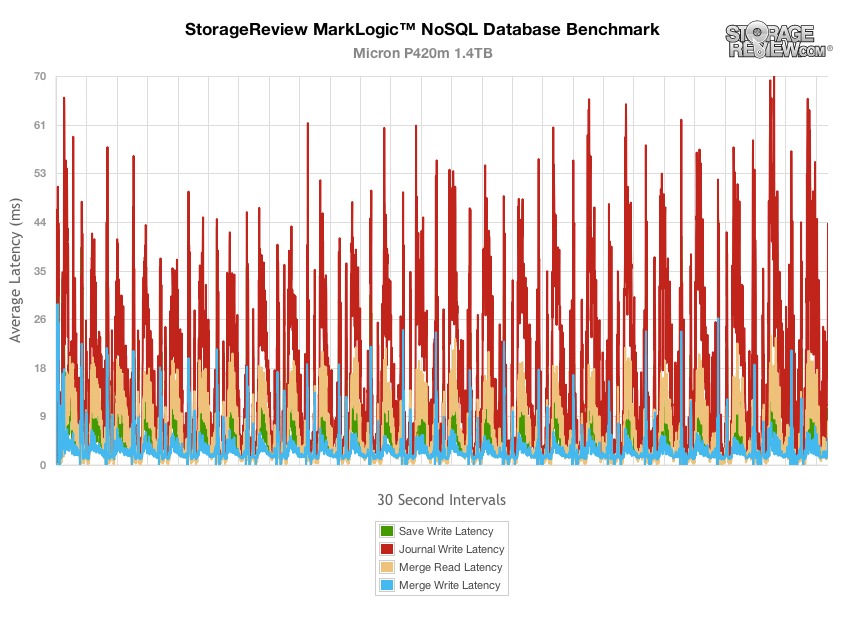
The Micron P420m came in towards the bottom of the group in our MarkLogic NoSQL database test, with peaks measuring between 25-74ms.
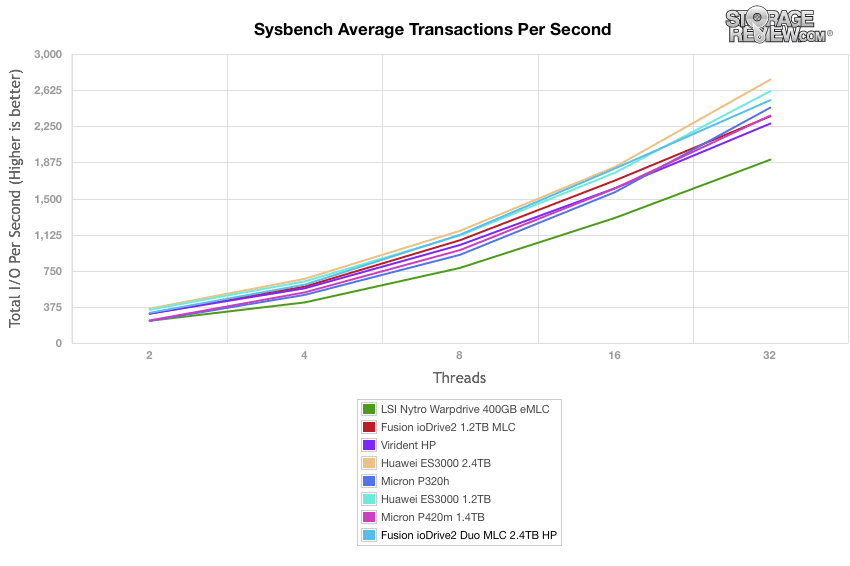
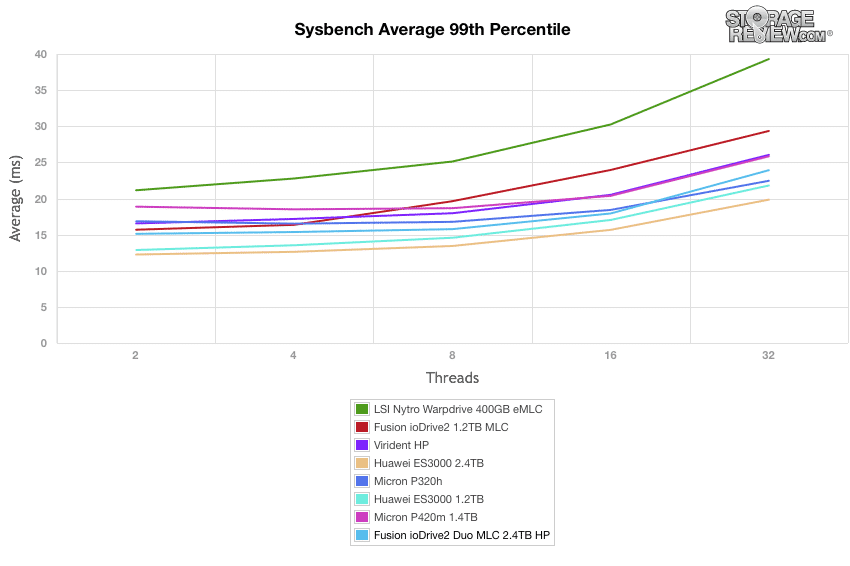
Our next application test consists of Percona MySQL database test via SysBench, which measures the performance of OLTP activity. In this testing configuration, we use a group of Lenovo ThinkServer RD630s and load a database environment onto a single SATA, SAS or PCIe drive. This test measures average TPS (Transactions Per Second), average latency, as well as average 99th percentile latency over a range of 2 to 32 threads. Percona and MariaDB are using the Fusion-io flash-aware application APIs in the most recent releases of their databases, although for the purposes of this comparison we test each device in their "legacy" block-storage modes.
The ioDrive2 Duo MLC came in third in our Sysbench test, trailing the Huawei ES3000 PCIe SSDs. It offered performance ranging from 313 TPS at 2-threads up to 2,521 TPS at 32-threads.
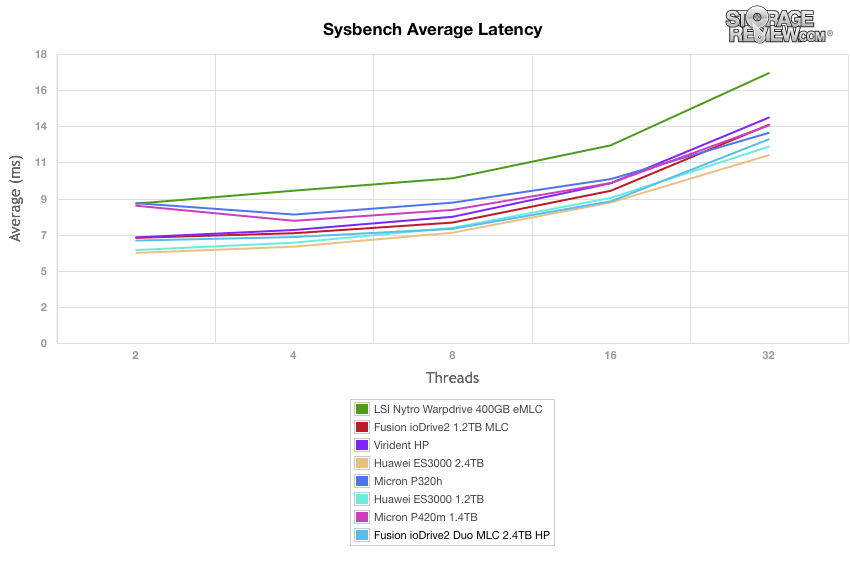
Comparing average latency in our Sysbench test, the Fusion-io ioDrive2 Duo MLC scaled from 6.38ms at 2-threads up to 12.69ms at 32-threads.
Looking at the ioDrive2 Duo MLC's 99th percentile latency, it remained very consistent under load, ranging from 15.11ms at 2-thread and increasing to 23.92ms at 32-threads.
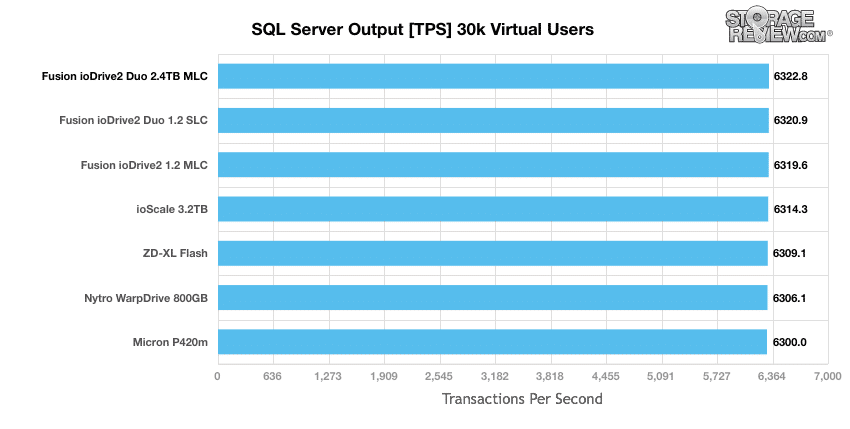
StorageReview’s Microsoft SQL Server OLTP testing protocol employs the current draft of the Transaction Processing Performance Council’s Benchmark C (TPC-C), an online transaction processing benchmark that simulates the activities found in complex application environments. The TPC-C benchmark comes closer than synthetic performance benchmarks to gauging the performance strengths and bottlenecks of storage infrastructure in database environments. Our SQL Server protocol uses a 685GB (3,000 scale) SQL Server database and measures the transactional performance and latency under a load of 30,000 virtual users.
Comparing the transactional performance of our SQL Server benchmark, none of the PCIe application accelerators had trouble keeping up with the maximum capable from our server configuration. For this category the focus is more on the latency aspect below.
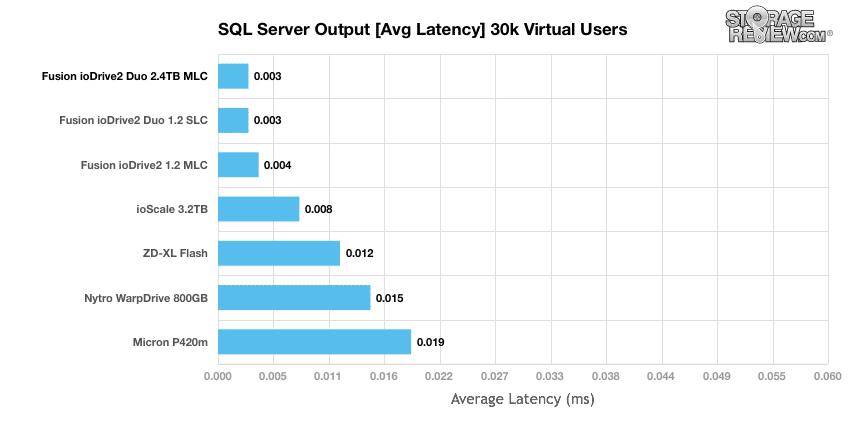
When it came to lowest average latency, Fusion-io dominated our SQL Server benchmark with the top 4 results and the ioDrive2 Duo MLC taking the top spot with 3ms.
Enterprise Synthetic Workload Analysis
Flash performance varies throughout the preconditioning phase of each storage device. Our synthetic enterprise storage benchmark process begins with an analysis of the way the drive performs during a thorough preconditioning phase. Each of the comparable drives are secure erased using the vendor's tools, preconditioned into steady-state with the same workload the device will be tested with under a heavy load of 16 threads with an outstanding queue of 16 per thread, and then tested in set intervals in multiple thread/queue depth profiles to show performance under light and heavy usage.
- Preconditioning and Primary Steady-State Tests:
- Throughput (Read+Write IOPS Aggregate)
- Average Latency (Read+Write Latency Averaged Together)
- Max Latency (Peak Read or Write Latency)
- Latency Standard Deviation (Read+Write Standard Deviation Averaged Together)
Our Enterprise Synthetic Workload Analysis includes two profiles based on real-world tasks. These profiles have been developed to make it easier to compare to our past benchmarks as well as widely-published values such as max 4k read and write speed and 8k 70/30, which is commonly used for enterprise hardware.
- 4k
- 100% Read or 100% Write
- 100% 4k
- 8k 70/30
- 70% Read, 30% Write
- 100% 8k
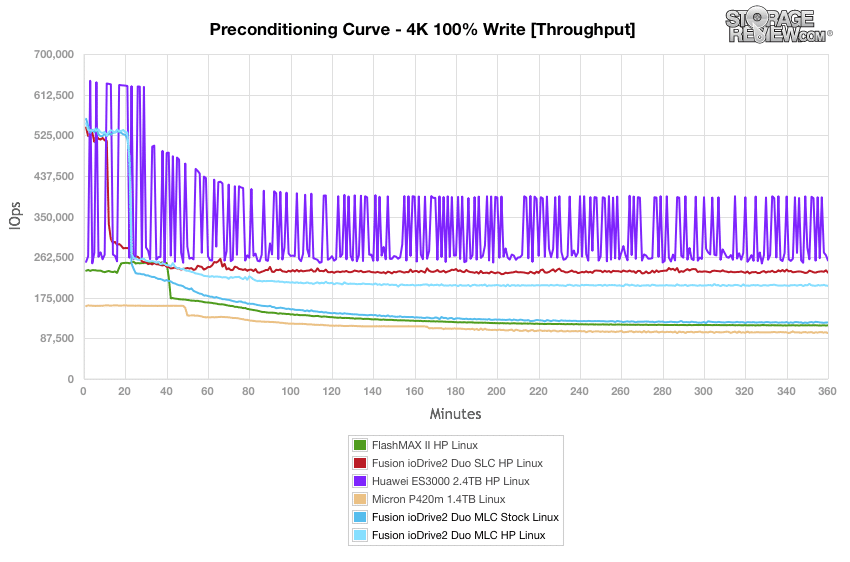
In this testing, we compared six drives (FlashMAX II HP, Fusion ioDrive2 Duo SLC HP, Huawei ES3000 2.4TB HP, Micron P420m 1.4TB, Fusion ioDrive2 Duo MLC Stock, and Fusion ioDrive2 Duo MLC HP) over both Linux and Windows. Additionally, with the ioDrive2 Duo MLC, we utilized its overprovisioning capability for a high performance (HP) testing mode.
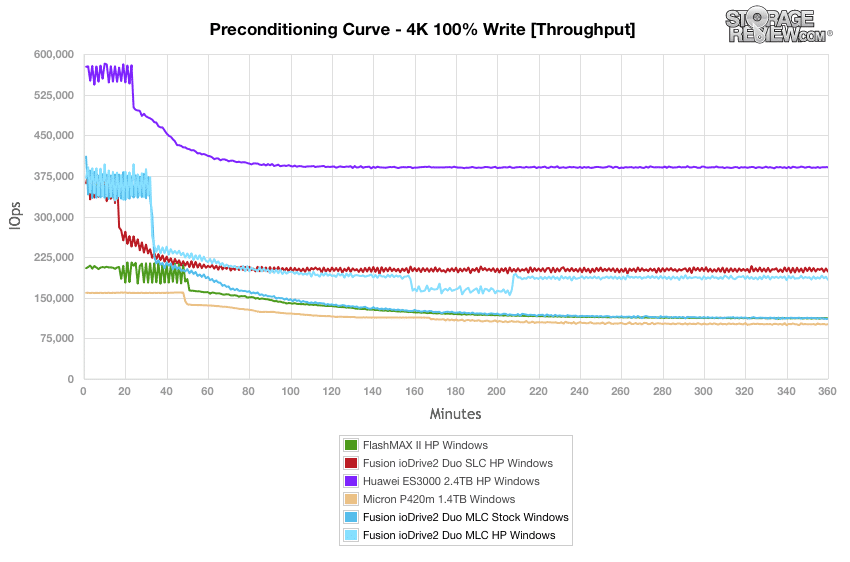
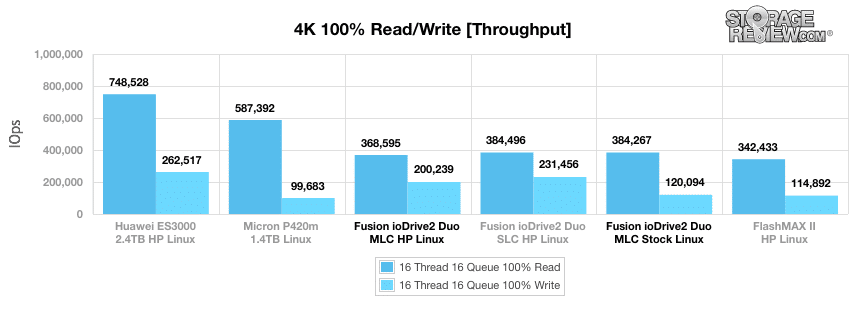
Our first test measures 100% 4k random write performance with a load of 16T/16Q. The Fusion-io ioDrive2 Duo MLC stock tested 530,000 and 350,000 IOPS for Linux and Windows, respectively (leveling off at around 120,000 and 115,000 IOPS, respectively). The bursting values for the ioDrive2 Duo MLC HP were similar to that of the ioDrive2 Duo MLC stock, but the values were higher after they had each leveled out (ioDrive2 Duo MLC HP leveled out at 200,000 and 185,000 on Linux and Windows, respectively). The ioDrive2 Duo MLC was in the middle of the pack overall; it was outperformed by the Huawei ES3000 HP during the entirety of the test (although the Huawei ES3000 HP performed very sporadically on Linux), and was outperformed during steady-state by the Fusion ioDrive2 Duo SLC HP. However, it outperformed both the Micron P420m and the FlashMAX II HP through the entirety of this test.
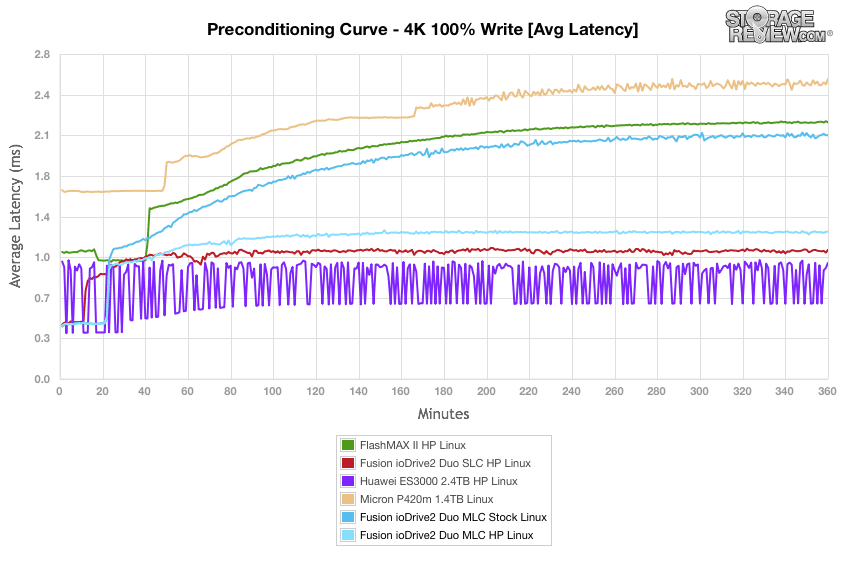
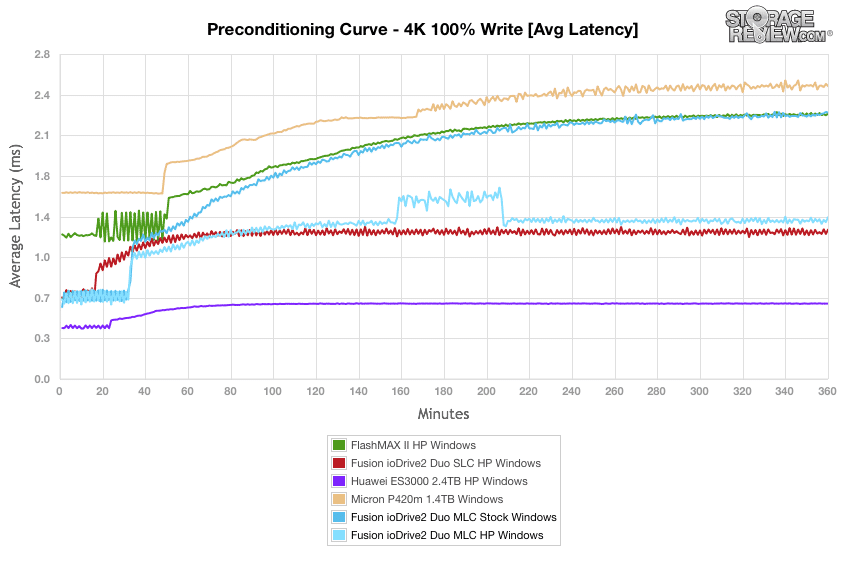
The average latency of the ioDrive2 Duo MLC was also average compared to the other drives tested, both during the burst rate and steady state; it performed faster than both the FlashMAX II HP and the Micron P420m, and was outperformed by the Huawei ES3000 HP and ioDrive2 Duo SLC HP (although the steady states of the ioDrive2 Duo MLC HP Linux and ioDRive2 Duo SLC Windows were comparable).
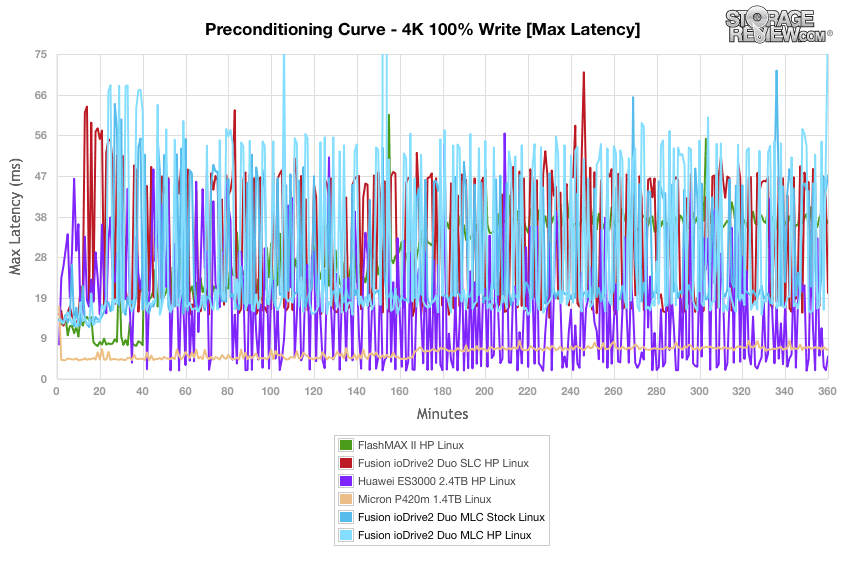
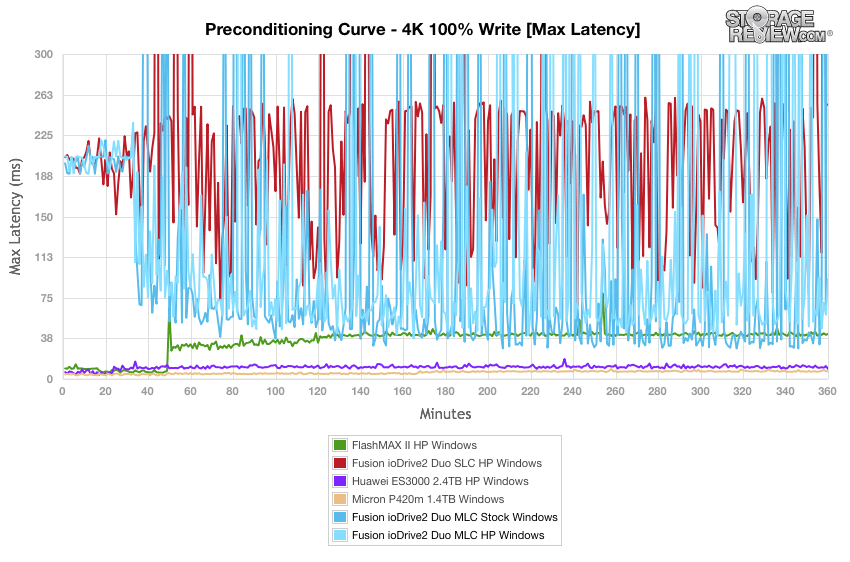
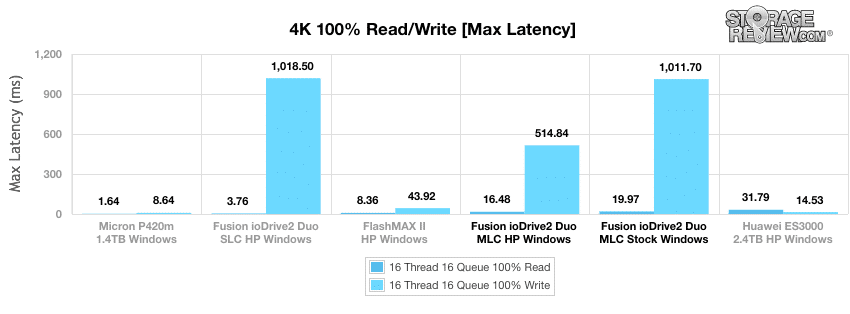
The max latency test showed that the ioDrive2 Duo MLC performed notably better with Linux than with Windows. Under its best conditions (HP Linux, 15ms), it performed in the top three with the Micron P420m (which consistently performed between 5 and 7ms) and the Huawei ES3000 (which, despite its sporadic performance, had spikes approaching 2ms).
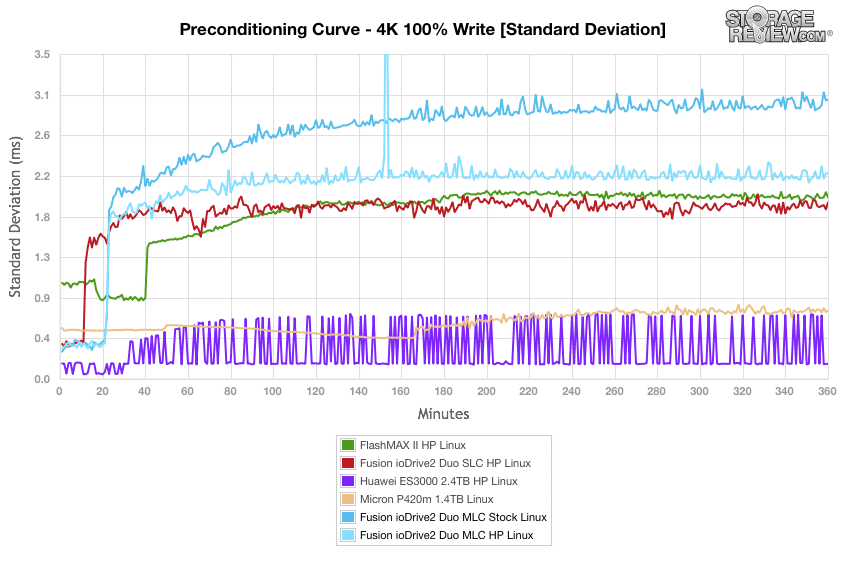
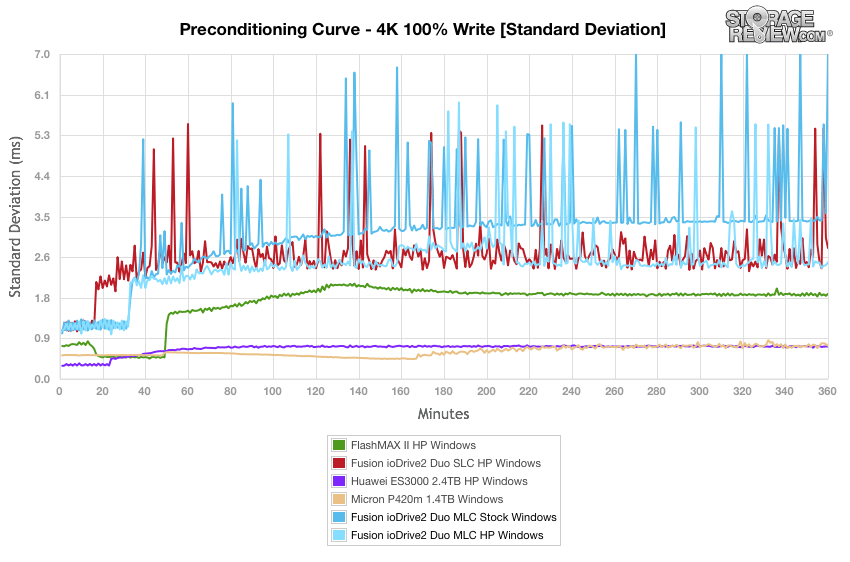
The ioDrive2 Duo MLC drives tested on Linux performed better and more consistently than those tested on Windows, exhibiting a lower standard deviation (2.1ms vs. 2.5ms, respectively for the HP drives, and 2.8ms vs. 3.2ms, respectively for the stock drives). The Huawei ES3000 HP and Micron P420m dominated the standard deviation test, with 0.5ms (Linux) and 0.7ms (Windows) for the former, and 0.7 (both Linux and Windows) for the latter.
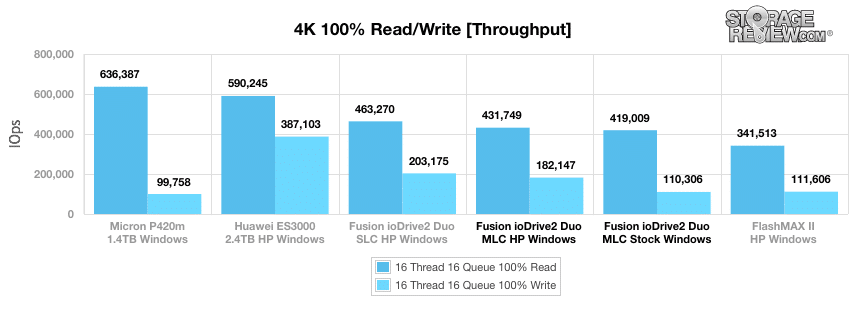
After 12 hours of preconditioning, the ioDrive2 Duo MLC HP and stock achieved 4K random read performances of 432,000 IOPS and 419,000 IOPS, respectively, in Windows (369,000 IOPS and 384,000 IOPS, respectively, in Linux). Write values were 182,000 IOPS (HP) and 110,000 IOPS (stock) in Windows and 200,000 IOPS (HP) and 120,000 IOPS (stock) in Linux. Read values for the ioDrive2 Duo MLC were surpassed by all but FlashMAX II HP and HP write values were generally average.
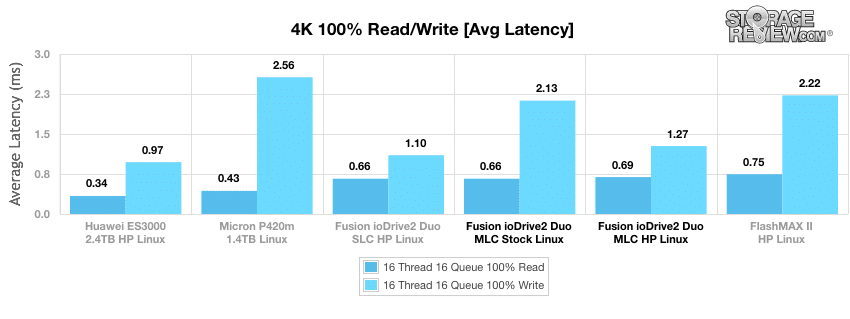
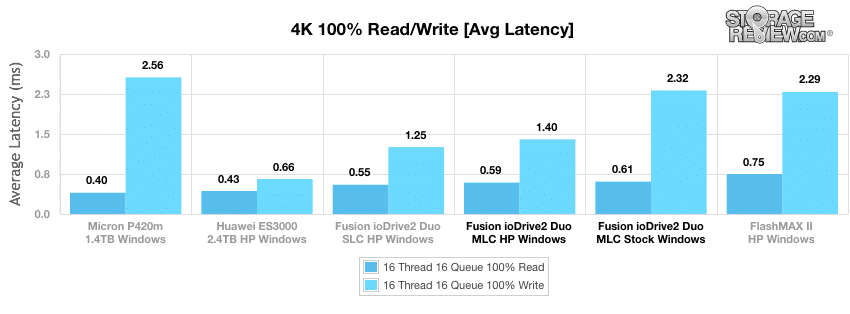
The Fusion-io ioDrive2 Duo MLC’s write values in both the stock and HP drives (2.127ms in Linux and 2.316ms in Windows and 1.274ms in Linux and 1.4ms in Windows, respectively) were only faster than the MicronP420m and FlashMAX II HP. The read values obtained from the ioDrive MLC drives were collectively outpaced by all but the FlashMAX II HP and the ioDrive2 Duo SLC HP (Linux only).
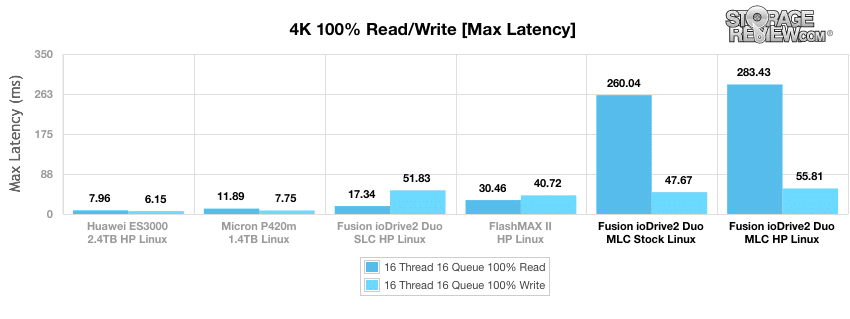
Read values were faster in Windows for both the stock and HP ioDrive2 Duo MLC drives (19.972ms and 16.479, respectively) but write values were faster for both in Linux (47.675ms and 55.809ms, respectively). These values were not very competitive compared to the other drives tested.
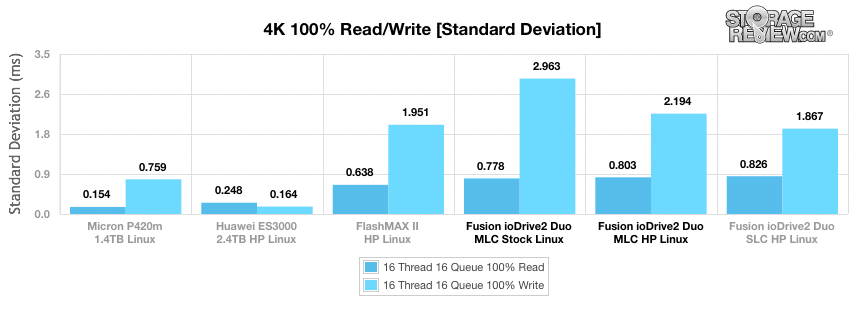
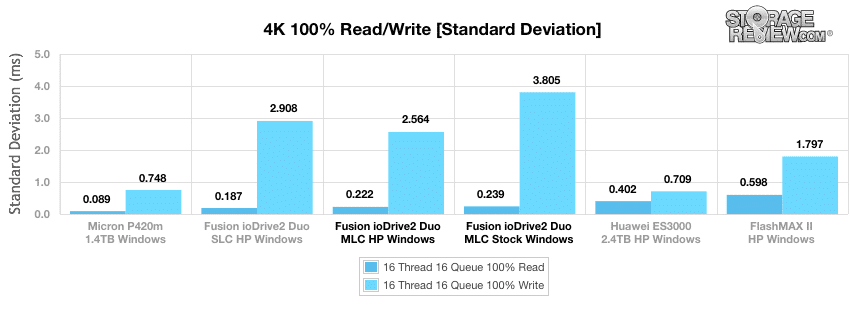
The consistency of the write performance was the worst for the ioDrive2 Duo MLC collectively compared to the other drives, the only exception being the ioDrive2 Duo SLC HP. The standard deviation of the read performance of the Windows tested ioDrive2 Duo MLC drives was more competitive (0.222ms for HP and 0.239ms for stock), but still roughly average. The read values for the Micron P420m (0.089 for Windows and 0.154 for Linux) were the most consistent in this test.
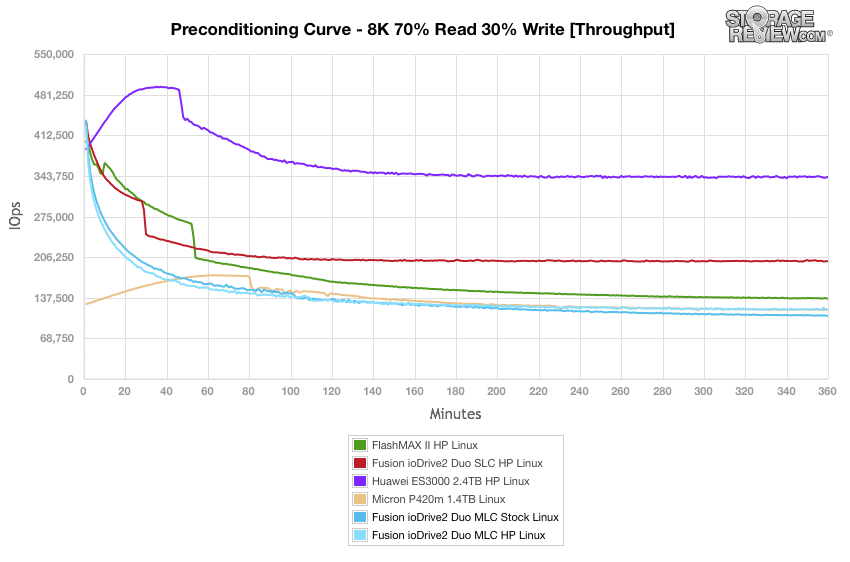
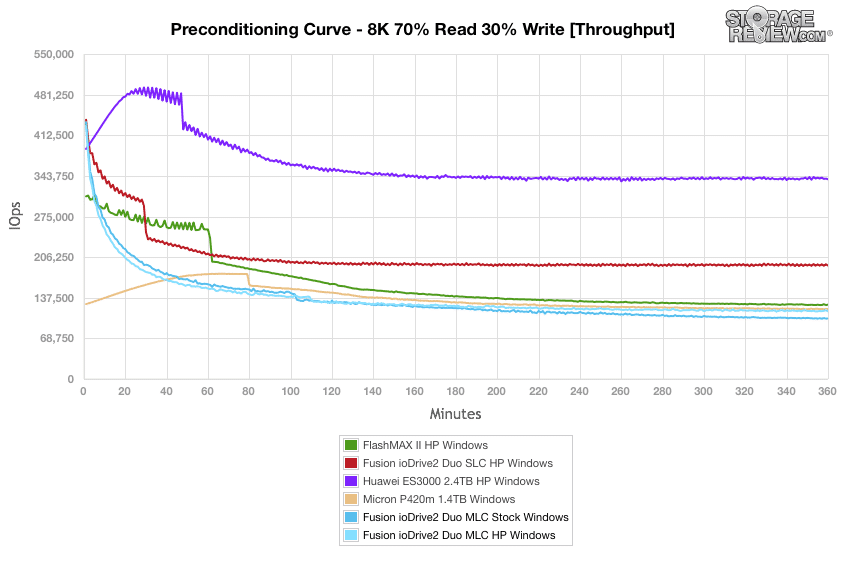
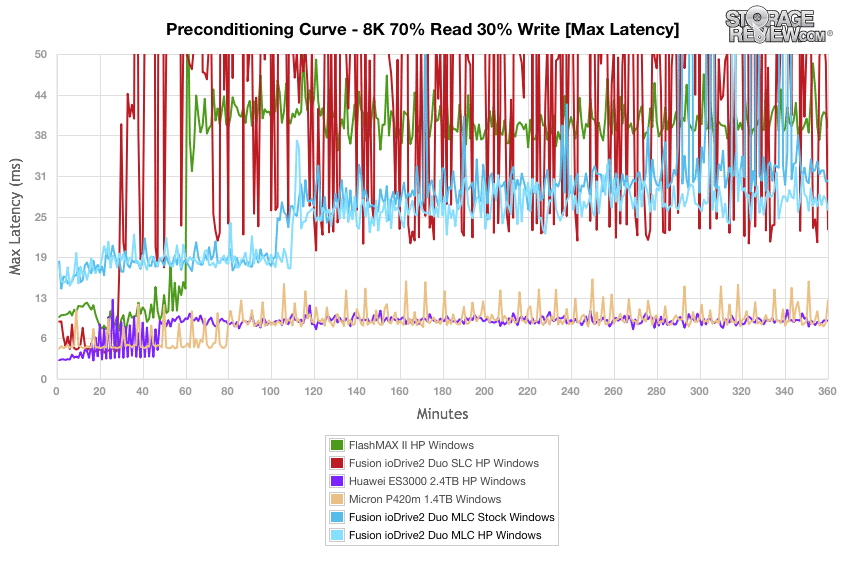
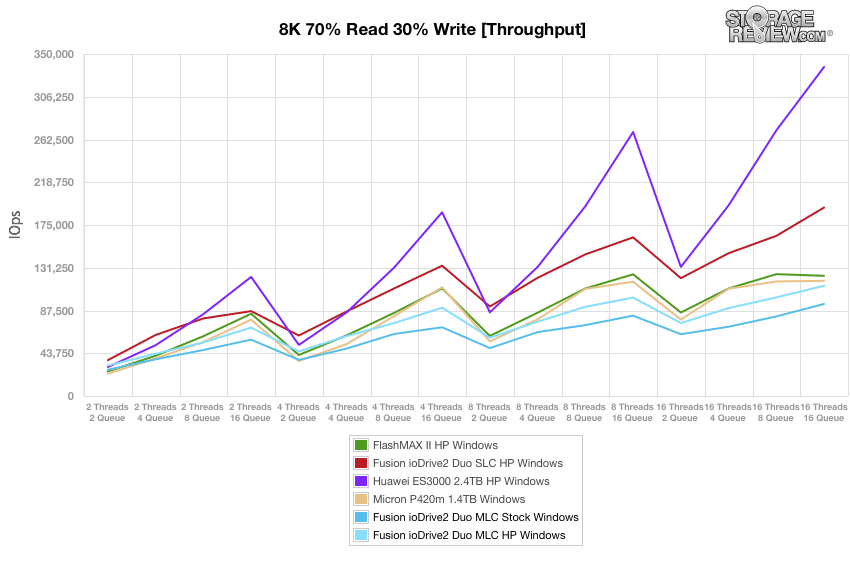
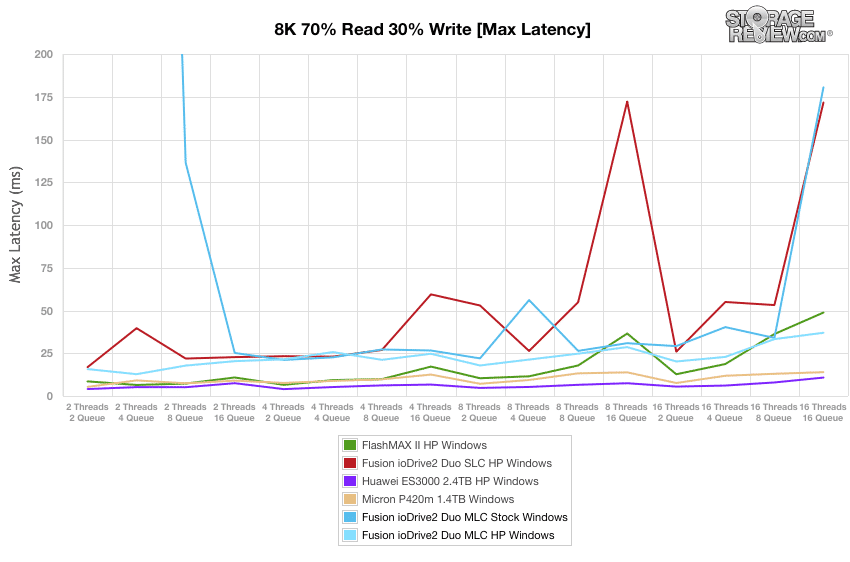
Our next test is an 8K 70/30-ratio workload in which the ioDrive2 Duo MLC collectively came in last place. During the burst rate the ioDrive2 Duo MLC stock drives outperformed the HP drives slightly, but the HP drives surpassed the stock drives once they had each leveled off. There was no difference in performance between Linux and Windows for this test.
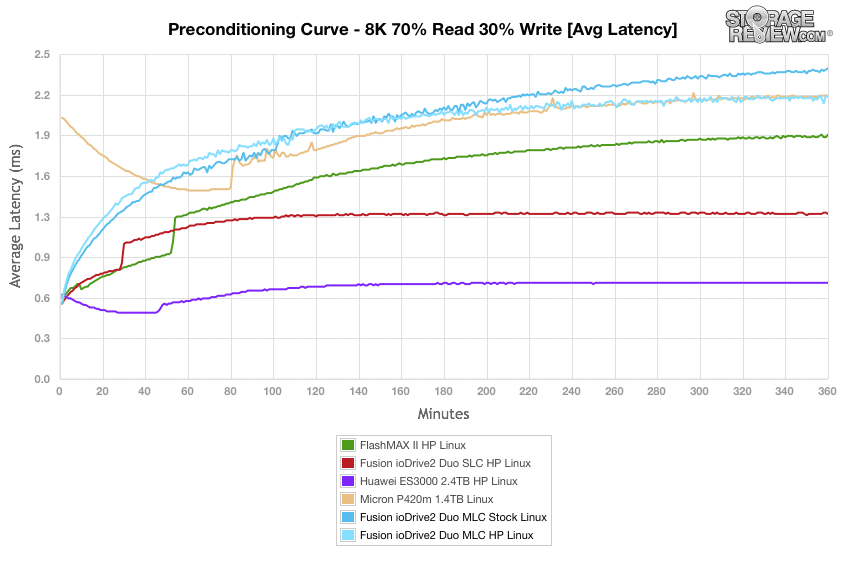
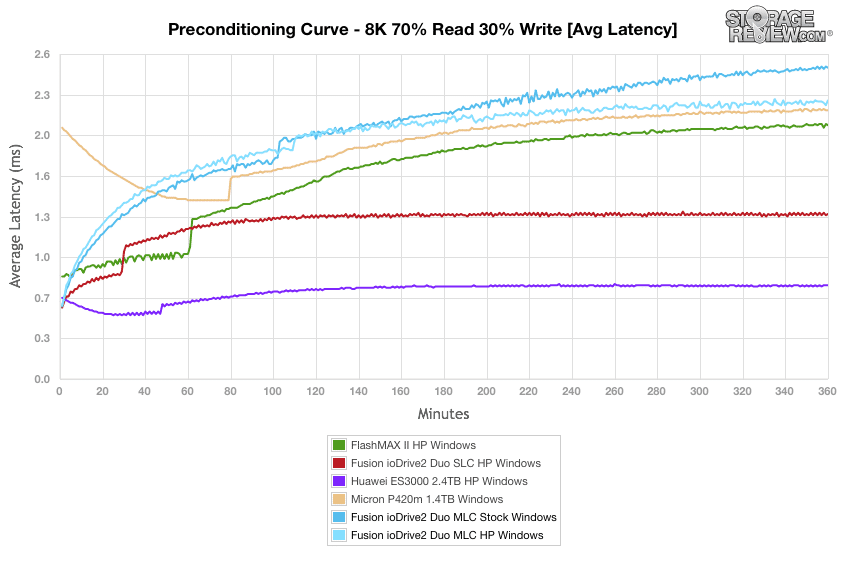
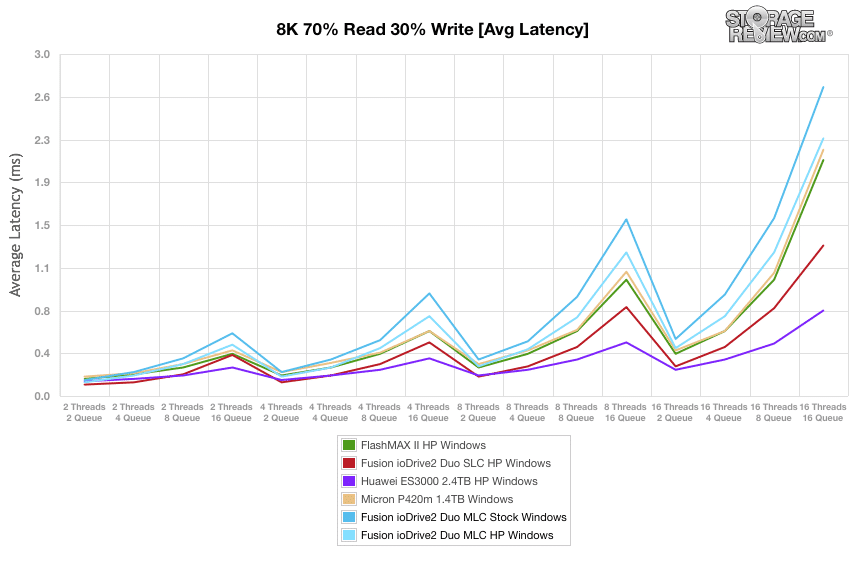
Like the last test, the ioDrive2 Duo MLC collectively was the slowest out of all of the drives tested. As the HP drives leveled out they maintained and average latency of 2.10ms and 2.20ms for Linux and Window, respectively. Stock drives did not completely level out during the duration of this test, continually slower straight through the end, giving an average latency of 2.35ms and 2.45ms for Linux and Windows, respectively.
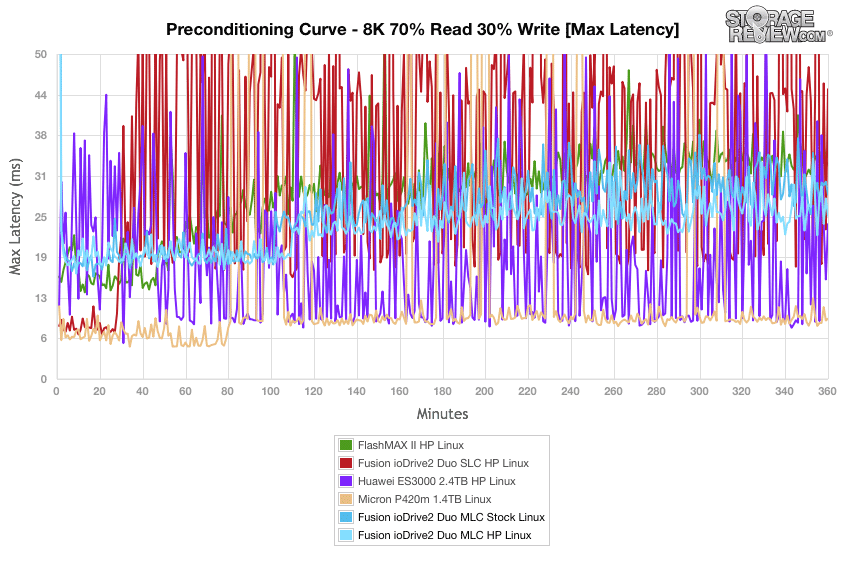
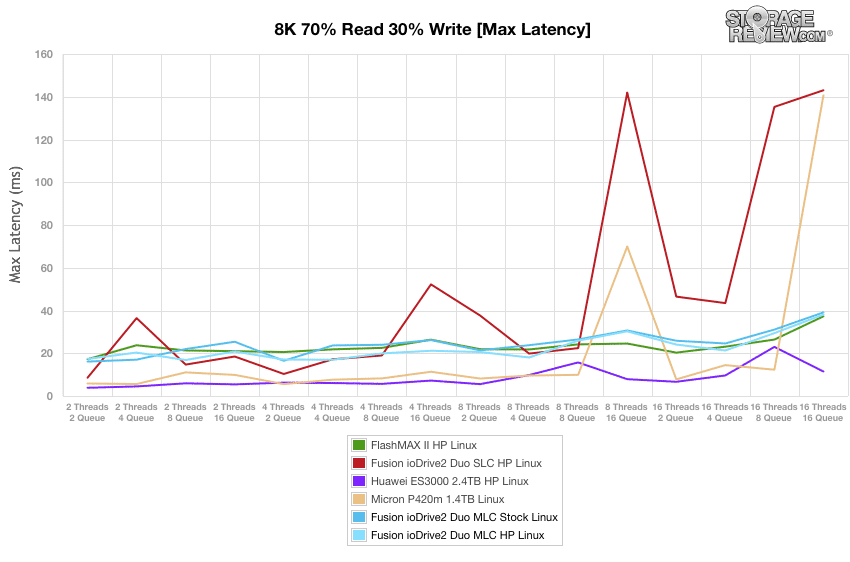
The ioDrive2 Duo MLC collectively performed well in the max latency test, scoring very consistently compared to the other drives tested, and showing very little change between burst and steady state rates. Although the Micron P420m and the Huawei ES3000 (both on Windows) dominated this test, most of the other drives showed either a very sporadic performance or a higher maximum latency.
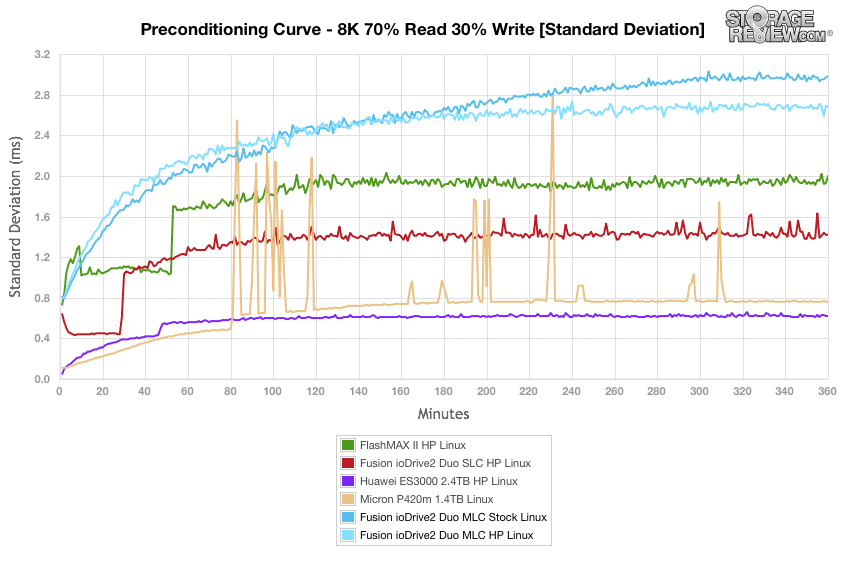
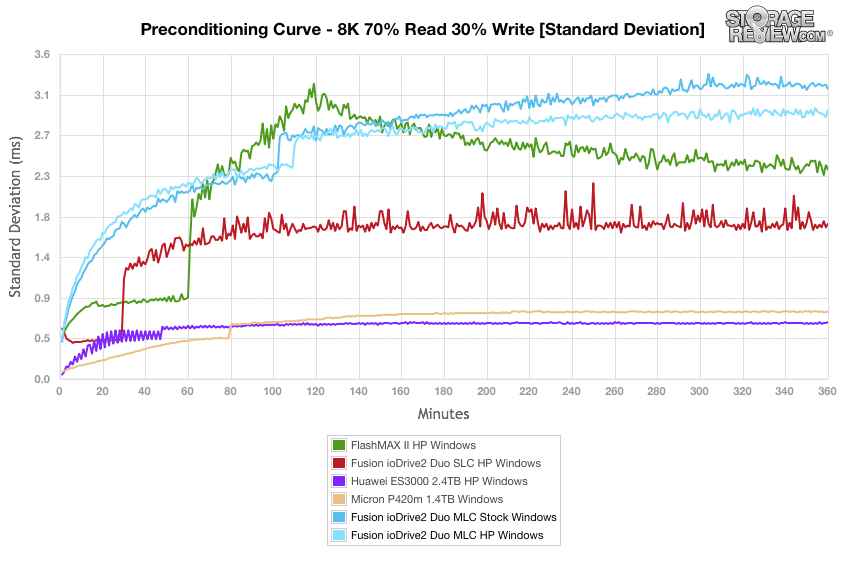
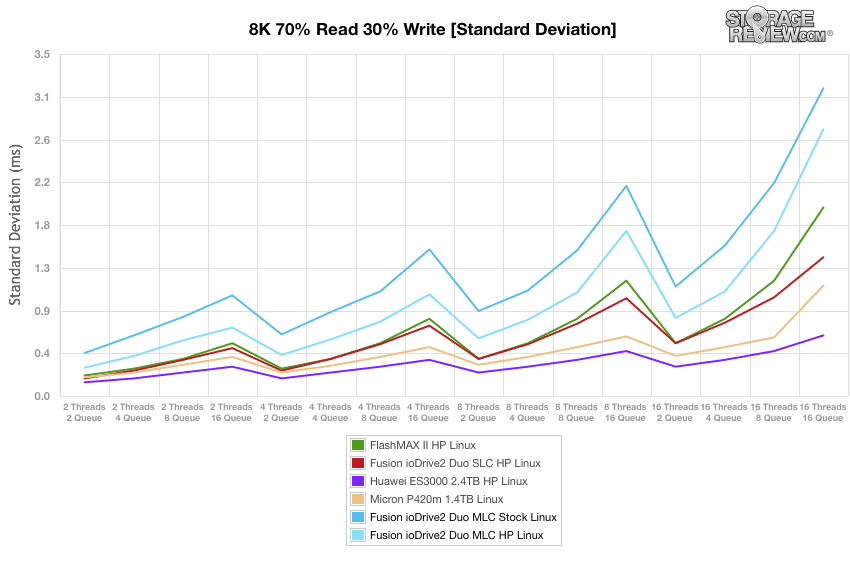
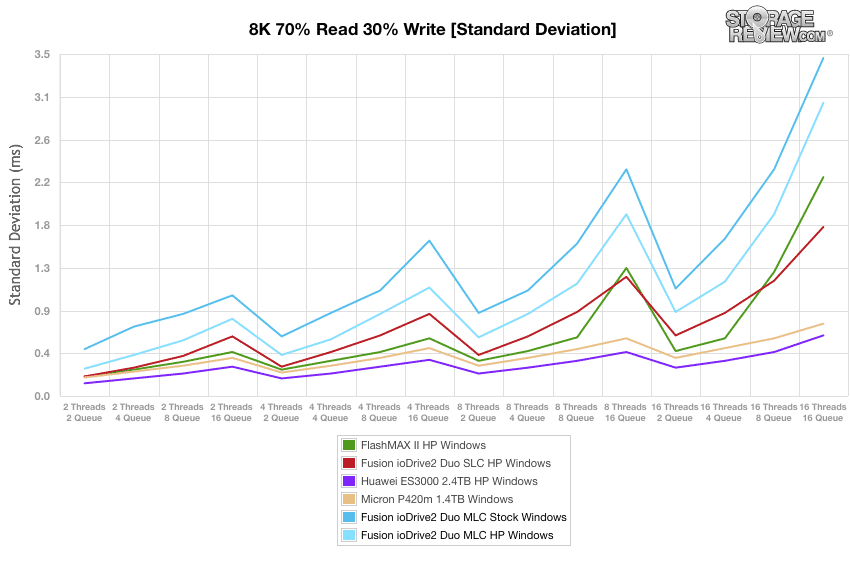
The ioDrive2 Duo MLC collectively exhibited the highest standard deviation as everything leveled out, achieving 2.7ms and 2.9ms in HP mode for Linux and Windows, respectively (although the FlashMAX HP on Windows showed one spike that exceeded the ioDrive2 Duo MLC drive’s numbers).
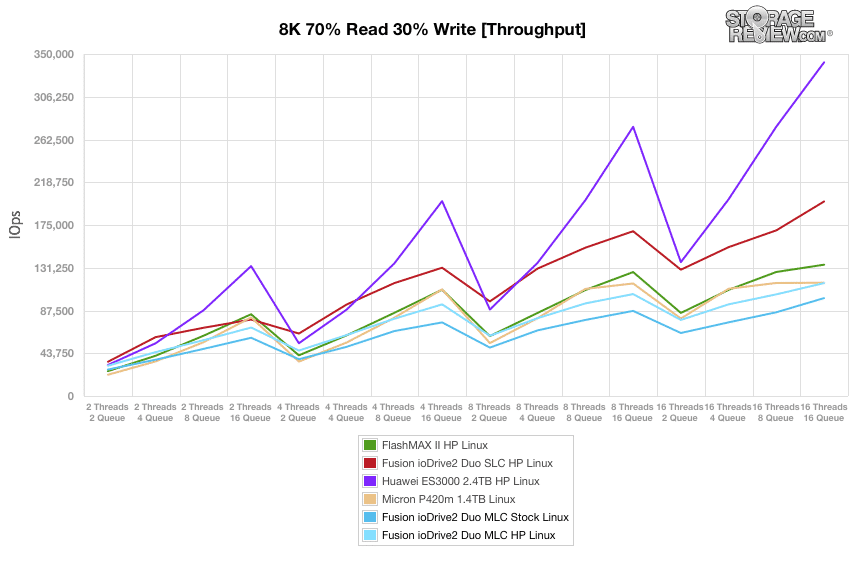
For this test, the ioDrive2 Duo MLC achieved peaks that passed some of the low points of the other drives; for the most part, all of the ioDrive2 Duo MLC drives performed relatively poorly, reaching peaks of 113,000 IOPS at its best (HP Linux) compared to that of the Huawei ES3000 HP, which lead the group with a consistency better performance and a peak of 340,000 IOPS. There was only a slight favoring of Linux for both the stock and HP ioDrive2 Duo MLC drives during this test.
The ioDrive2 Duo MLC drives collectively exhibited the slowest average latency compared to the other drives tested. Again, the Linux drives performed only slightly better than the Windows drives in both the stock and HP modes.
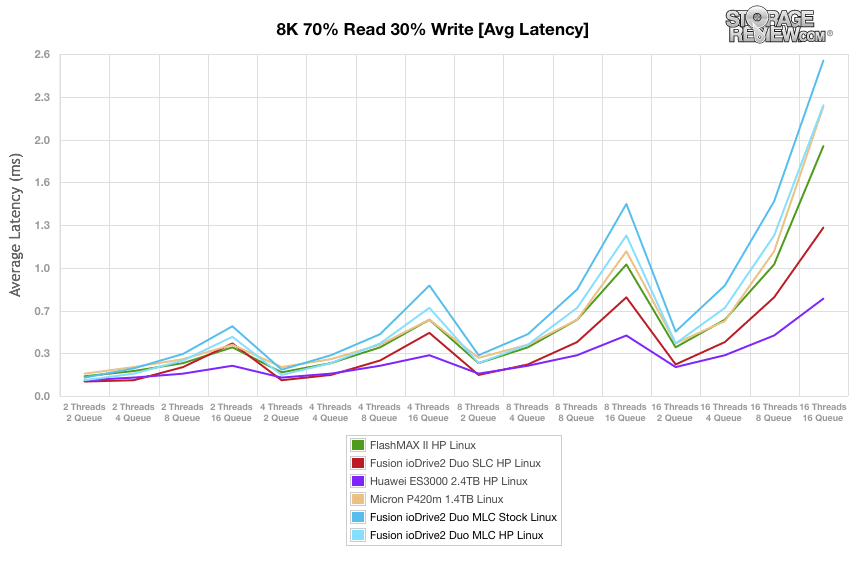
The ioDrive2 Duo MLC performed better than the ioDrive2 Duo SLC in this test, but that was about it; the other drives tested generally outpaced the ioDrive2 Duo MLC by about 10ms for the duration of the test. There was almost no difference overall in comparing the Linux and Windows-run drives for this test. HP drives scored around 23ms and stock drives scored around 27ms.
The ioDrive2 Duo MLC collectively was relatively the least consistent out of all of the drives tested. The HP drive showed a standard deviation of at least 0.2ms more than the closest competitor (the Fusion ioDrive2 Duo SLC), and 0.4ms-1.0ms more than the leading Huawei ES3000 drives. The stock drive stayed a consistent 0.3ms behind the HP drive, and Linux drives performed slightly better over the entire test for the ioDrive2 Duo MLC.
Conclusion
The Fusion-io ioDrive2 Duo MLC in 2.4TB provides the enterprise with a combination of performance and capacity for their most demanding applications. In our many reviews of ioMemory cards, we've come to expect quite a bit from Fusion-io and we're rarely let down. Like others before it, the MLC ioDrive2 Duo provides predictable performance across operating systems and leverages one of the best software packages for managing storage, which includes a simple tool to put the drive into high-performance mode for even more responsiveness.
Diving into real-world application performance, the ioDrive2 Duo MLC slotted in at or near the top in all of benchmarks. Its best performance was noted in our SQL Server benchmark where it offered a substantial latency lead over other PCIe Application Accelerators. In our MarkLogic NoSQL and Sysbench MySQL tests, the ioDrive2 Duo came in towards the top of the pack trailing just the Huawei ES3000 cards. Looking at pure synthetic performance the ioDrive2 Duo MLC ranked in the middle or upper middle of the pack with some max latency issues spotted in our Windows environment, although as we noted with our application testing, this wasn't reflected in real-world tests. Overall we were very impressed by the ioDrive2 Duo MLC, offering industry leading performance across both Linux and Windows testing environments.
Pros
- Excellent SQL Server performance
- Strong performance in NoSQL and MySQL database benchmarks
- Easy to over-provision for greater endurance or higher performance with write-workloads
- Industry leading management software
Cons
- Some max latency flutter in Windows environments
Bottom Line
The Fusion ioDrive 2 Duo MLC posted excellent database performance scores, highlighted by chart-topping latency in the SQL OLPC benchmark. For those who need a little more out of the card, it's easy to tweak over provisioning to get more endurance or performance for write-centric workloads.


 Amazon