

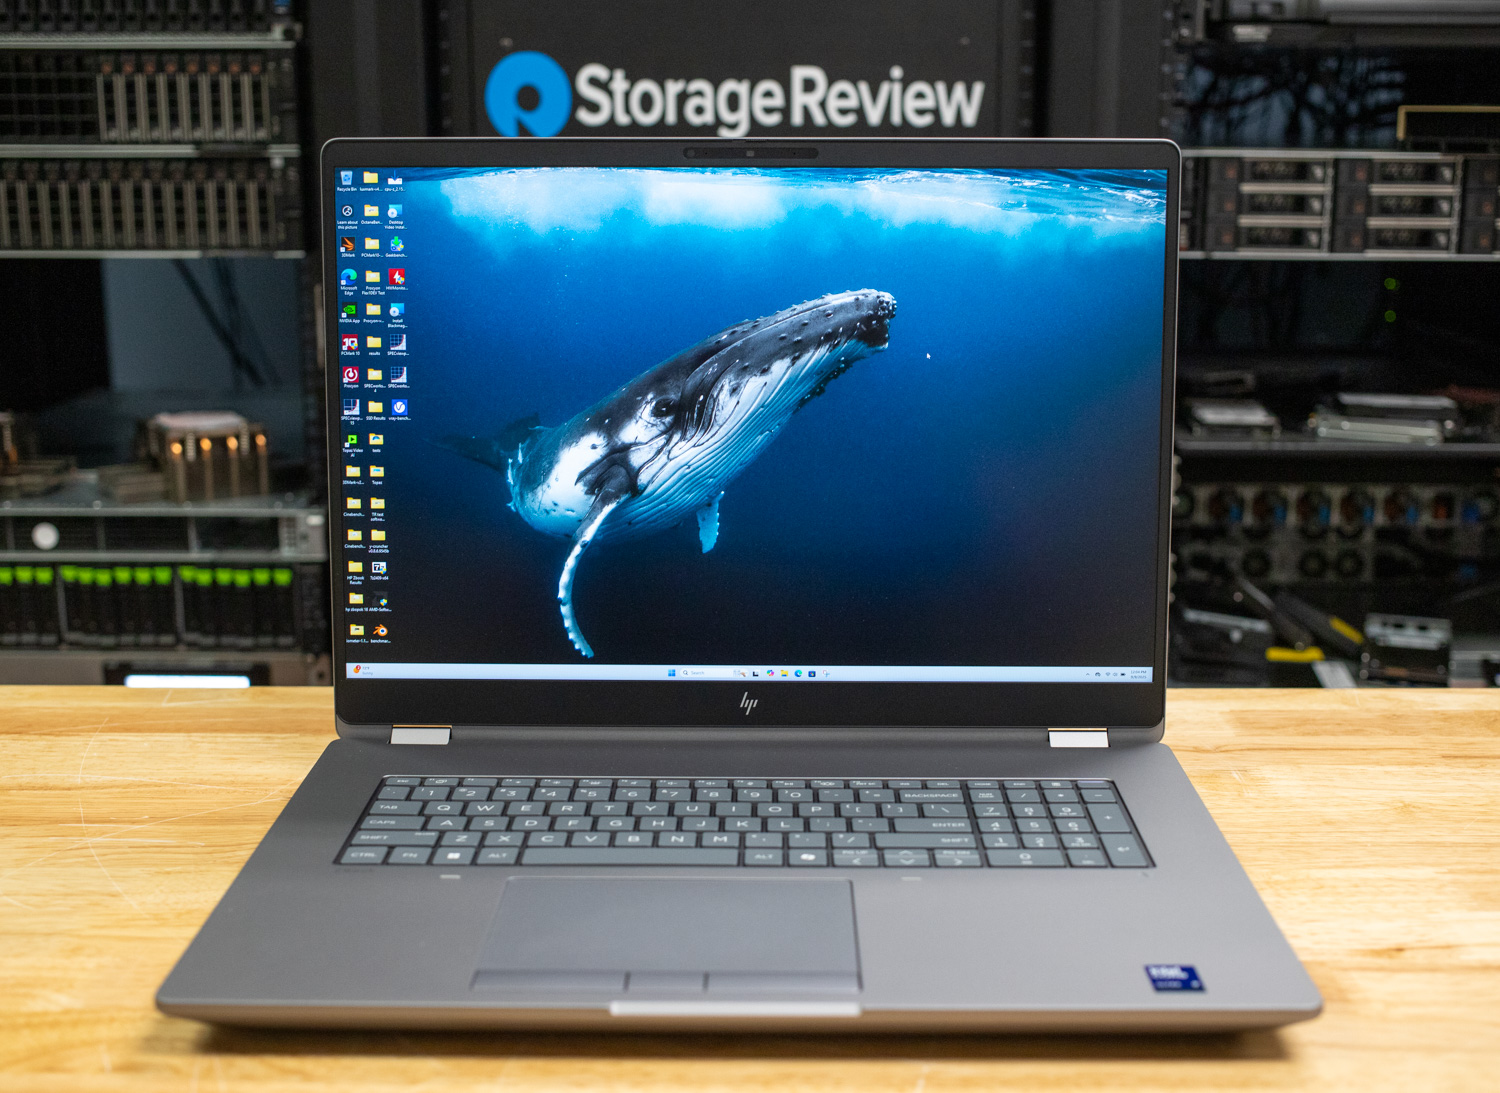
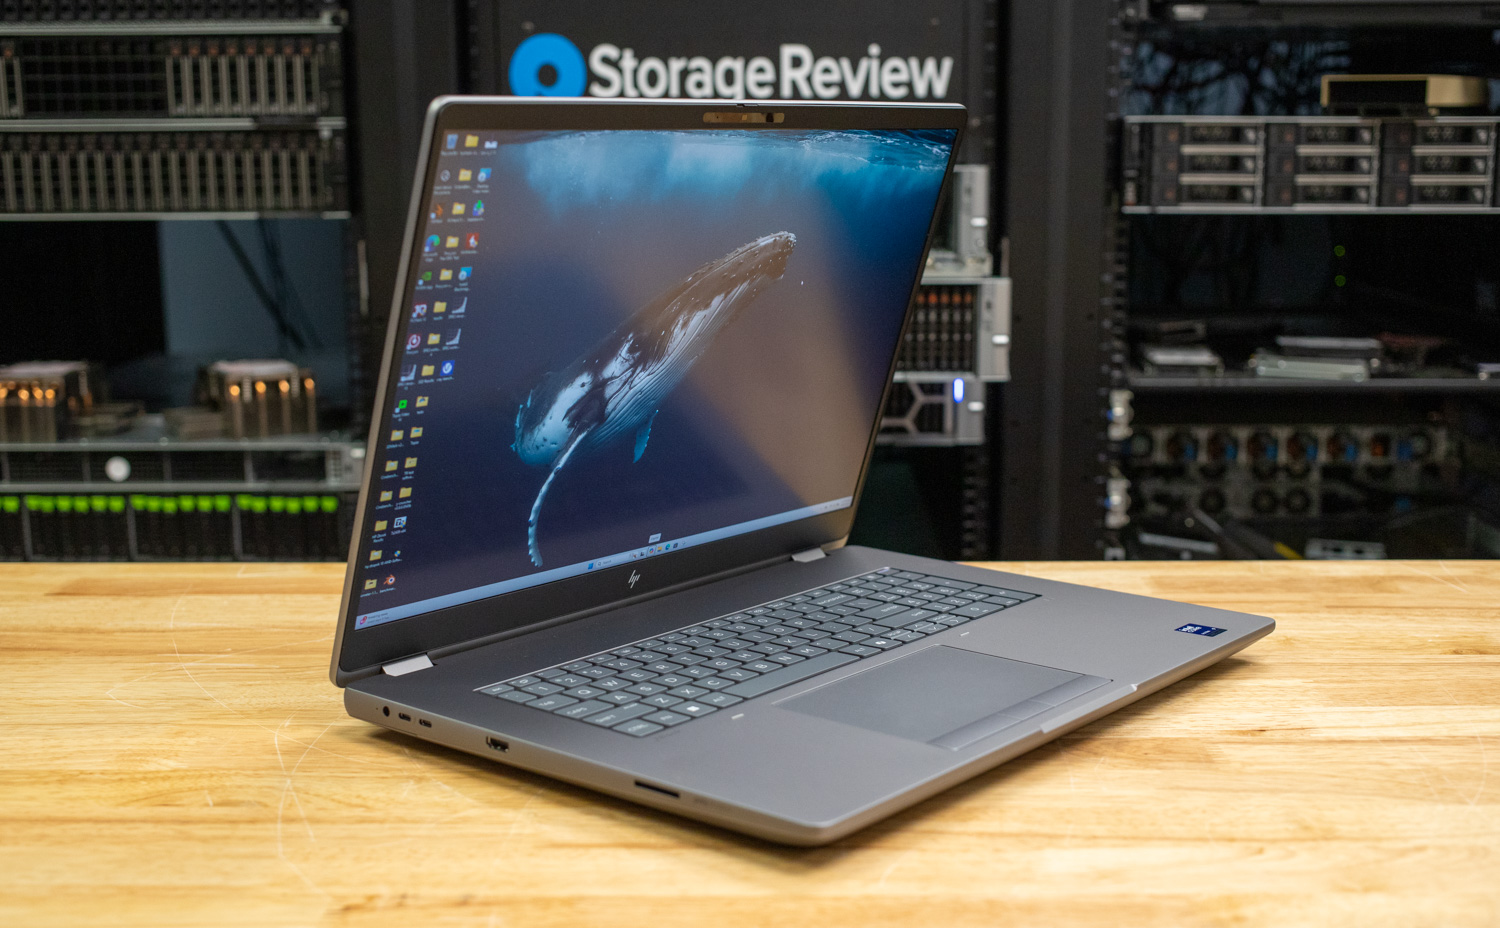
HP sent us one of its latest workstation notebooks designed for professionals who require uncompromising performance in a mobile form factor. The ZBook Fury G1i 18 features Intel’s Arrow Lake HX Core Ultra 9 285HX processor and NVIDIA’s Blackwell RTX Pro 5000 laptop GPU. It is designed for engineers, creators, and data scientists who use ISV-certified applications and require both reliability and expandability.
The starting MSRP is $3,499 on HP.com, while our fully configured review unit comes in at $11,687 with the RTX Pro 5000 (24GB GDDR7), Core Ultra 9 285HX, 64GB DDR5-5600 ECC memory, and a 2TB Gen5 SSD.
The 18-inch 2560×1600 165Hz DCI-P3 display, dual Thunderbolt 5 plus Thunderbolt 4 ports, HDMI 2.1, RJ-45, full-size SD, and 10Gbps USB-A round out the workstation-class connectivity. Inside, HP maintains a focus on serviceability with four SODIMM slots supporting up to 192GB of DDR5 memory and four M.2 bays, including Gen5 options. The 99Wh fast-charge battery and power adapters, with capacities up to 330W, ensure that this system is as capable in the field as it is in the lab or office.
HP ZBook Fury G1i 18 Specifications
The table below outlines the specifications and supported configurations of the HP ZBook Fury G1i 18.
| Category | Specifications |
|---|---|
| Available Operating Systems |
|
| Processor Family | Intel Core Ultra 9 processor; Intel Core Ultra 7 processor |
| Available Processors |
|
| Neural Processing Unit | Intel AI Boost |
| Chipset | Intel WM890 |
| Product Color | Meteor silver |
| Maximum Memory | 128 GB DDR5-5600 MT/s ECC; 192 GB DDR5-5600 MT/s non-ECC; Transfer rates up to 5600 MT/s |
| Memory Slots | 4 SODIMM; supports dual channel |
| Internal Storage |
|
| Display Size | 18″ / 45.7 cm (diagonal) |
| Available Displays | 18″ WQXGA (2560 x 1600), anti-glare, UWVA, LED, 500 nits, eDP 1.4 + PSR2, 165Hz, flat LCD, 100% DCI-P3 |
| Graphics |
|
| Audio | Audio by Poly Studio, 4 integrated stereo speakers, discrete amps, 2 dual-array digital mics |
| Memory Card Device | 1 smart card reader (select models) |
| Ports & Connectors |
|
| Keyboard & Mouse | HP Lumen RGB Z Keyboard (spill-resistant, backlit, quietKey, large 3-button trackpad); Clickpad with multi-touch gestures |
| Communications |
|
| Camera | IR Camera (optional); 5 MP camera |
| Software | HP MAC Address Manager, Copilot in Windows, HP Support Assistant, HP Smart Support, HP UEFI BIOS, Poly Camera Pro, Poly Lens, etc. |
| Security Management | HP Tamper Lock, HP Sure Click, HP Secure Erase, Windows Hello ESS, HP Sure Sense, HP BIOSphere, HP Sure Start, Absolute Persistence, HP Sure Run, HP Sure Recover, Secured-core PC, HP Sure Admin, DriveLock, etc. |
| Security Software Licenses | HP Wolf Pro Security Edition |
| Fingerprint Reader | Available (select models) |
| Management Features | HP Client Catalog, HP Power Manager, HP Client Management Script Library, HP Image Assistant, HP Manageability Integration Kit, HP Connect for Microsoft Endpoint Manager, HP Cloud Recovery, HP Driver Packs |
| Power | 200W Slim, 280W Standard, 330W Standard Smart AC Adapters |
| Battery | HP 99 Wh Long Life Polymer Fast Charge (8 cell); ~50% recharge in 30 minutes |
| Dimensions | 15.88 x 11.41 x 1.10 in; 40.3 x 28.9 x 2.7 cm |
| Weight | Starting at 7.78 lb (3.52 kg) |
| Ecolabels | EPEAT-registered configurations available |
| Sustainability | Low halogen; 40% post-consumer recycled plastic; bulk packaging; 90% efficient PSU; 100% sustainably sourced/recyclable packaging |
HP ZBook Fury G1i 18 Build and Design
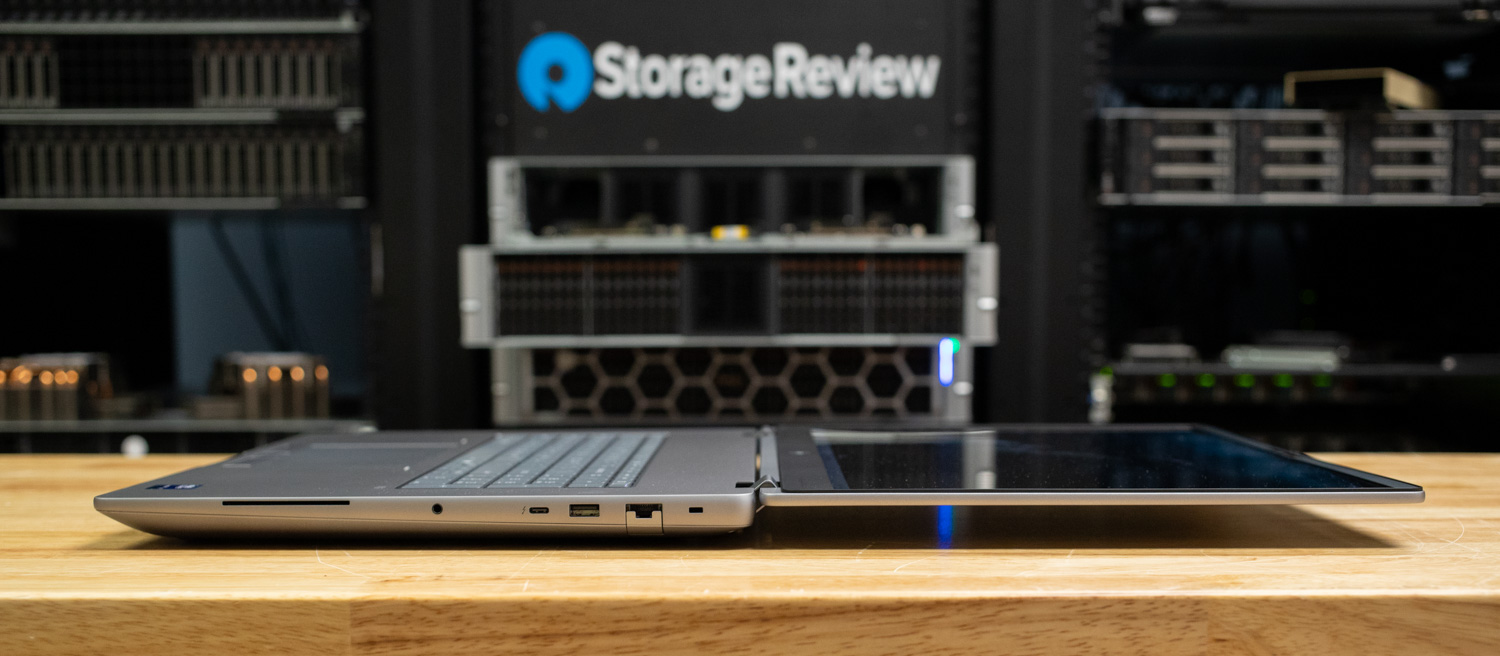
The HP ZBook Fury G1i 18 is engineered as a large-format mobile workstation, balancing premium materials with practical portability. The chassis is finished in Meteor Silver, giving it a professional, understated aesthetic. Despite its expansive 18-inch display, the HP ZBook Fury G1i 18 is designed as a large-format mobile workstation, striking a balance between premium materials and practical portability. The chassis is finished in Meteor Silver, giving it a professional, understated aesthetic. Despite its expansive display, which features an anti-glare coating and 100% DCI-P3 color accuracy, the system maintains a profile of just 1.10 inches thick.
Measuring 15.88 × 11.41 inches and weighing as little as 7.78 pounds, the ZBook G1i has the footprint of a true desktop replacement, while remaining portable enough for transport between office, lab, or field environments. Power options scale up to 200 W Slim, 280 W Standard, or 330 W AC barrel charger, depending on configuration, with our review unit shipping with the 280 W brick. The HP 99 Wh Long Life Polymer battery supports Fast Charge technology, reaching roughly 50% capacity in just 30 minutes, ensuring users can stay productive on the go without extended downtime.
Front
The HP ZBook Fury G1i ships with an HP Lumen RGB Z keyboard, a full-sized mobile keyboard that’s spill-resistant, backlit, and built with quietKey switches for comfortable typing in professional or creative workflows.
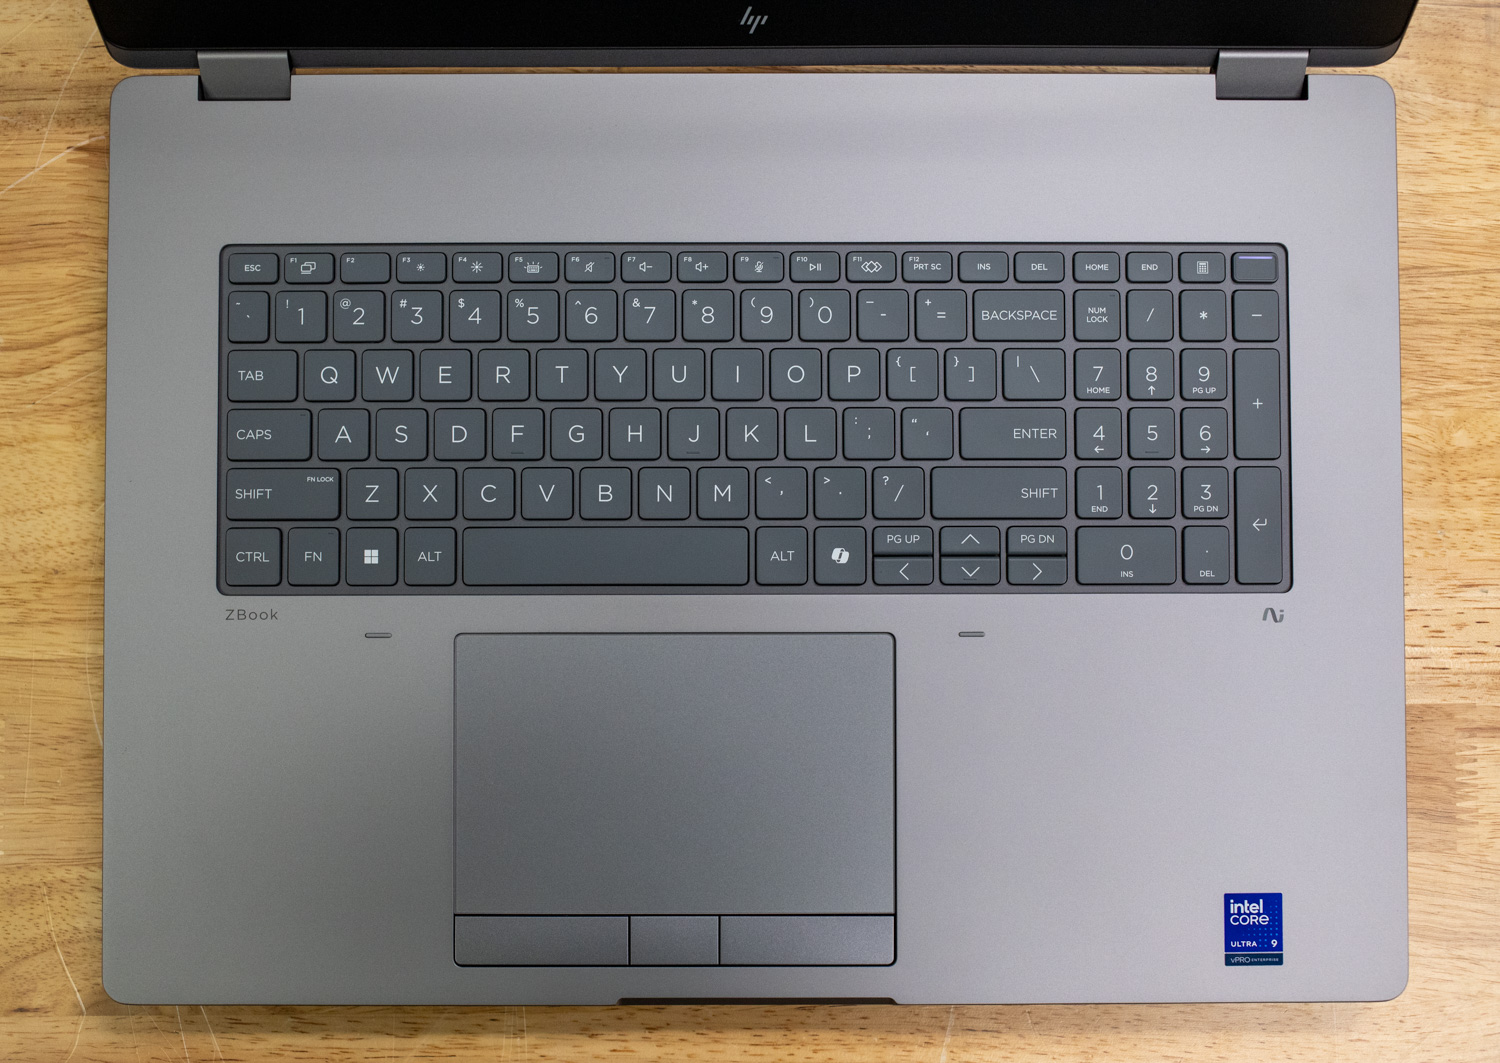
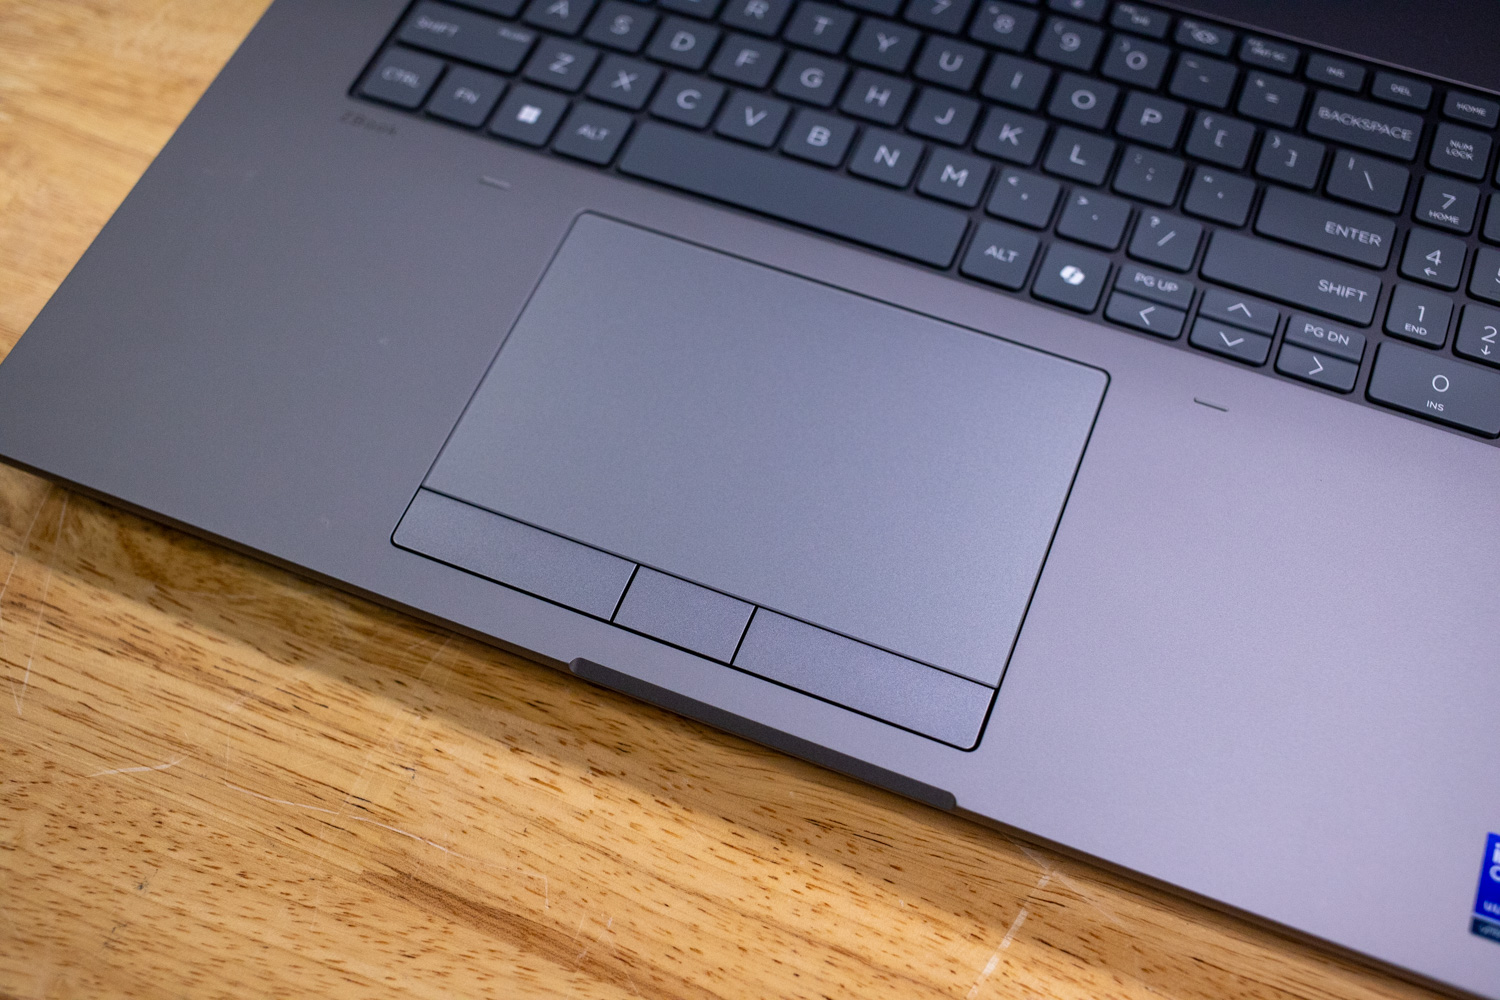
The system also includes a large three-button trackpad with multi-touch gesture support, designed to handle precise navigation and productivity tasks.
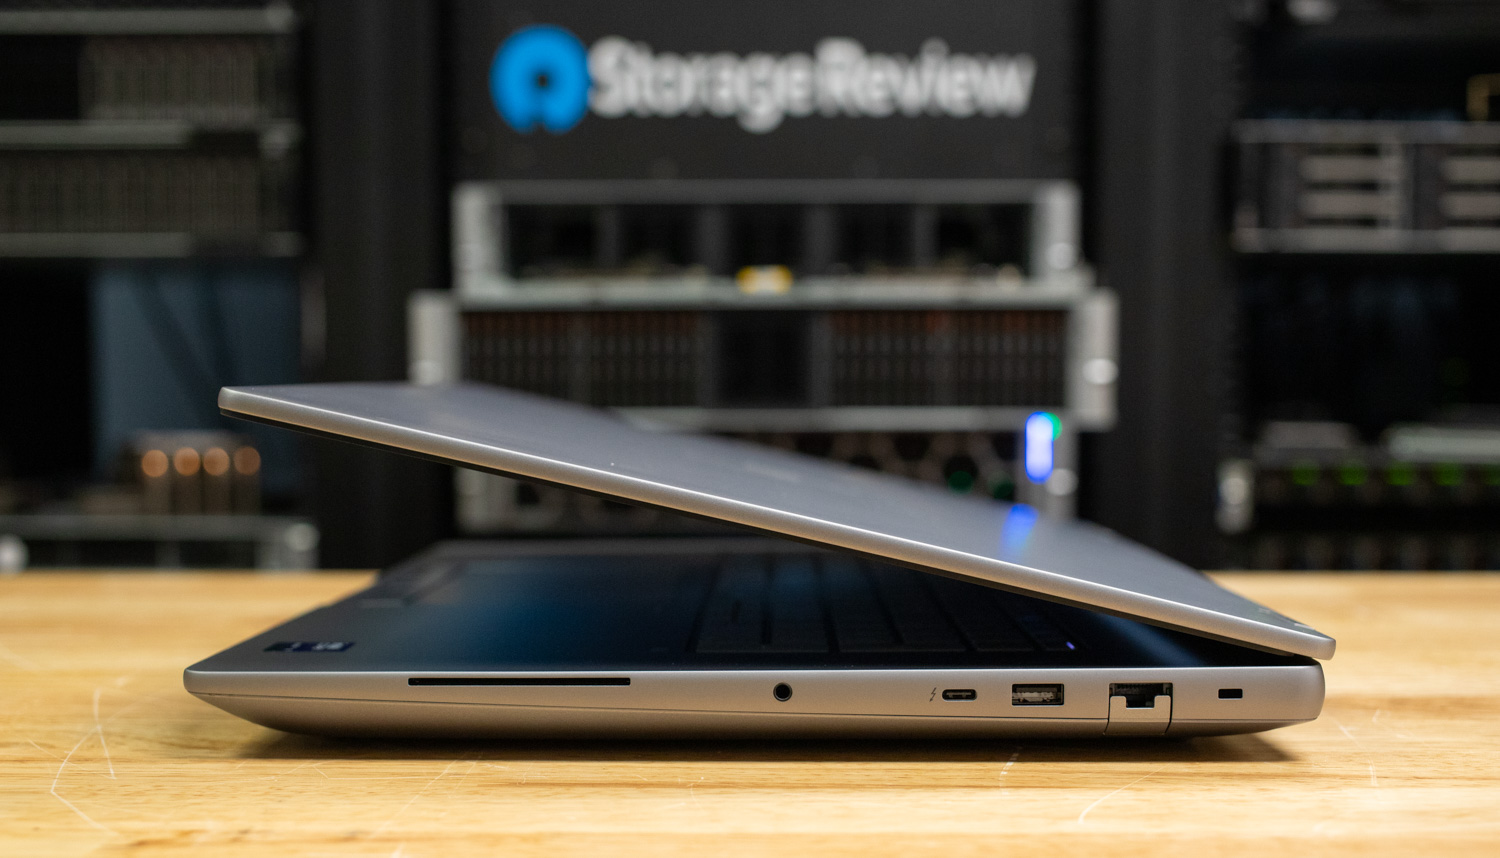
Left
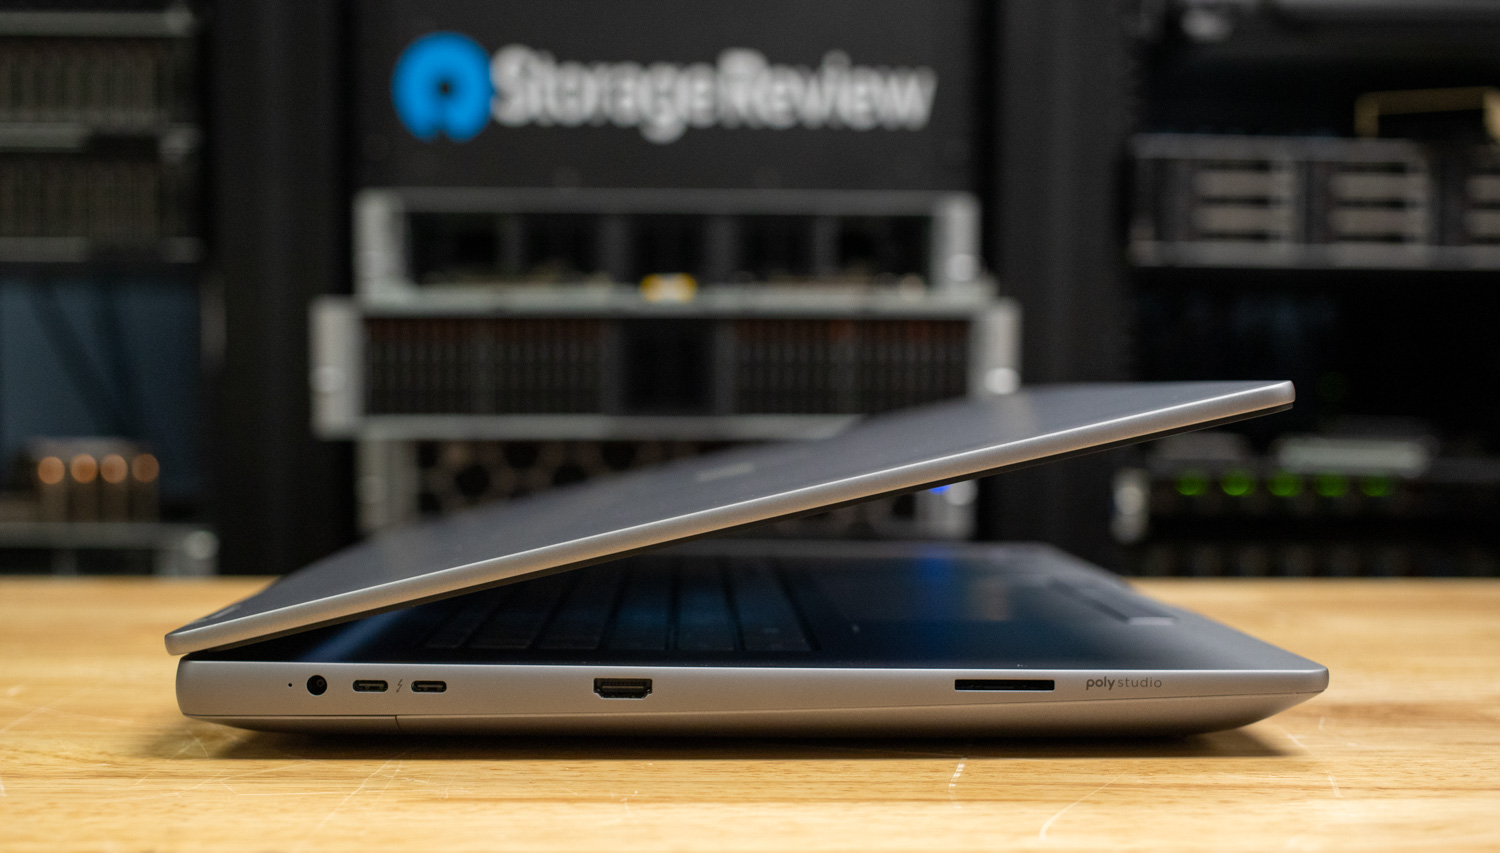
Left-side connectivity includes the DC charging port, one HDMI 2.1, a full-size SD card reader, and two Thunderbolt 5 (USB-C) ports supporting up to 80 Gbps bandwidth, power delivery, and DisplayPort 2.1 output.
Right
Right-side connectivity includes one USB-A (10 Gbps), a 3.5 mm audio combo jack, an RJ-45 Ethernet port, and one Thunderbolt 4 (USB-C) port supporting up to 40 Gbps bandwidth, power delivery, and DisplayPort 2.1 output.
Bottom
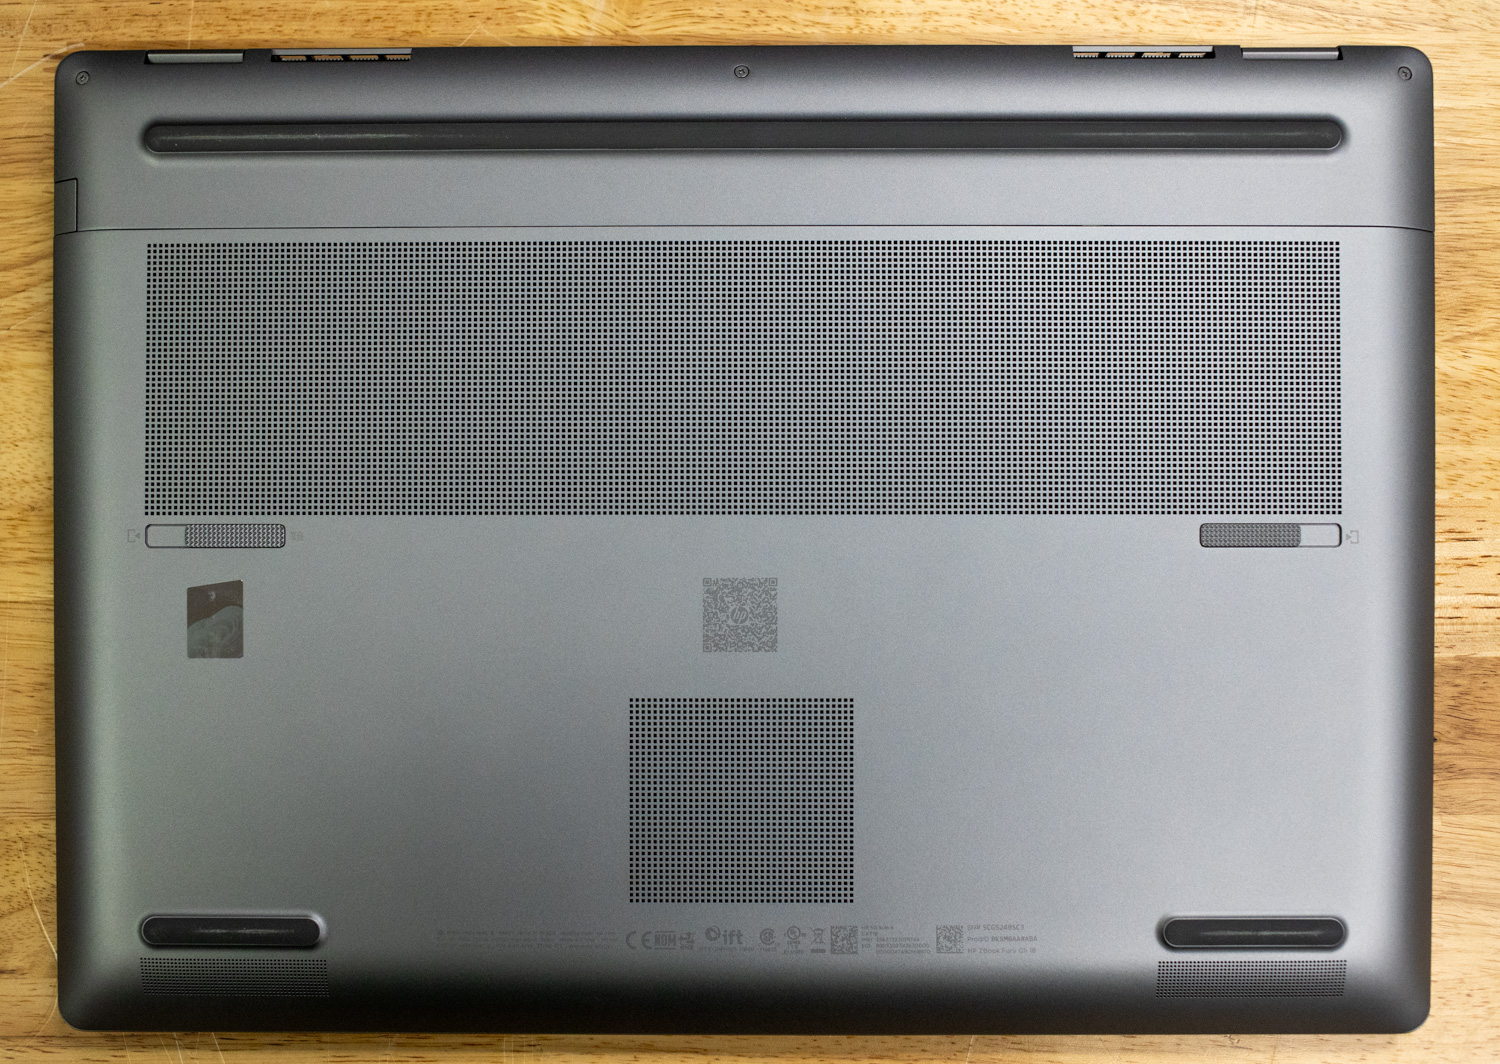
The bottom cover of the HP ZBook Fury G1i 18 features extensive venting to provide adequate airflow and cooling for the internal components. Along the left and right edges are two tool-less latches that allow the cover to be removed easily, giving direct access to key serviceable components such as the SSDs, battery, and memory modules. This design makes field upgrades and maintenance straightforward while ensuring the workstation remains properly cooled during heavy workloads.
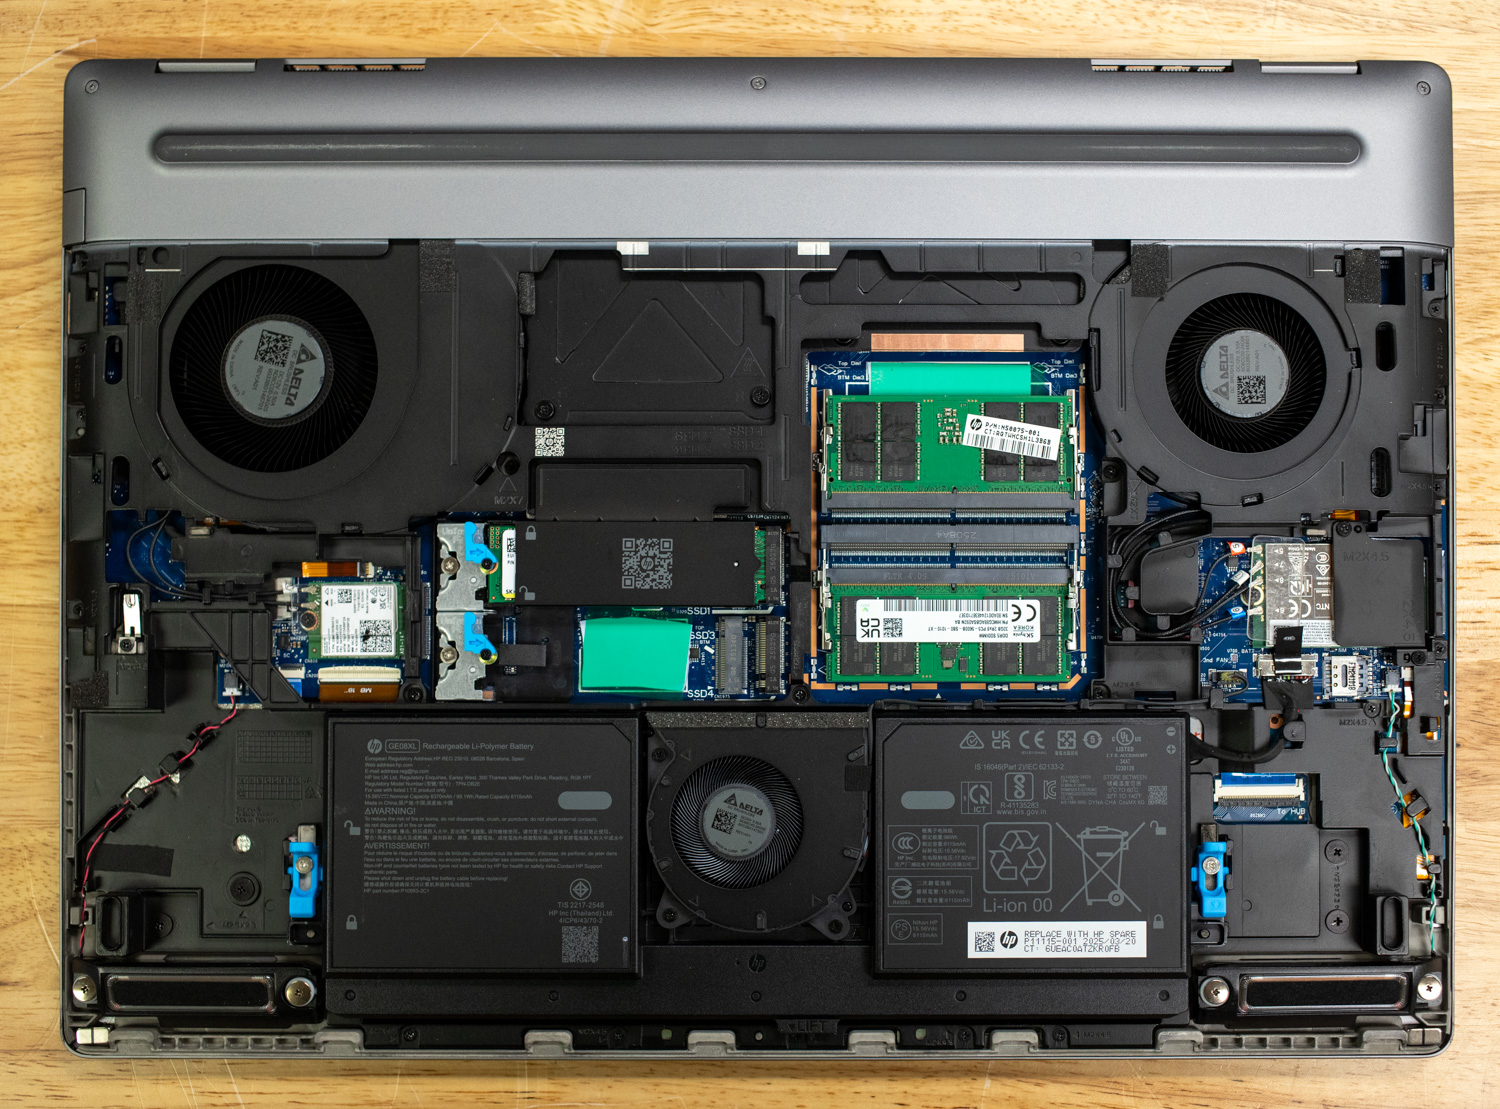
Removing the bottom cover of the HP ZBook Fury G1i 18 reveals a densely packed layout optimized for both performance and serviceability. Cooling is handled by two large fans dedicated to the CPU and GPU, while a third smaller fan provides supplemental airflow across critical components such as storage and memory.
Storage expansion is robust, with four M.2 slots arranged in a double-stacked layout. The top two slots feature a convenient lever-based locking mechanism, allowing drives to be secured or removed without tools by simply turning the latch between locked and unlocked positions.
For memory, the system includes four SODIMM slots supporting dual-channel operation. Configurations scale up to 128 GB of DDR5-5600 ECC or 192 GB of DDR5-5600 non-ECC, providing flexibility for workstation-class workloads that demand high capacity and reliability.
For wireless networking, the ZBook Fury G1i 18 comes equipped with Intel Wi-Fi 7 BE200 (2×2) and Bluetooth 5.4, available in both vPro and non-vPro configurations. Mobile professionals can also opt for built-in WWAN support, with choices between the Qualcomm® 9205 LTE Cat-M1 and the HP Kavalan R15 5G modem for always-on connectivity.
Audio is handled by Poly Studio, featuring four integrated stereo speakers with discrete amplifiers, tuned to deliver clear voice reproduction and rich media playback for both professional calls and entertainment.
HP ZBook Fury G1i Performance Testing
Before we begin with the benchmarks, it is essential to note that the HP ZBook Fury G1i 18 and the Dell Pro Max 18 Plus are equipped with the same core components, each featuring the Intel Core Ultra 9 285HX processor paired with the NVIDIA RTX PRO 5000 GPU. This ensures that the comparison remains focused on platform-level performance rather than hardware differences in compute or graphics. The only areas where the two systems diverge are in memory and storage, with variations in installed RAM capacity and drive size that do not affect the overall comparability of CPU and GPU results
While the CPU and GPU baselines are aligned, the memory and power envelopes reveal subtle but interesting differences in how each vendor approaches platform tuning. HP configures its RTX PRO 5000 at a maximum TDP of 150 W, with a graphics clock of 1740 MHz. In contrast, Dell allows the GPU to operate at a higher TDP of 175 W, accompanied by a boost to 1807 MHz. On the memory front, HP stays with more traditional SODIMM 5600 MT/s modules clocked at 4400 MT/s, whereas Dell leverages its CAMM2 implementation at 6400 MT/s. These decisions don’t make one system inherently “better” than the other, but they highlight the diverging design philosophies.
System Configuration
- CPU: Intel Core Ultra 9 285HX (16 Cores, 24 Threads, 5.5 GHz Turbo, 55W)
- Memory: 64GB DDR5-5600 MT/s ECC
- GPU: NVIDIA RTX PRO 5000 Blackwell with 24GB GDDR7
- Storage: 1X 2TB Gen5 SSD
Procyon AI Computer Vision
The Procyon AI Computer Vision Benchmark measures AI inference performance across CPUs, GPUs, and dedicated accelerators using a range of state-of-the-art neural networks. It evaluates tasks such as image classification, object detection, segmentation, and super resolution with models including MobileNet V3, Inception V4, YOLO V3, DeepLab V3, Real ESRGAN, and ResNet 50. Tests are run on multiple inference engines, including NVIDIA TensorRT, Intel OpenVINO, Qualcomm SNPE, Microsoft Windows ML, and Apple Core ML, providing a broad view of hardware and software efficiency. Results are reported for both float and integer-optimized models, offering a consistent and practical measure of machine vision performance for professional workloads.
On the CPU, the HP ZBook Fury G1i achieved an overall score of 185, compared to 195 on the Dell Pro Max 18 Plus, resulting in a 5.4% difference in favor of Dell. Looking at the individual models, HP ran MobileNet V3 slightly quicker (0.94 ms vs. 1.00 ms, 6% faster), but Dell maintained small advantages across the heavier networks: ResNet 50 (6.98 ms vs. 7.46 ms, 6.9% faster), Inception V4 (19.53 ms vs. 20.47 ms, 4.8% faster), DeepLab V3 (24.15 ms vs. 25.74 ms, 6.6% faster), and YOLO V3 (44.53 ms vs. 45.50 ms, 2.1% faster). The biggest spread came in REAL-ESRGAN, where Dell completed the workload in 1,934.18 ms compared to HP’s 2,281.80 ms, a 15% lead.
With integrated Intel ARC graphics, the HP ZBook Fury G1i posted an overall score of 116, compared to Dell’s 156, a difference of 34% in Dell’s favor. Dell consistently processed the test models faster, including ResNet 50 (8.86 ms vs. 13.00 ms, 32% faster), Inception V4 (22.71 ms vs. 30.54 ms, 34% faster), DeepLab V3 (37.80 ms vs. 42.53 ms, 11% faster), and YOLO V3 (54.03 ms vs. 127.34 ms, 136% advantage). Both systems were closer in MobileNet V3 (1.35 ms vs. 1.45 ms, 7% faster for Dell) and REAL-ESRGAN (1,878.42 ms vs. 1,980.22 ms, 5% faster for Dell).
| CPU Results (Average Time in ms) | Dell Pro Max 18 Plus (Intel Core Ultra 9 285HX)(NVIDIA RTX PRO 5000) | HP ZBook Fury G1i (Intel Core Ultra 9 285HX)(NVIDIA RTX PRO 5000) |
| AI Computer Vision Overall Score | 195 | 185 |
| MobileNet V3 | 1.00 ms | 0.94 ms |
| ResNet 50 | 6.98 ms | 7.46 ms |
| Inception V4 | 19.53 ms | 20.47 ms |
| DeepLab V3 | 24.15 ms | 25.74 ms |
| YOLO V3 | 44.53 ms | 45.50 ms |
| REAL-ESRGAN | 1,934.18 ms | 2,281.80 ms |
| CPU Integrated Graphics Results (Average Time in ms) | ||
| AI Computer Vision Overall Score | 156 | 116 |
| MobileNet V3 | 1.35 ms | 1.45 ms |
| ResNet 50 | 8.86 ms | 13.00 ms |
| Inception V4 | 22.71 ms | 30.54 ms |
| DeepLab V3 | 37.80 ms | 42.53 ms |
| YOLO V3 | 54.03 ms | 127.34 ms |
| REAL-ESRGAN | 1,878.42 ms | 1,980.22 ms |
When looking at both machines testing the NVIDIA RTX Pro 5000 discrete GPU, the HP ZBook Fury G1i scored 890 in the AI Computer Vision overall benchmark, compared to 1,032 on the Dell Pro Max 18 Plus, giving Dell a 16% advantage.
On individual workloads, the systems were close in MobileNet V3 (0.57 ms vs. 0.55 ms, Dell 3.6% faster) and DeepLab V3, where HP pulled slightly ahead (12.78 ms vs. 13.05 ms, HP 2.1% faster). However, Dell extended its lead in more demanding tests, including ResNet 50 (1.20 ms vs. 1.54 ms, 28.3% faster), Inception V4 (3.00 ms vs. 4.11 ms, 37% faster), YOLO V3 (5.63 ms vs. 6.78 ms, 20.4% faster), and REAL-ESRGAN (88.56 ms vs. 100.18 ms, 11.6% faster).
| GPU Results (Average Time in ms) | Dell Pro Max 18 Plus (Intel Core Ultra 9 285HX)(NVIDIA RTX PRO 5000) | HP ZBook Fury G1i (Intel Core Ultra 9 285HX)(NVIDIA RTX PRO 5000) |
| AI Computer Vision Overall Score | 1,032 | 890 |
| MobileNet V3 | 0.55 ms | 0.57 ms |
| ResNet 50 | 1.20 ms | 1.54 ms |
| Inception V4 | 3.00 ms | 4.11 ms |
| DeepLab V3 | 13.05 ms | 12.78 ms |
| YOLO V3 | 5.63 ms | 6.78 ms |
| REAL-ESRGAN | 88.56 ms | 100.18 ms |
Under TensorRT, the HP ZBook Fury G1i achieved an overall AI Computer Vision score of 1,014, compared to 1,609 on the Dell Pro Max 18 Plus, giving Dell a 58.7% advantage.
Examining individual benchmarks, Dell maintained a substantial lead across nearly all models. MobileNet V3 completed in 0.26 ms vs. 0.43 ms (65.4% faster), ResNet 50 in 0.98 ms vs. 1.69 ms (72.4% faster), and Inception V4 in 3.01 ms vs. 5.26 ms (74.8% faster). In DeepLab V3, Dell recorded 3.97 ms vs. 5.89 ms (48.4% faster), while in YOLO V3 and REAL-ESRGAN, the same trends carried forward, with Dell consistently completing tasks faster.
| TensorRT Results (Average Time in ms) | Dell Pro Max 18 Plus (Intel Core Ultra 9 285HX)(NVIDIA RTX PRO 5000) | HP ZBook Fury G1i (Intel Core Ultra 9 285HX)(NVIDIA RTX PRO 5000) |
| AI Computer Vision Overall Score | 1,609 | 1,014 |
| MobileNet V3 | 0.26 ms | 0.43 ms |
| ResNet 50 | 0.98 ms | 1.69 ms |
| Inception V4 | 3.01 ms | 5.26 ms |
| DeepLab V3 | 3.97 ms | 5.89 ms |
| YOLO V3 | 3.22 ms | 5.76 ms |
| REAL-ESRGAN | 90.17 ms | 110.30 ms |
UL Procyon: AI Text Generation
The Procyon AI Text Generation Benchmark streamlines AI LLM performance testing by providing a concise and consistent evaluation method. It allows for repeated testing across multiple LLM models while minimizing the complexity of large model sizes and variable factors. Developed with AI hardware leaders, it optimizes the use of local AI accelerators for more reliable and efficient performance assessments. The results measured below were tested using TensorRT.
On the Phi model, the HP ZBook Fury G1i scored 3,904, compared to Dell’s 4,475, resulting in a 14.6% lead for Dell. Its time to first token came in at 0.265 s vs. 0.237 s, a difference of 11.8%, while throughput reached 157.4 tokens/s vs. 185.1 tokens/s, trailing by 17.6%. The overall runtime finished at 19.03 seconds, compared to 16.31 seconds, making HP 16.6% slower.
With Mistral, HP scored 3,823 vs. Dell’s 4,295 (12.3% lower). First token times were 0.379 s vs. 0.347 s (8.4% slower), throughput measured 121.5 tokens/s vs. 140.5 tokens/s (15.7% lower), and total duration was 24.84 s vs. 21.66 s, leaving HP 13% slower.
In Llama3, HP posted 3,418 vs. 3,763 (10.1% lower), returned the first token at 0.357 s vs. 0.344 s (3.6% slower), sustained 102.6 tokens/s vs. 119.7 tokens/s (16.7% lower), and completed the run in 29.07 s vs. 25.16 s, making HP 13.3% slower.
Finally, for Llama2, HP scored 3,711 vs. 4,155 (12% behind). First token latency was 0.566 s vs. 0.546 s (3.5% slower), throughput reached 57.6 tokens/s vs. 69.7 tokens/s (21% lower), and total runtime closed at 50.61 s vs. 42.51 s, a gap of 19%.
| UL Procyon: AI Text Generation | Dell Pro Max 18 Plus (Intel Core Ultra 9 285HX)(NVIDIA RTX PRO 5000) | HP ZBook Fury G1i (Intel Core Ultra 9 285HX)(NVIDIA RTX PRO 5000) |
| Phi Overall Score | 4,475 | 3,904 |
| Phi Output Time To First Token | 0.237 s | 0.265 s |
| Phi Output Tokens Per Second | 185.118 tokens/s | 157.446 tokens/s |
| Phi Overall Duration | 16.314 s | 19.025 s |
| Mistral Overall Score | 4,295 | 3,823 |
| Mistral Output Time To First Token | 0.347 s | 0.379 s |
| Mistral Output Tokens Per Second | 140.546 tokens/s | 121.511 tokens/s |
| Mistral Overall Duration | 21.665 s | 24.843 s |
| Llama3 Overall Score | 3,763 | 3,418 |
| Llama3 Output Time To First Token | 0.344 s | 0.357 s |
| Llama3 Output Tokens Per Second | 119.741 tokens/s | 102.637 tokens/s |
| Llama3 Overall Duration | 25.165 s | 29.068 s |
| Llama2 Overall Score | 4,155 | 3,711 |
| Llama2 Output Time To First Token | 0.546 s | 0.566 s |
| Llama2 Output Tokens Per Second | 69.709 tokens/s | 57.620 tokens/s |
| Llama2 Overall Duration | 42.506 s | 50.608 s |
UL Procyon: AI Image Generation
The Procyon AI Image Generation Benchmark provides a consistent and accurate method for measuring AI inference performance across various hardware, ranging from low-power NPUs to high-end GPUs. It includes three tests: Stable Diffusion XL (FP16) for high-end GPUs, Stable Diffusion 1.5 (FP16) for moderately powerful GPUs, and Stable Diffusion 1.5 (INT8) for low-power devices. The benchmark uses the optimal inference engine for each system, ensuring fair and comparable results.
With Stable Diffusion 1.5 (FP16), the ZBook scored 3,120 compared to Dell’s 3,687, a difference of 18.2%. Total generation time finished in 32.04 s vs. 27.12 s, leaving HP 18.2% slower, while per-image speed measured 2.003 s/image vs. 1.695 s/image, again an 18.2% gap.
On the Stable Diffusion 1.5 (INT8) workload, HP recorded 32,824 vs. 44,101, trailing by 34.4%. Overall runtime closed at 7.62 s vs. 5.67 s (34.3% slower), with per-image generation at 0.952 s/image vs. 0.709 s/image, a 34.3% difference.
For the more demanding Stable Diffusion XL (FP16), HP scored 2,701 vs. 3,170, a 17.4% deficit. Total runtime came in at 222.13 s vs. 189.26 s, leaving HP 17.4% behind, while per-image generation took 13.88 s/image vs. 11.83 s/image, also 17.4% slower.
| UL Procyon: AI Image Generation | Dell Pro Max 18 Plus (Intel Core Ultra 9 285HX)(NVIDIA RTX PRO 5000) | HP ZBook Fury G1i (Intel Core Ultra 9 285HX)(NVIDIA RTX PRO 5000) |
| Stable Diffusion 1.5 (FP16) – Overall Score | 3,687 | 3,120 |
| Stable Diffusion 1.5 (FP16) – Overall Time | 27.119 s | 32.043 s |
| Stable Diffusion 1.5 (FP16) – Image Generation Speed | 1.695 s/image | 2.003 s/image |
| Stable Diffusion 1.5 (INT8) – Overall Score | 44,101 | 32,824 |
| Stable Diffusion 1.5 (INT8) – Overall Time | 5.669 s | 7.616 s |
| Stable Diffusion 1.5 (INT8) – Image Generation Speed | 0.709 s/image | 0.952 s/image |
| Stable Diffusion XL (FP16) – Overall Score | 3,170 | 2,701 |
| Stable Diffusion XL (FP16) – Overall Time | 189.260 s | 222.133 s |
| Stable Diffusion XL (FP16) – Image Generation Speed | 11.829 s/image | 13.883 s/image |
SPECworkstation 4
The SPECworkstation 4.0 benchmark is a comprehensive tool for evaluating all key aspects of workstation performance. It offers a real-world measure of CPU, graphics, accelerator, and disk performance, ensuring professionals have the data to make informed decisions about their hardware investments. The benchmark includes a dedicated set of tests focusing on AI and ML workloads, including data science tasks and ONNX runtime-based inference tests, reflecting the growing importance of AI/ML in workstation environments. It encompasses seven industry verticals and four hardware subsystems, providing a detailed and relevant measure of the performance of today’s workstations.
In AI & Machine Learning, HP scored 2.26 vs. 2.48, leaving it 9.7% behind. The Energy category followed a similar pattern at 2.20 vs. 2.49, a 13.2% gap, while Financial Services was much closer, 1.63 vs. 1.66, only 1.8% lower for HP.
Interestingly, HP gained a clear lead in Life Sciences, where it posted 2.46 vs. 1.50, a decisive 39% advantage. In Media & Entertainment, HP scored 2.51 vs. 2.66, a modest 6% deficit. For Product Design, the result was 2.16 vs. 2.35, leaving HP 8.1% behind, and in Productivity & Development, HP came in at 1.19 vs. 1.35, a 11.9% difference.
| SPECworkstation 4.0.0 (Higher is better) | Dell Pro Max 18 Plus (Intel Core Ultra 9 285HX)(NVIDIA RTX PRO 5000) | HP ZBook Fury G1i (Intel Core Ultra 9 285HX)(NVIDIA RTX PRO 5000) |
| AI & Machine Learning | 2.48 | 2.26 |
| Energy | 2.49 | 2.20 |
| Financial Services | 1.66 | 1.63 |
| Life Sciences | 1.50 | 2.46 |
| Media & Entertainment | 2.66 | 2.51 |
| Product Design | 2.35 | 2.16 |
| Productivity & Development | 1.35 | 1.19 |
SPECviewperf 15
SPECviewperf 15 is the industry-standard benchmark for evaluating 3D graphics performance across OpenGL, DirectX, and Vulkan APIs. It introduces new workloads such as blender-01 (Blender 3.6), unreal_engine-01 (Unreal Engine 5.4, DirectX 12), and enscape-01 (Enscape 4.0, Vulkan ray tracing), along with updated traces for 3ds Max, CATIA, Creo, Maya, and Solidworks. With its redesigned GUI, modern application support, and advanced rendering workloads, SPECviewperf 15 provides consistent, real-world insights into professional graphics performance.
In SPECviewperf 15, the HP ZBook Fury G1i turned in consistent results across a range of professional 3D workloads, though the Dell Pro Max 18 Plus generally maintained the performance edge.
In 3ds Max (3dsmax-08), HP scored 87.03 vs. 98.71, a 13.4% deficit. For Blender (blender-01), the gap was smaller, 78.03 vs. 83.23, or 6.7% lower. In CATIA (catia-07), HP reached 100.55 vs. 113.18, leaving it 12.6% behind, while in Creo (creo-04) it posted 238.38 vs. 247.79, a 3.9% gap.
The Energy (energy-04) workload came in at 153.43 vs. 170.27, putting HP 11% lower, and in Enscape (enscape-01), the margin was 77.57 vs. 86.70, a 10.5% deficit. In Maya (maya-07), HP recorded 217.67 vs. 232.48, or 6.4% behind, while in Medical (medical-04), it posted 183.39 vs. 210.51, a 12.9% difference.
For SolidWorks (solidworks-08), HP managed 110.66 vs. 145.56, resulting in a 24% deficit. In Unreal Engine (unreal_engine-01), it finished at 79.85 vs. 93.46, a 14.6% gap.
| SPECviewperf (Higher is better) | Dell Pro Max 18 Plus (Intel Core Ultra 9 285HX)(NVIDIA RTX PRO 5000) | HP ZBook Fury G1i (Intel Core Ultra 9 285HX)(NVIDIA RTX PRO 5000) |
| 3dsmax-08 | 98.71 | 87.03 |
| blender-01 | 83.23 | 78.03 |
| catia-07 | 113.18 | 100.55 |
| creo-04 | 247.79 | 238.38 |
| energy-04 | 170.27 | 153.43 |
| enscape-01 | 86.70 | 77.57 |
| maya-07 | 232.48 | 217.67 |
| medical-04 | 210.51 | 183.39 |
| solidworks-08 | 145.56 | 110.66 |
| unreal_engine-01 | 93.46 | 79.85 |
LuxMark
LuxMark is a GPU benchmark that utilizes LuxRender, an open-source ray-tracing renderer, to evaluate a system’s performance in handling highly detailed 3D scenes. This benchmark is relevant for assessing the graphical rendering capabilities of servers and workstations, especially for visual effects and architectural visualization applications, where accurate light simulation is crucial.
In the LuxMark GPU rendering benchmark, the HP ZBook Fury G1i delivered solid performance but still trailed behind the Dell Pro Max 18 Plus in both tested scenes.
In the Hallbench workload, HP scored 26,594 compared to 29,605, representing a 10.2% deficit. For the more complex Food scene, the ZBook reached 11,500 vs. 13,042, finishing 11.8% lower.
| LuxMark (Higher is better) | Dell Pro Max 18 Plus (Intel Core Ultra 9 285HX)(NVIDIA RTX PRO 5000) | HP ZBook Fury G1i (Intel Core Ultra 9 285HX)(NVIDIA RTX PRO 5000) |
| Hallbench | 29,605 | 26,594 |
| Food | 13,042 | 11,500 |
7-Zip Compression
The 7-Zip Compression Benchmark evaluates CPU performance during compression and decompression tasks, measuring ratings in GIPS (Giga Instructions Per Second) and CPU usage. Higher GIPS and efficient CPU usage indicate superior performance.
In the 7-Zip Compression Benchmark, the HP ZBook Fury G1i performed solidly but trailed behind the Dell Pro Max 18 Plus in both compression and decompression workloads.
For compression, HP recorded a resulting rating of 102.0 GIPS vs. 137.5 GIPS, a 25.8% deficit. In decompression, the ZBook scored 146.2 GIPS vs. 163.1 GIPS, leaving it 10.4% lower.
Looking at the total rating, HP reached 124.1 GIPS compared to Dell’s 150.3 GIPS, a difference of 17.4% in Dell’s favor.
| 7-Zip Compression Benchmark (Higher is Better) | Dell Pro Max 18 Plus (Intel Core Ultra 9 285HX)(NVIDIA RTX PRO 5000) | HP ZBook Fury G1i (Intel Core Ultra 9 285HX)(NVIDIA RTX PRO 5000) | |||
| Compression | |||||
| Current CPU Usage | 1,905% | 1,796% | |||
| Current Rating/Usage | 7.275 GIPS | 5.692 GIPS | |||
| Current Rating | 138.244 GIPS | 102.234 GIPS | |||
| Resulting CPU Usage | 1,891% | 1,780% | |||
| Resulting Rating/Usage | 7.270 GIPS | 5.731 GIPS | |||
| Resulting Rating | 137.459 GIPS | 102.012 GIPS | |||
| Decompression | |||||
| Current CPU Usage | 2,226% | 2,208% | |||
| Current Rating/Usage | 7.175 GIPS | 6.411 GIPS | |||
| Current Rating | 159.735 GIPS | 141.545 GIPS | |||
| Resulting CPU Usage | 2,242% | 2,213% | |||
| Resulting Rating/Usage | 7.276 GIPS | 6.608 GIPS | |||
| Resulting Rating | 163.149 GIPS | 146.208 GIPS | |||
| Total Rating | |||||
| Total CPU Usage | 2,067% | 1,997% | |||
| Total Rating/Usage | 7.273 GIPS | 6.170 GIPS | |||
| Total Rating | 150.304 GIPS | 124.110 GIPS | |||
Blackmagic RAW Speed Test
The Blackmagic RAW Speed Test is a performance benchmarking tool that measures a system’s capabilities for handling video playback and editing using the Blackmagic RAW codec. It evaluates how well a system can decode and play back high-resolution video files, providing frame rates for both CPU- and GPU-based processing.
In the Blackmagic RAW Speed Test, the HP ZBook Fury G1i showed a mixed outcome compared to the Dell Pro Max 18 Plus.
For the 8K CPU test, HP scored 112 vs. 128, a 12.5% deficit. However, in the 8K OpenCL test, the ZBook pulled ahead with 182 vs. 168, giving it an 8.3% advantage.
| Blackmagic RAW Speed Test | Dell Pro Max 18 Plus (Intel Core Ultra 9 285HX)(NVIDIA RTX PRO 5000) | HP ZBook Fury G1i (Intel Core Ultra 9 285HX)(NVIDIA RTX PRO 5000) |
|---|---|---|
| 8K CPU | 128 | 112 |
| 8K OPENCL | 168 | 182 |
Blackmagic Disk Speed Test
The Blackmagic Disk Speed Test evaluates storage performance by measuring read and write speeds, providing insights into a system’s ability to handle data-intensive tasks, such as video editing and large file transfers.
In the Disk Speed Test for read speeds, HP reached 6,554.2 MB/s vs. 7,776.1 MB/s, a 15.7% deficit. In write speeds, the ZBook posted 5,728.0 MB/s vs. 6,022.0 MB/s, leaving it 4.9% lower.
| Disk Speed Test (higher is better) | Dell Pro Max 18 Plus (Intel Core Ultra 9 285HX)(NVIDIA RTX PRO 5000) | HP ZBook Fury G1i (Intel Core Ultra 9 285HX)(NVIDIA RTX PRO 5000) |
| Read | 7,776.1 MB/s | 6,554.2 MB/s |
| Write | 6,022.0 MB/s | 5,728.0 MB/s |
Blender 4.5
Blender is an open-source 3D modeling application. This benchmark was run using the Blender Benchmark utility. The score is measured in samples per minute, with higher values indicating better performance.
In the Blender CPU benchmark, measured in samples per minute, the HP ZBook Fury G1i again performed well but consistently trailed the Dell Pro Max 18 Plus across all tested scenes.
In the Monster render, HP produced 203.91 vs. 237.1, which is 14% lower. For Junkshop, it delivered 132.23 vs. 150.7, or 12.3% lower. In the more demanding Classroom scene, HP scored 88.16 vs. 94.5, coming in 6.7% lower.
| Blender CPU (samples per minute, higher is better) | Dell Pro Max 18 Plus (Intel Core Ultra 9 285HX)(NVIDIA RTX PRO 5000) | HP ZBook Fury G1i (Intel Core Ultra 9 285HX)(NVIDIA RTX PRO 5000) |
| Monster | 237.1 | 203.91 |
| Junkshop | 150.7 | 132.23 |
| Classroom | 94.5 | 88.16 |
When moving to the Blender GPU benchmark, the HP ZBook Fury G1i came in consistently 100–200 points lower than the Dell Pro Max 18 Plus across all scenes.
In the Monster render, HP delivered 3,710.99 vs. 3,928.6, which is 5.5% lower. For Junkshop, the ZBook scored 2,056.19 vs. 2,150.1, a difference of 4.4%. In the Classroom scene, it reached 1,888.38 vs. 2,010.2, coming in 6.1% lower.
| Blender GPU (samples per minute, higher is better) | Dell Pro Max 18 Plus (Intel Core Ultra 9 285HX)(NVIDIA RTX PRO 5000) | HP ZBook Fury G1i (Intel Core Ultra 9 285HX)(NVIDIA RTX PRO 5000) |
| Monster | 3,928.6 | 3,710.99 |
| Junkshop | 2150.1 | 2056.19 |
| Classroom | 2010.2 | 1,888.38 |
y-cruncher
y-cruncher is a multithreaded and scalable program that can compute Pi and other mathematical constants to trillions of digits. Since its launch in 2009, it has become a popular benchmarking and stress-testing application for overclockers and hardware enthusiasts.
In the Y-Cruncher benchmark, which measures total computation time for calculating Pi to high digit counts, starting at 1 billion digits, HP completed in 22.04 seconds, compared to 20.08 seconds, which is 9.8% slower. At 2.5 billion digits, the ZBook posted 64.91 s vs. 59.23 s, or 9.6% slower. With 5 billion digits, it recorded 161.30 s vs. 142.82 s, coming in 12.9% slower. At the highest scale of 10 billion digits, HP finished in 359.49 s vs. 311.81 s, a difference of 15.3%.
| Y-Cruncher (Total Computation Time) | Dell Pro Max 18 Plus (Intel Core Ultra 9 285HX)(NVIDIA RTX PRO 5000) | HP ZBook Fury G1i (Intel Core Ultra 9 285HX)(NVIDIA RTX PRO 5000) |
|---|---|---|
| 1 Billion | 20.081 s | 22.042 s |
| 2.5 Billion | 59.228 s | 64.911 s |
| 5 Billion | 142.822 s | 161.295 s |
| 10 Billion | 311.805 s | 359.489 s |
Geekbench 6
Geekbench 6 is a cross-platform benchmark that measures overall system performance.
In Geekbench 6, the HP ZBook Fury G1i edged out the Dell Pro Max 18 Plus in single-core performance with a score of 3,010 vs. 2,977, a difference of about 1.1%. The Dell, however, showed a stronger lead in multi-core performance, scoring 20,717 compared to 18,694 for the HP, a 10.8% advantage. GPU performance was an even bigger differentiator, with the Dell reaching 240,530 in OpenCL against the HP’s 194,740, giving the Dell a 23.5% lead. These results highlight Dell as the stronger choice for heavy multi-core workloads and GPU-accelerated tasks, while HP holds a small edge in single-thread efficiency.
| Geekbench 6 (higher is better) | Dell Pro Max 18 Plus (Intel Core Ultra 9 285HX)(NVIDIA RTX PRO 5000) | HP ZBook Fury G1i (Intel Core Ultra 9 285HX)(NVIDIA RTX PRO 5000) |
|---|---|---|
| CPU Single-Core | 2,977 | 3,010 |
| CPU Multi-Core | 20,717 | 18,694 |
| GPU OpenCL | 240,530 | 194,740 |
V-Ray
The V-Ray Benchmark measures rendering performance for CPUs, NVIDIA GPUs, or both using advanced V-Ray 6 engines. It uses quick tests and a simple scoring system to let users evaluate and compare their systems’ rendering capabilities. It’s an essential tool for professionals seeking efficient performance insights.
In the V-Ray benchmark, which measures rendering performance across GPUs, the HP ZBook Fury G1i scored 7,820, compared to 8,191 on the Dell Pro Max 18 Plus. This places HP 4.5% lower in overall rendering capability.
| Vray (higher is better) | Dell Pro Max 18 Plus (Intel Core Ultra 9 285HX)(NVIDIA RTX PRO 5000) | HP ZBook Fury G1i (Intel Core Ultra 9 285HX)(NVIDIA RTX PRO 5000) |
|---|---|---|
| Score | 8,191 | 7,820 |
Topaz Video AI
Topaz Video AI is a professional application for enhancing and restoring video using advanced AI models. It supports tasks such as upscaling footage to 4K or 8K, sharpening blurry content, reducing noise, improving facial details, colorizing black-and-white footage, and interpolating frames for smoother motion. The suite includes an onboard benchmark that measures system performance across its different video-enhancing algorithms, giving a clear view of how well hardware platforms handle demanding AI video processing workloads.
In the Topaz Video AI benchmark, the HP ZBook Fury G1i trailed the Dell Pro Max 18 Plus in most workloads, though both systems proved capable of handling demanding AI video tasks.
In the Artemis model, HP delivered 25.22 fps vs. 31.10 fps at 1X, about 19% lower. With Proteus, results came in at 24.45 fps vs. 28.56 fps at 1X (14.4% lower), and 13.22 fps vs. 18.70 fps at 2X (29.3% lower). The Gaia model showed one of the largest gaps, with HP at 27.18 fps vs. 38.53 fps at 1X (29.4% lower).
On the lighter Hyperion HDR test, the gap was much narrower, with HP at 18.76 fps vs. 19.39 fps, only 3.3% lower. Similarly, in accelerated models like APFast, HP posted 38.21 fps vs. 43.90 fps, or 13% lower.
| Topaz Video AI Benchmark (frames per second, higher is better) | Dell Pro Max 18 Plus (Intel Core Ultra 9 285HX)(NVIDIA RTX PRO 5000) | HP ZBook Fury G1i (Intel Core Ultra 9 285HX)(NVIDIA RTX PRO 5000) | ||||
|---|---|---|---|---|---|---|
| Model | 1X | 2X | 4X | 1X | 2X | 4X |
| Artemis | 31.10 | 16.94 | 4.22 | 25.22 | 10.87 | 3.42 |
| Iris | 27.77 | 16.07 | 4.16 | 23.31 | 12.85 | 3.43 |
| Proteus | 28.56 | 18.70 | 4.70 | 24.45 | 13.22 | 3.68 |
| Gaia | 38.53 | 5.88 | 4.27 | 27.18 | 5.06 | 3.21 |
| Nyx | 0.86 | – | – | 0.78 | – | – |
| Nyx Fast | 19.64 | – | – | 17.39 | – | – |
| Rhea | – | – | 3.20 | – | – | 2.81 |
| RXL | – | – | 3.06 | – | – | 2.74 |
| Hyperion HDR | 19.39 | – | – | 18.76 | – | – |
| Apollo | 33.49 | – | – | 28.35 | – | – |
| Aion | 25.06 | – | – | 22.73 | – | – |
| APFast | 43.90 | – | – | 38.21 | – | – |
| Chronos | 20.43 | – | – | 18.25 | – | – |
| CHFast | 30.88 | – | – | 26.17 | – | – |
PCMark 10
PCMark 10 is an industry-standard benchmark designed to measure complete system performance for modern office environments. It features updated workloads for Windows 10 and evaluates everyday tasks such as productivity, web browsing, video conferencing, and content creation. The benchmark is easy to run, delivers multi-level scoring (from high-level overall to detailed workload scores), and includes dedicated battery life and storage tests. While UL Solutions now recommends Procyon for newer, application-based testing, PCMark 10 remains a reliable and widely-used tool for assessing general PC performance.
In PCMark 10, which measures complete system performance across everyday productivity and content creation workloads, the HP ZBook Fury G1i slightly edged out the Dell Pro Max 18 Plus.
HP scored 8,667 vs. 8,581, giving it a 1% lead in this general-purpose benchmark.
| PCMark 10 (higher is better) | Dell Pro Max 18 Plus (Intel Core Ultra 9 285HX)(NVIDIA RTX PRO 5000) | HP ZBook Fury G1i (Intel Core Ultra 9 285HX)(NVIDIA RTX PRO 5000) |
|---|---|---|
| Score | 8,581 | 8,667 |
3DMark CPU
The 3DMark CPU Profile evaluates processor performance across six threading levels: 1, 2, 4, 8, 16, and max threads. Each test runs the same boid-based simulation workload to assess how well the CPU scales under different thread counts, with minimal GPU involvement. The benchmark helps identify single-thread efficiency as well as multithreaded potential for tasks like gaming, content creation, and rendering. Scores at eight threads often align with modern DirectX 12 gaming performance, while 1 to 4 thread results reflect older or esports game scenarios
At the max threads level, HP scored 16,297 vs. 16,497, only 1.2% lower. With 16 threads, the ZBook actually pulled ahead at 13,868 vs. 13,224, a 4.9% advantage. At 8 threads, it landed at 7,275 vs. 7,658, or 5% lower.
In lower thread counts, HP posted 4,865 vs. 4,583 at 4 threads, giving it a 6.1% lead, and 2,476 vs. 2,435 at 2 threads, a 1.7% edge. For single-thread, HP finished at 1,264 vs. 1,234, a 2.4% advantage.
| 3DMark CPU Profile (higher is better) | Dell Pro Max 18 Plus (Intel Core Ultra 9 285HX)(NVIDIA RTX PRO 5000) | HP ZBook Fury G1i (Intel Core Ultra 9 285HX)(NVIDIA RTX PRO 5000) |
|---|---|---|
| Max Threads | 16,497 | 16,297 |
| 16 Threads | 13,224 | 13,868 |
| 8 Threads | 7,658 | 7,275 |
| 4 threads | 4,583 | 4,865 |
| 2 threads | 2,435 | 2,476 |
| 1 threads | 1,234 | 1,264 |
3DMark Storage
The 3DMark Storage Benchmark tests your SSD’s gaming performance by measuring tasks like loading games, saving progress, installing game files, and recording gameplay. It evaluates how well your storage handles real-world gaming activities and supports the latest storage technologies for accurate performance insights.
In the 3DMark Storage Benchmark, the HP ZBook Fury G1i scored 2,304, compared to 2,368 on the Dell Pro Max 18 Plus. This puts HP 2.7% lower in storage responsiveness for gaming-focused workloads.
| 3DMark Storage (higher is better) | Dell Pro Max 18 Plus (Intel Core Ultra 9 285HX)(NVIDIA RTX PRO 5000) | HP ZBook Fury G1i (Intel Core Ultra 9 285HX)(NVIDIA RTX PRO 5000) |
|---|---|---|
| Score | 2,368 | 2,304 |
PCMark battery
To measure the battery life of mobile systems, we leverage PCMark 10. It includes a Modern Office benchmark, providing a realistic assessment of battery life during typical workday tasks. It simulates everyday office activities, such as writing documents, browsing the web, and participating in video conferences, with built-in periods of inactivity to mirror how people use their laptops. This isn’t just about peak performance; it focuses on sustained usage under a moderate workload. It is helpful for understanding how long you can expect a laptop to last through a day of office work.
The test operates in 10-minute cycles, balancing active tasks with periods of inactivity. Specifically, the Writing and Web Browsing workloads involve roughly 4.5 minutes of activity followed by 5.5 minutes of inactivity, while Video Conferencing is lighter, at 2 minutes of busy time and 8 minutes of idle time. This approach aims to provide a more accurate representation of real-world battery drain than running demanding tasks continuously, giving you a better idea of longevity for everyday productivity.
In our battery testing, the HP ZBook Fury G1i lasted longer, reaching 4 hours and 48 minutes compared to the Dell Pro Max 18 Plus at 3 hours and 39 minutes. However, it’s worth noting that the Dell consistently showed higher performance across the majority of our benchmark tests, trading some efficiency for raw power. This positions Dell as the stronger choice for users prioritizing maximum performance, while HP may appeal more to those needing extended mobility.
| PCMark Battery (higher is better) | Dell Pro Max 18 Plus (Intel Core Ultra 9 285HX)(NVIDIA RTX PRO 5000) | HP ZBook Fury G1i (Intel Core Ultra 9 285HX)(NVIDIA RTX PRO 5000) |
|---|---|---|
| Time Elapsed | 3 Hr 39 Min | 4 Hr 48 Min |
Conclusion
The ZBook Fury G1i 18 delivers the core attributes workstation buyers expect from HP. Strong build, easy service access, ECC-capable memory across four SODIMMs, four M.2 bays with Gen5 options, and modern I/O with dual Thunderbolt 5. The 18-inch 2560×1600 display and RTX PRO 5000 GPU options give creators and engineers a dependable canvas with proven ISV support.
Battery life was a clear advantage at 4 hours 48 minutes in our PCMark test, which matters for users moving between rooms and job sites. Combined with HP’s security and manageability stack, the ZBook Fury G1i 18 stands out as a reliable mobile workstation that prioritizes serviceability and real-world productivity.


 Amazon