

Earlier this year, we looked at the Dell Pro 14 Premium, a compact business notebook that showcased Intel’s Lunar Lake CPUs, OLED display options, and a design aimed squarely at executives and professionals on the go. That system emphasized portability, integrated performance, and premium features in a smaller form factor. The Dell Pro Max 18 Plus, on the other hand, represents the opposite end of Dell’s professional mobile lineup.
Where the Pro 14 Premium focuses on mobility, the Pro Max 18 Plus is a desktop-replacement class workstation designed for professionals who need maximum compute power, expansive display real estate, and enterprise-grade reliability. With Intel Arrow Lake Core Ultra HX-series processors featuring vPro technology, paired with NVIDIA’s RTX PRO GPUs, including the RTX PRO 5000, this platform is purpose-built for AI inference, rendering, engineering, and other data-intensive workflows that smaller systems cannot match.
The Pro Max 18 Plus also offers support for up to 256GB of CAMM2 memory, along with Gen5 SSD storage support and advanced thermal design to handle sustained performance. Its expansive 18-inch QHD+ 120 Hz display provides a color-accurate workspace for creative and professional applications. At the same time, enterprise features such as vPro manageability, security options, and ISV certifications ensure it fits seamlessly into business environments.
Dell provided us with a fully configured system for review. While the base configuration starts at $3,488 on dell.com at the time of review, the fully configured system we tested is priced at $9,245.52 as reviewed. This positions the Pro Max 18 Plus as the flagship of Dell’s professional mobile lineup, offering tower-class capability in a single, mobile form factor.
Dell Pro Max 18 Plus Specifications
The table below highlights the full range of features, technical specifications, and configuration options available within the Dell Pro Max 18 Plus series.
| Feature | Technical Specification |
|---|---|
| Model Number | Dell Pro Max 18 PLUS, MB18250 |
| Processor |
|
| Operating System |
Note: Windows 10 22H2 supported only when downgraded by end users. Support subject to Microsoft Windows 10 End of Support plan. |
| Memory |
|
| Primary Storage |
|
| Graphics |
|
| Display | 45.7 cm (18”), Non-Touch, QHD+ (2560×1600), 120 Hz, WVA, 100% DCI-P3, 500 nits, Low Blue Light |
| Case Color | Magnetite |
| Keyboard | Extensive regional/non-backlit/backlit options with Copilot key, numeric keypad, 99–103 key layouts.
Touchpad: Precision touchpad. |
| Ports |
|
| Slots | 1× SD card, 1× Smart card reader, 1× Noble lock |
| Dimensions (US) | Height (rear): 0.77 in (19.56 mm) Height (front): 0.71 in (17.92 mm) Height (peak): 1.25 in (31.70 mm, includes Quick Access Door; 30.2 mm without) Width: 15.83 in (402 mm) Depth: 11.02 in (279.95 mm) Weight (min): 7.17 lb (3.25 kg) |
| Camera |
|
| Audio | Stereo speakers with Cirrus Logic CS42L43, 2 W ×2 = 4 W total |
| Wireless |
|
| Battery | 6-cell, 96 Wh Lithium Ion, ExpressCharge Boost |
| Power | 165 W AC (USB-C), 280 W AC (USB-C) |
| Chipset | Intel ARL-HX WM880 |
| Security |
|
| Docking Options | Dell WD19DCS, DA305, SD25TB5, WD25TB5 |
| Software & Management | Dell Command Suite (Configure, Monitor, Update, Deploy, Intel vPro OOB, etc.), Dell Optimizer 6.0, Proactive Systems Management |
| Warranty |
|
| Chassis | Magnetite |
| Regulatory | Dell Product Safety, EMC & Environmental Datasheets; Responsible Business Alliance Policy |
| Multimedia Accessories | Dell SP3022 Speakerphone, WL7024 ANC Headset, U2724D/U3221Q displays, WB7022 Webcam |
| Input Accessories | KB900/KM900 keyboards, MS900 mouse |
| Sensors | Accelerometer, Gyro, Ambient Light (8MP config), Sensor Hub, Hall Effect, Windows Auto Brightness, Adaptive Thermal |
Dell Pro Max 18 Plus Build and Design
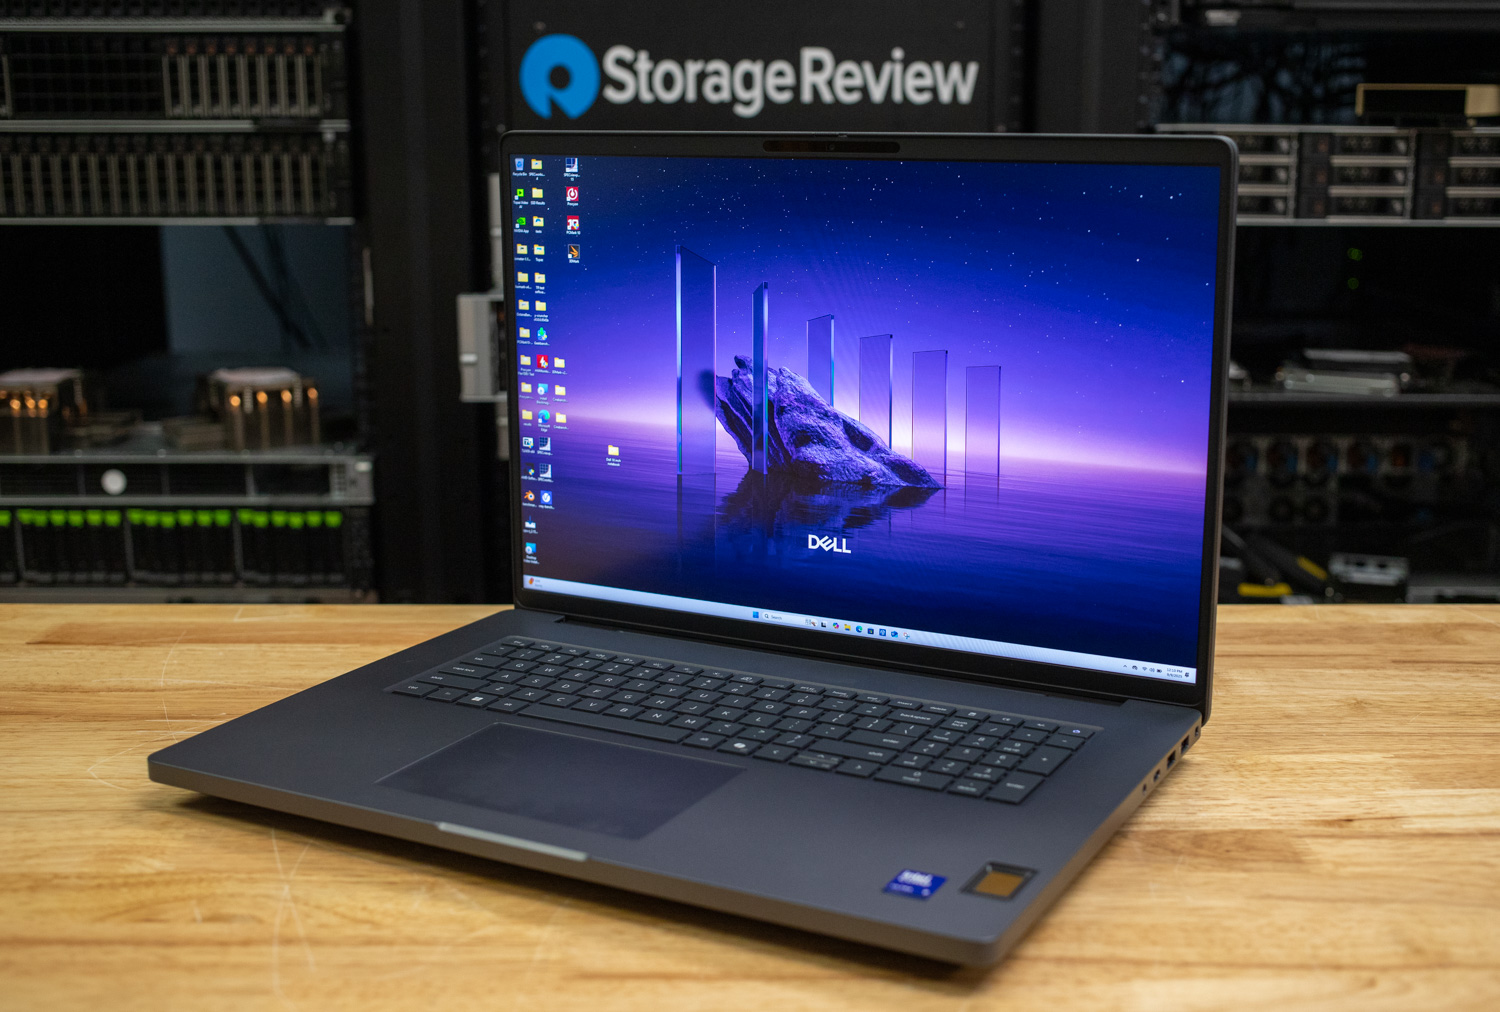
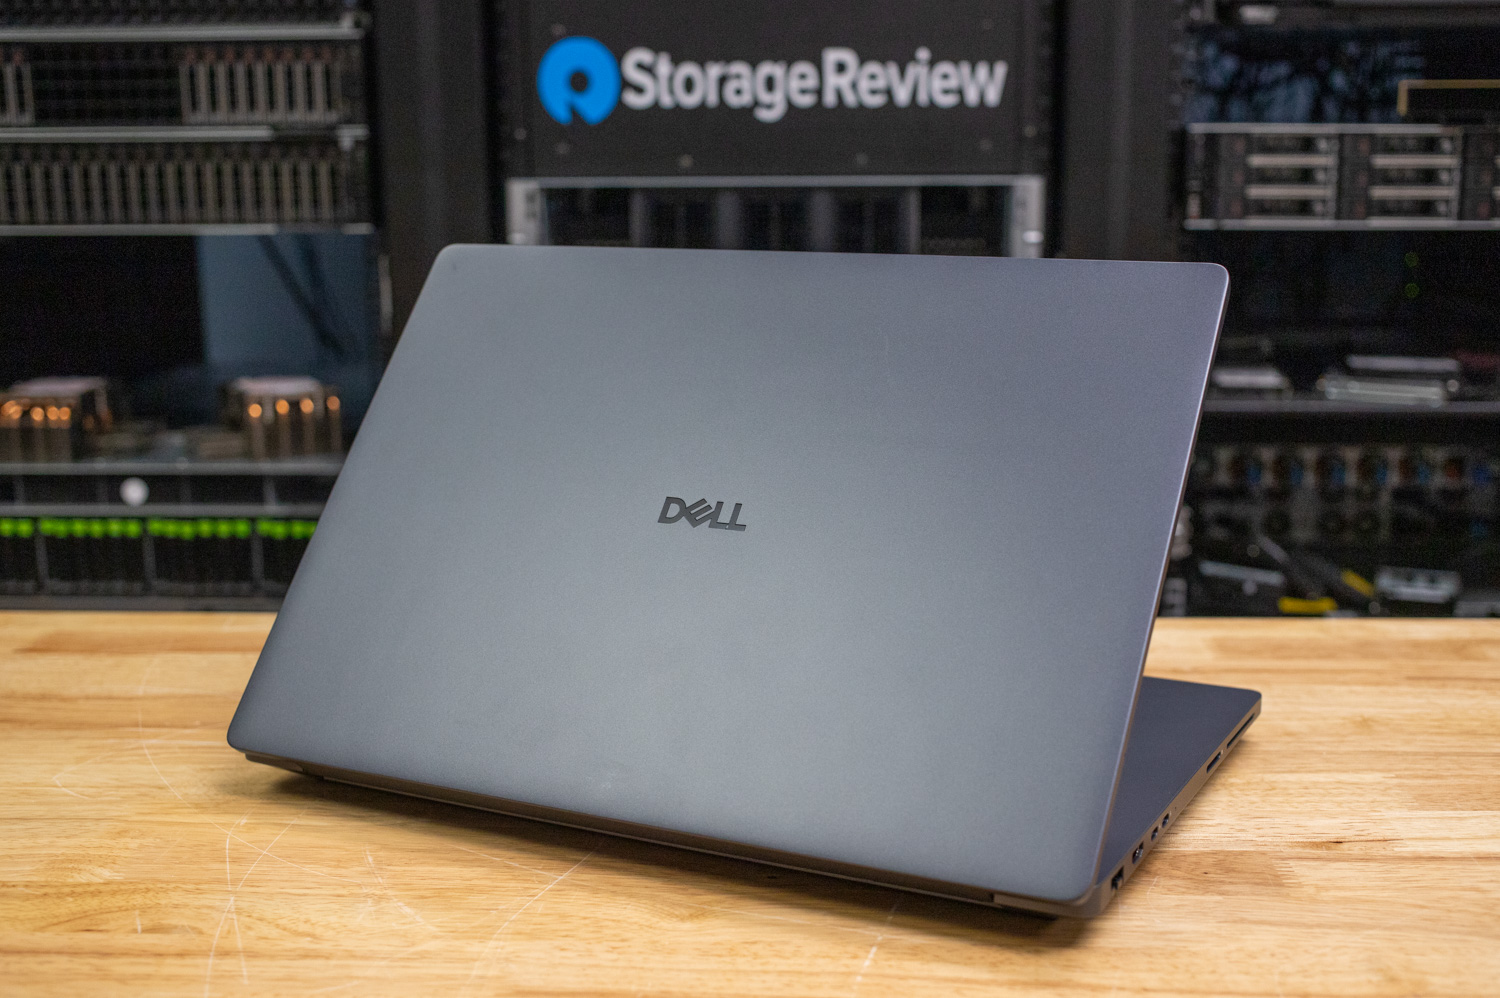
The Dell Pro Max 18 Plus (MB18250) is built as a large-format mobile workstation, balancing portability with the power expected in a desktop-replacement class system. Measuring 15.83 × 11.02 × 0.71–1.25 inches (402 × 279.95 × 17.92–31.7 mm) and weighing in at a minimum of 7.17 pounds (3.25 kg), it is notably substantial yet engineered with premium fit and finish. The chassis comes in a professional Magnetite color scheme, and its construction includes a quick-access door for simplified upgrades and service.
Display and Front
The front of the Pro Max 18 Plus is dominated by its 18-inch QHD+ (2560×1600) panel, delivering excellent visual quality with 120 Hz refresh rate, wide-viewing-angle (WVA) technology, 100% DCI-P3 color gamut, and 500-nit brightness. This combination makes it suitable for both creative workflows and general professional use. The display is non-touch but designed with Low Blue Light technology for reduced eye strain. Above the screen, Dell offers two camera options: a 1080p HDR FHD webcam with dual microphones or an 8MP HDR RGB+IR sensor that adds advanced features such as Windows Hello IR authentication and ambient light sensing.
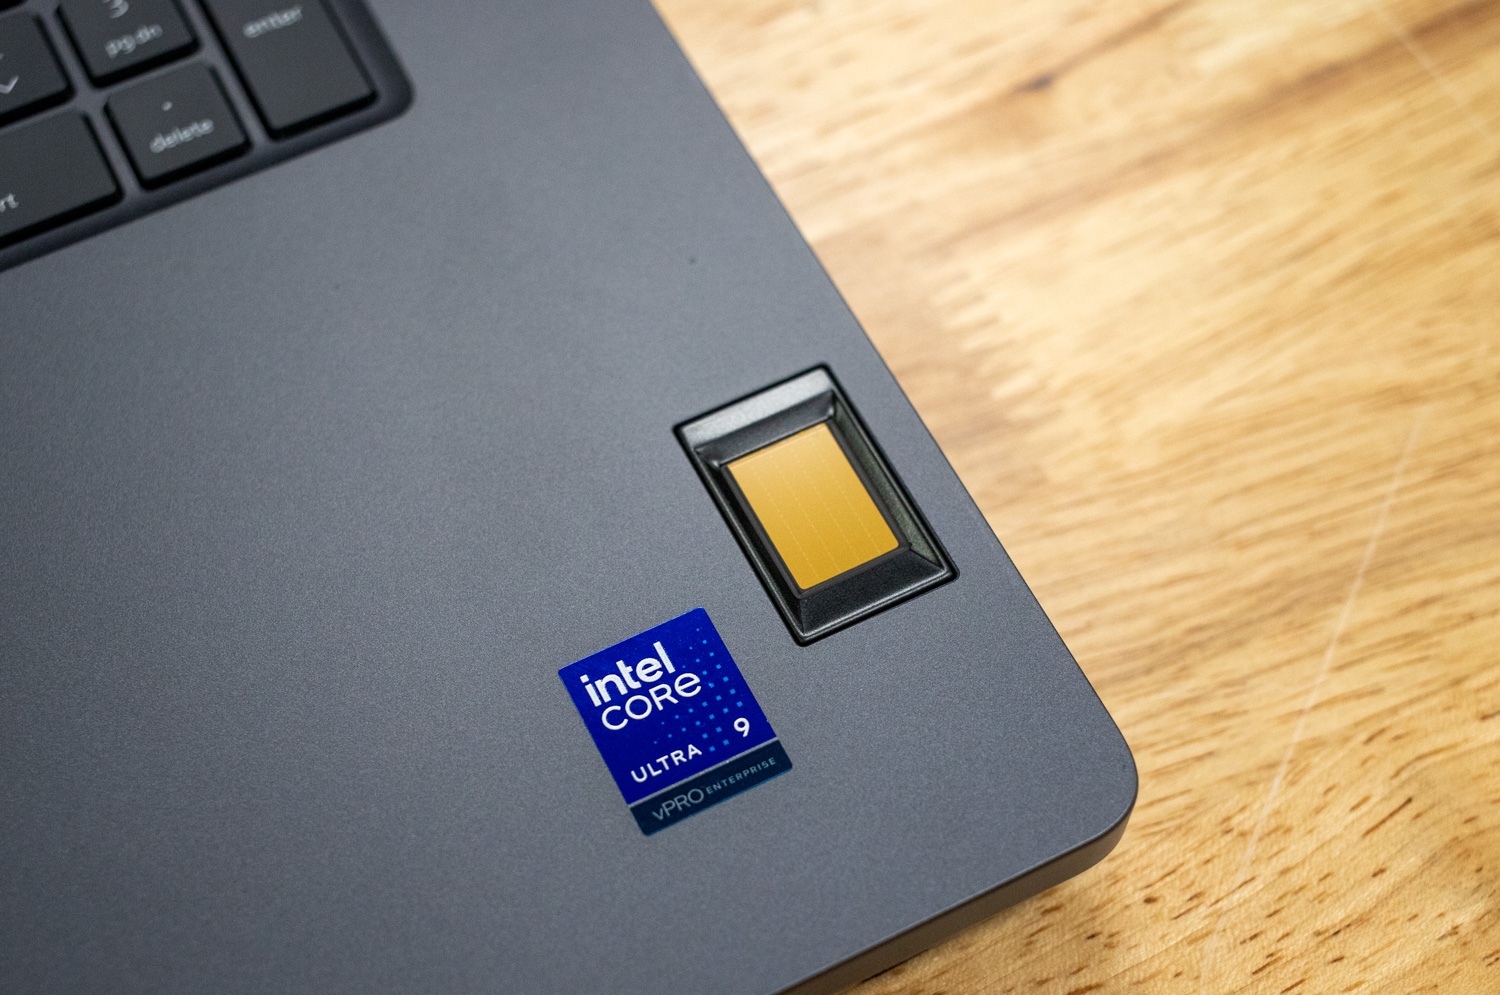
Top Side
The top side houses the power button (right), which doubles as an optional fingerprint reader for secure biometric login. Just below sits the (full-size) 99-key backlit keyboard, offered in multiple regional layouts with or without backlighting, a numeric keypad, and Dell’s Copilot key. 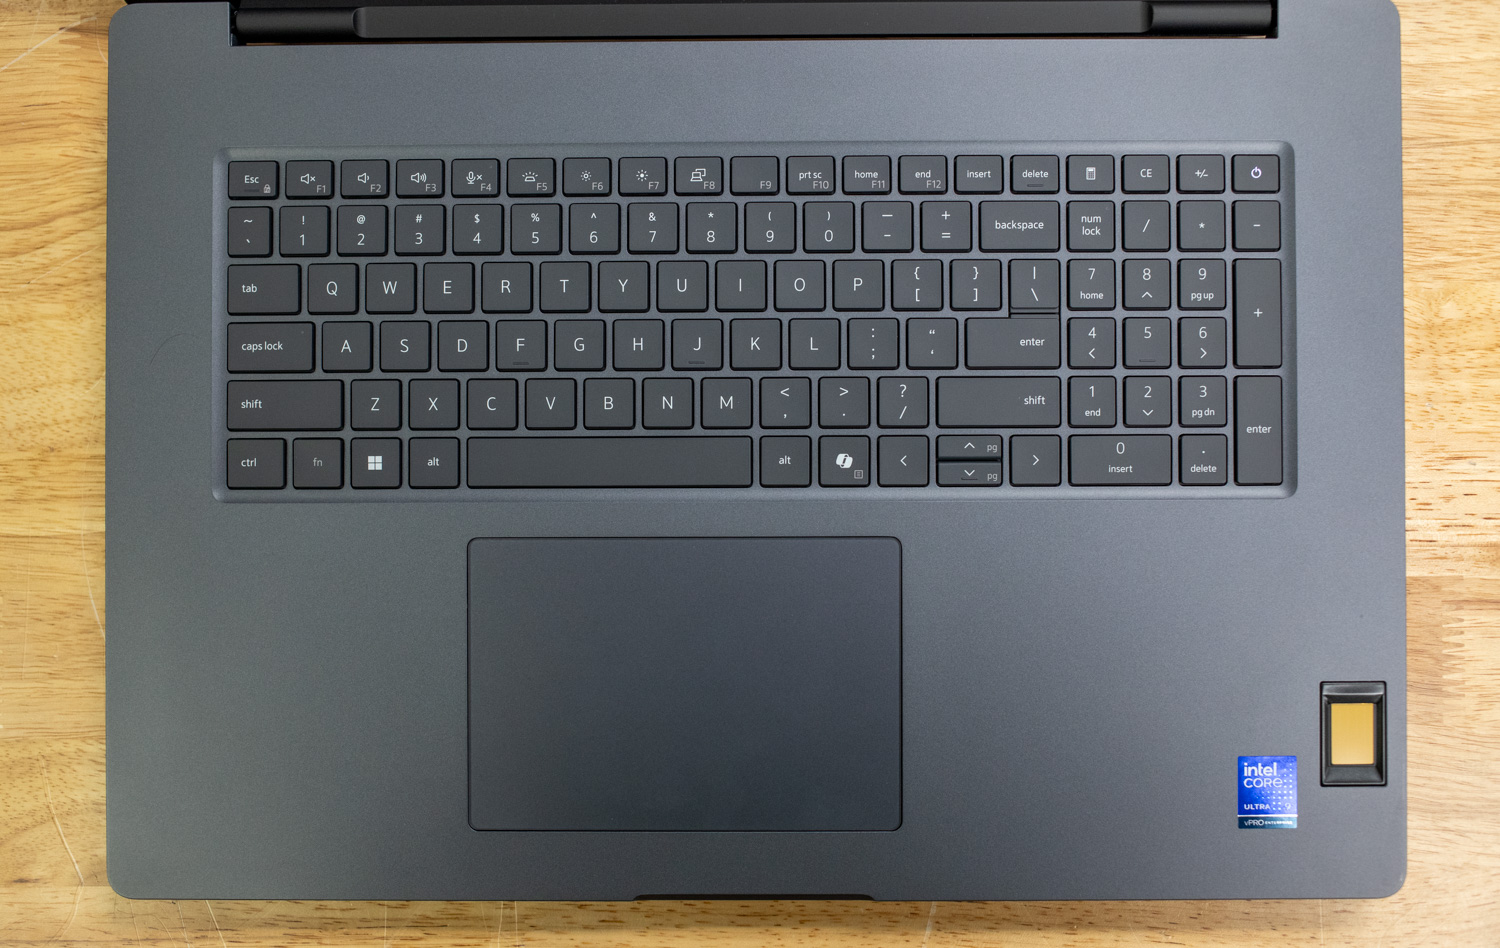
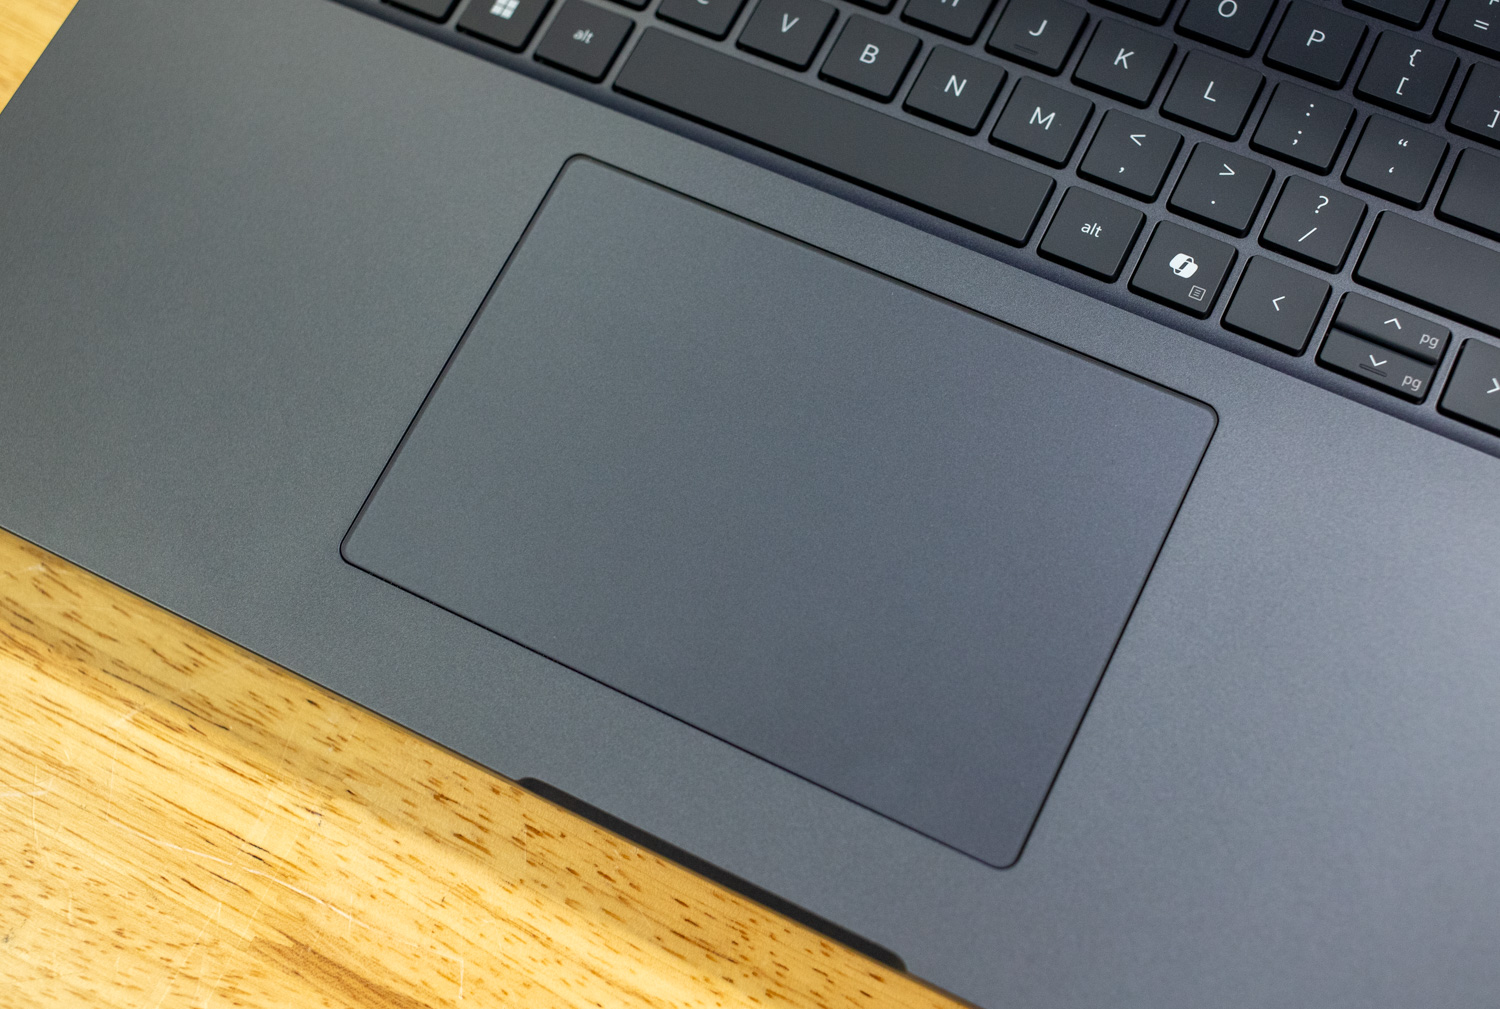
It is paired with a generously sized precision touchpad that supports multitouch gestures, delivering smooth and responsive navigation while contributing to the system’s overall clean and professional appearance.
Inside, the Pro Max 18 Plus is powered by Intel’s Core Ultra HX-series processors, with options ranging from the Core Ultra 5 245HX up to the Core Ultra 9 285HX. Graphics are handled by NVIDIA’s Blackwell-based RTX PRO series, scaling from the RTX PRO 1000 (8 GB GDDR7) to the high-end RTX PRO 5000 (24 GB GDDR7), ensuring a wide performance range depending on the workload and budget.
Left Side
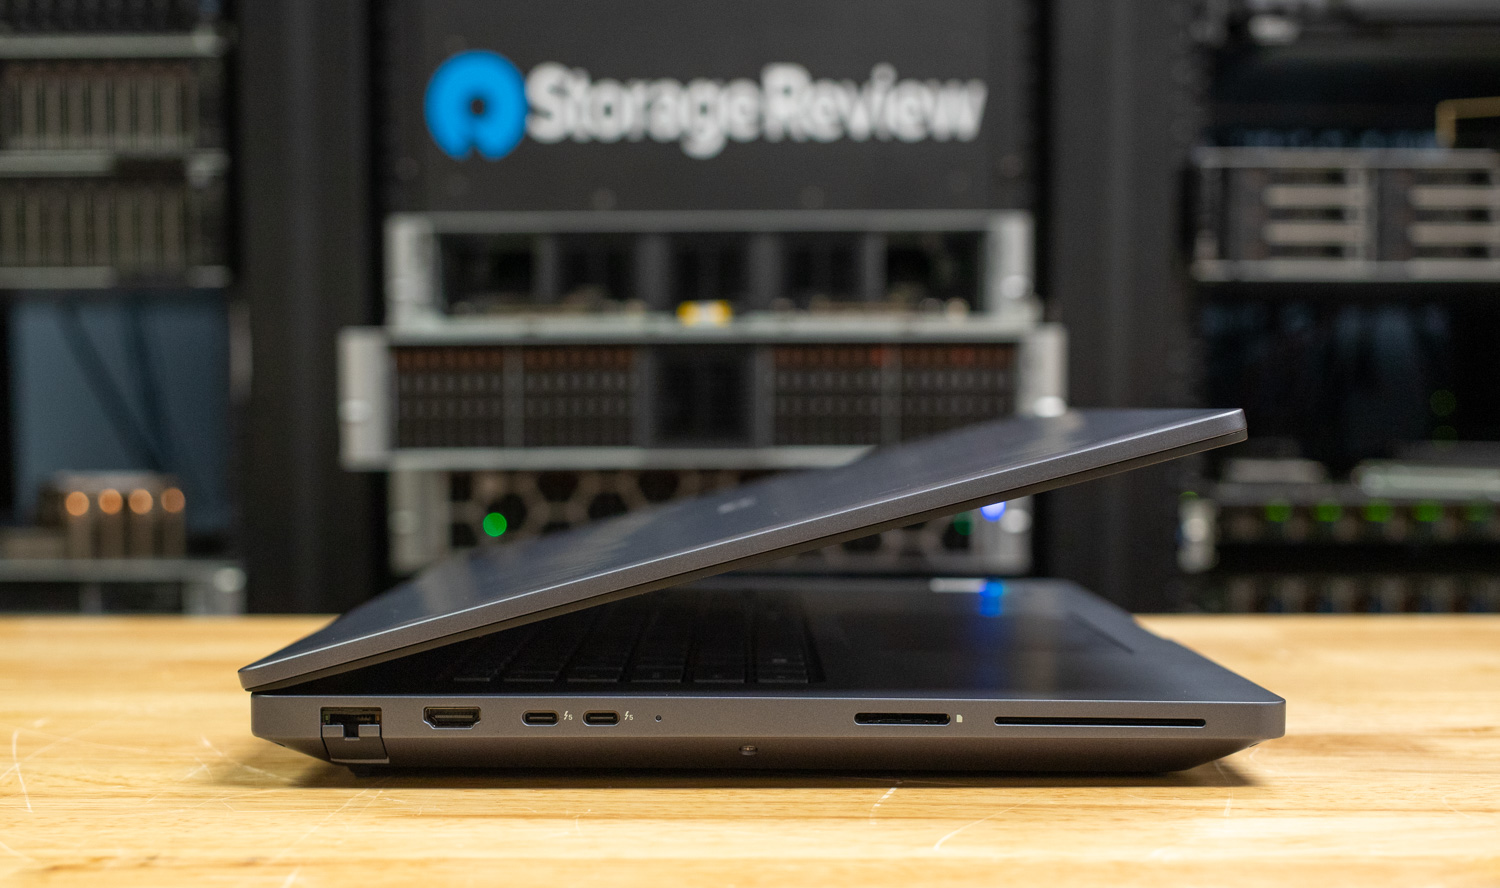
The left edge of the chassis integrates the majority of the high-speed I/O, including:
- RJ45 Ethernet port supporting up to 2.5 Gbps wired networking.
- HDMI 2.1 FRL port for external displays and TVs.
- Two Thunderbolt 5 ports (80 Gbps) with Power Delivery and DisplayPort 2.1 support, enabling connections to external GPUs, docks, or high-resolution monitors.
- Battery-status light, providing visual feedback on charging and critical power states.
- SD-card slot supporting SD, SDHC, and SDXC cards.
- Smart card reader slot for enterprise authentication.
Right Side
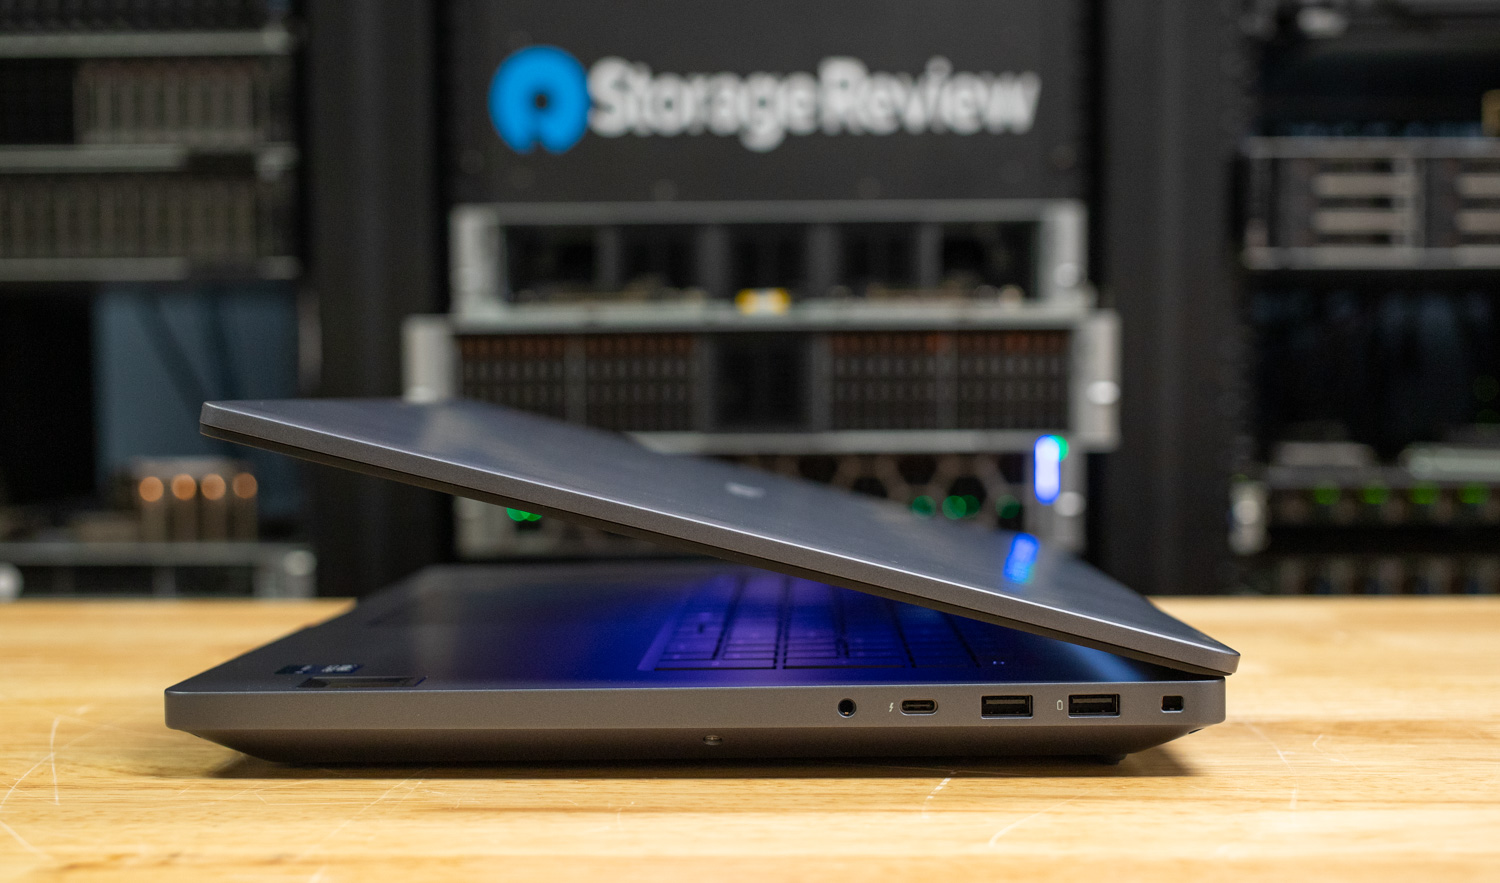
The right edge provides additional connectivity and legacy support, including:
- Headset jack (headphone/mic combo).
- One Thunderbolt 4 port (40 Gbps) with Power Delivery and DisplayPort 2.1.
- Two USB 3.2 Gen 1 ports, one with PowerShare functionality for charging devices while the system is off or asleep.
- Security-cable slot (Noble lock) for physical device protection.
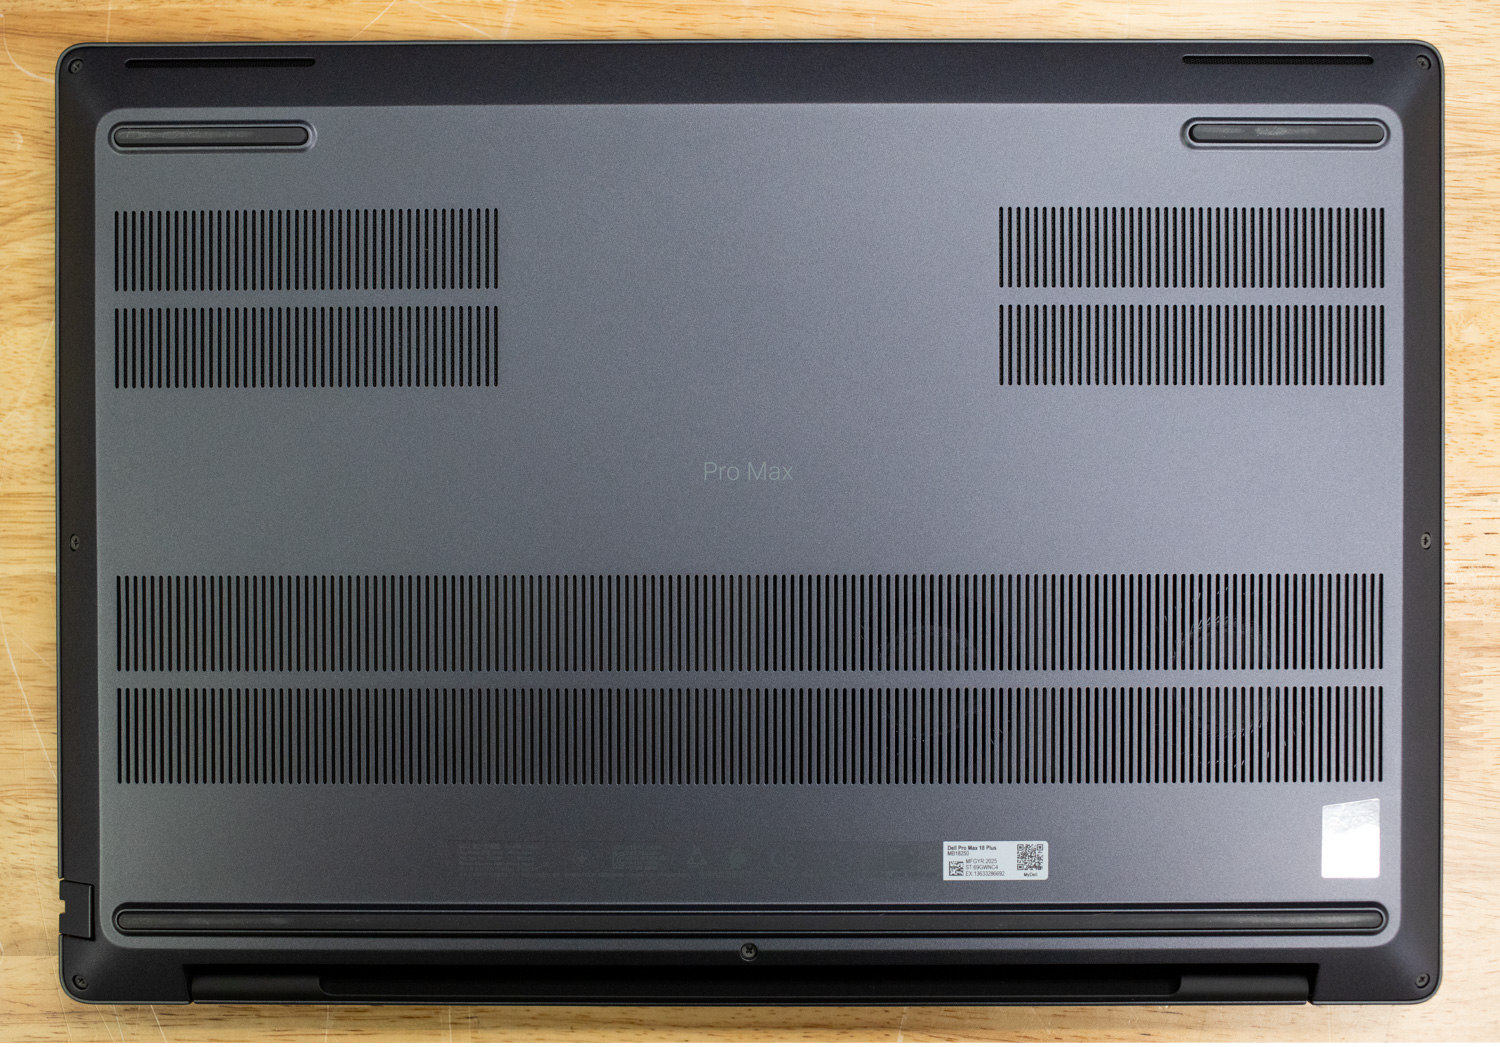
Bottom
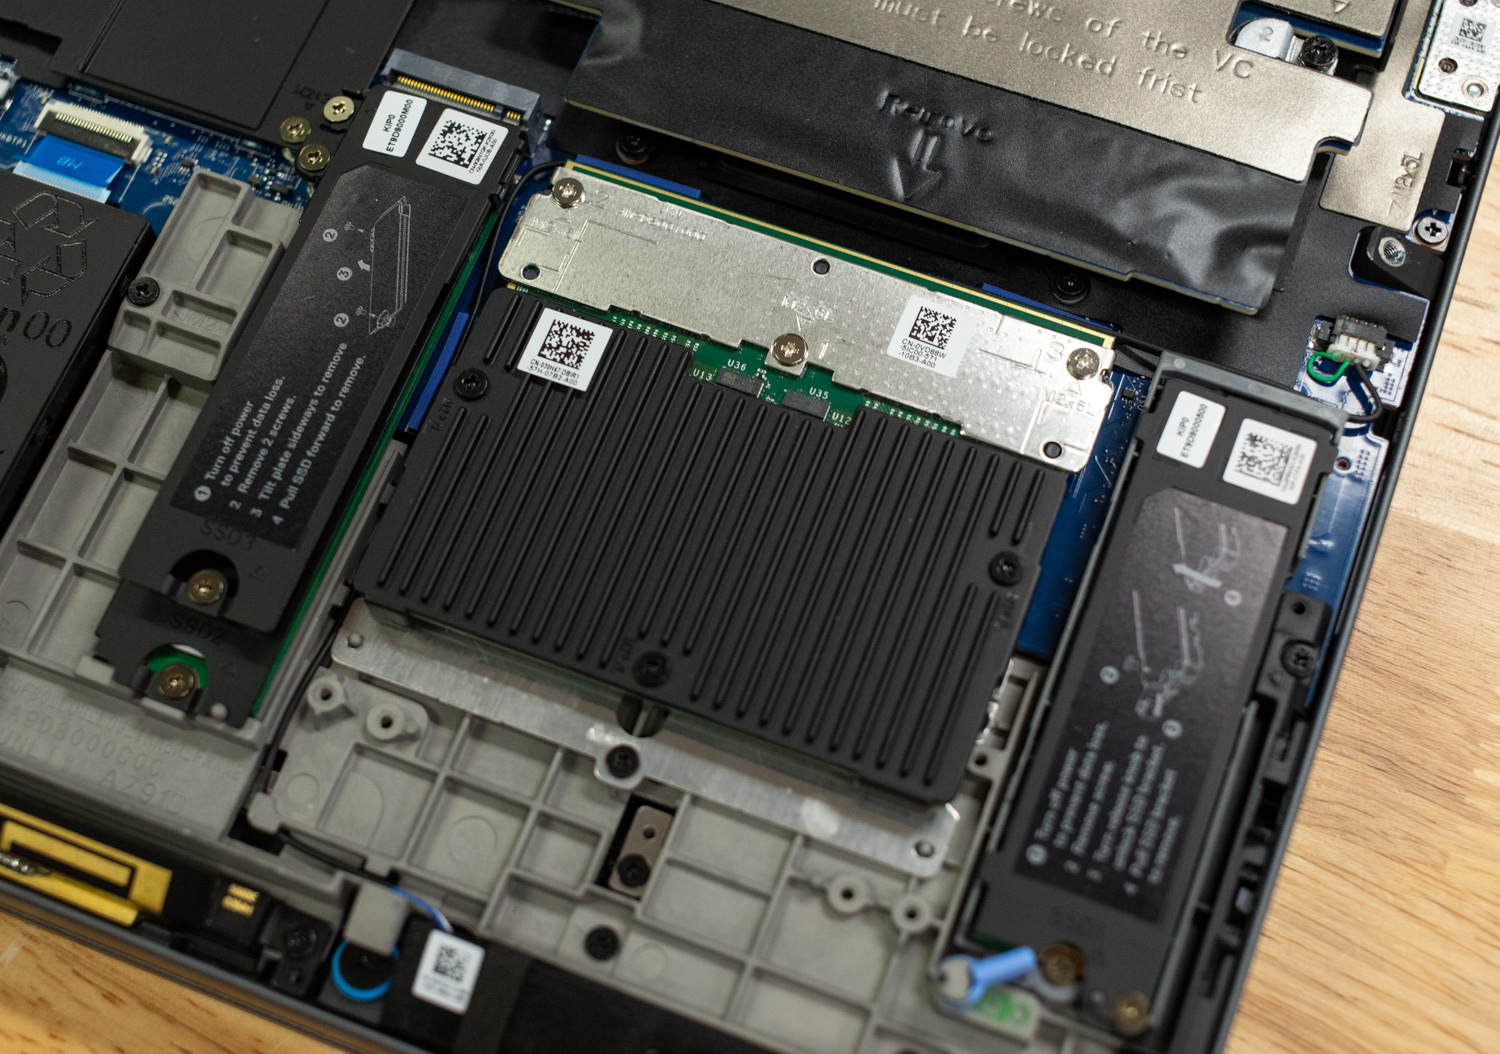
On the underside, Dell includes dual stereo speakers, delivering 4 W total output. Once opened, this panel provides access to critical internal components such as storage drives, the system battery, and other replaceable hardware, making upgrades and maintenance straightforward without requiring a full disassembly. Visible inside are four SSD slots, a WWAN card, a Wi-Fi card, and a 96 Wh battery. Cooling is handled by three fans working in tandem with a large heatsink array, providing substantial airflow and thermal capacity to keep the system’s GPU and CPU stable under heavy load.
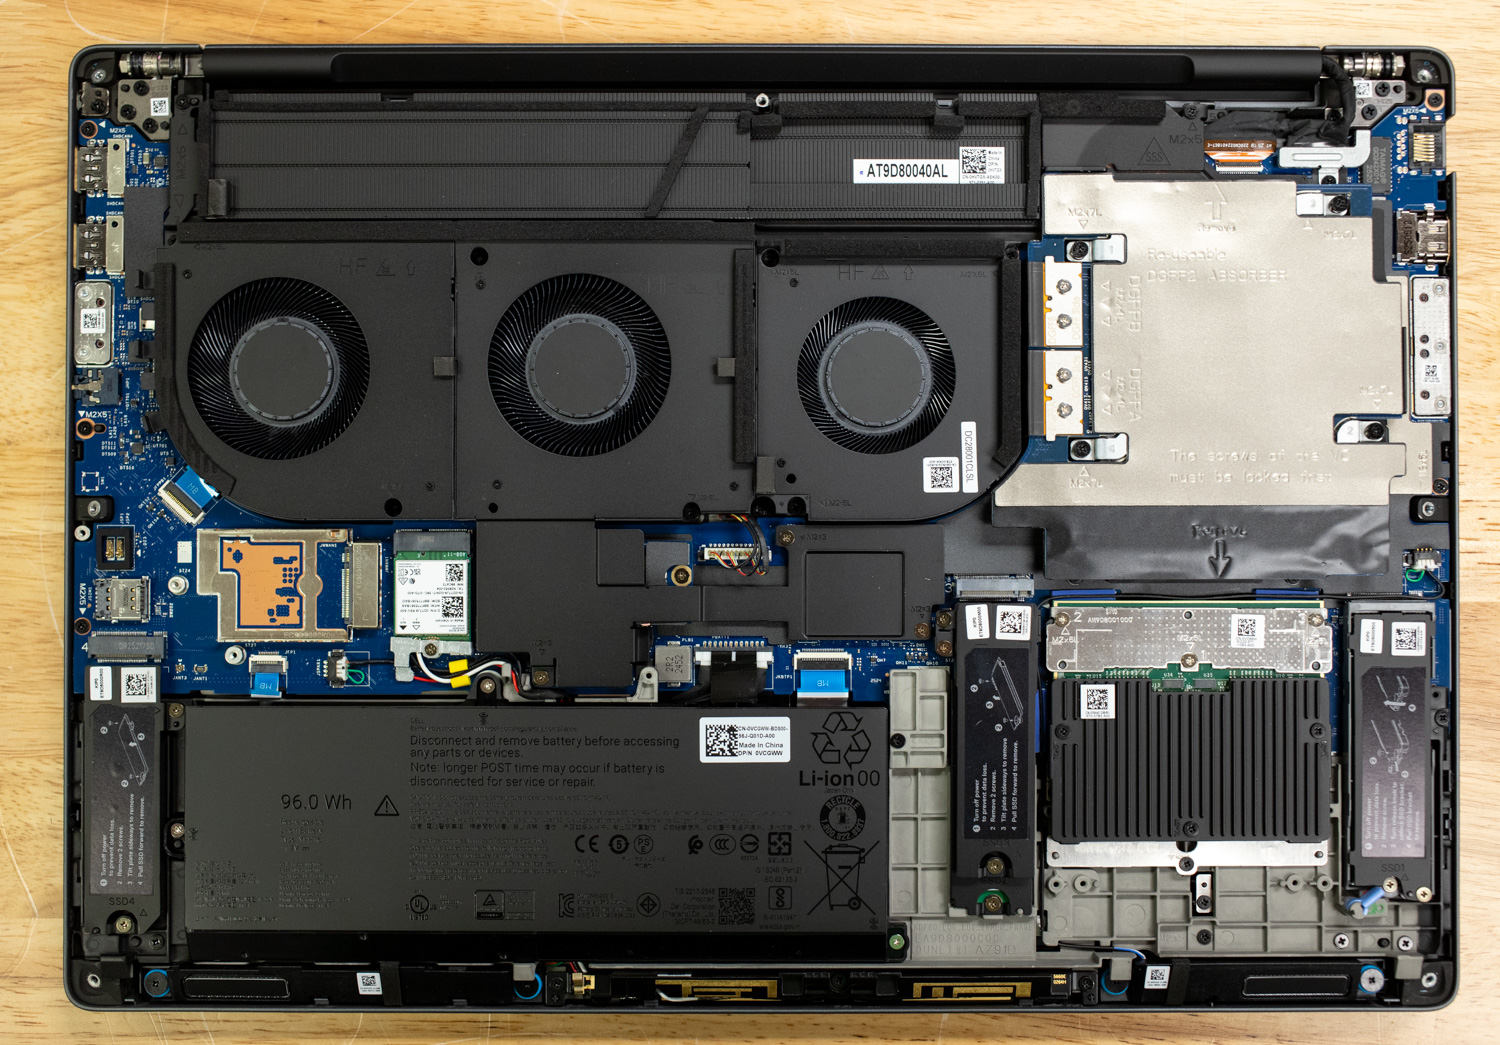
The Dell Pro Max 18 Plus we received is equipped with CAMM2 memory, configured as a single 128 GB module running at 6400 MT/s dual-channel. Dell offers CAMM2-based configurations starting at 64 GB and scaling up to 256 GB in a single-channel design, giving users a balance of high capacity and bandwidth in a compact form factor. The CAMM2 module is mounted with a dedicated heatsink for stability under sustained workloads, and its design allows for future upgrade flexibility without requiring multiple DIMM slots.
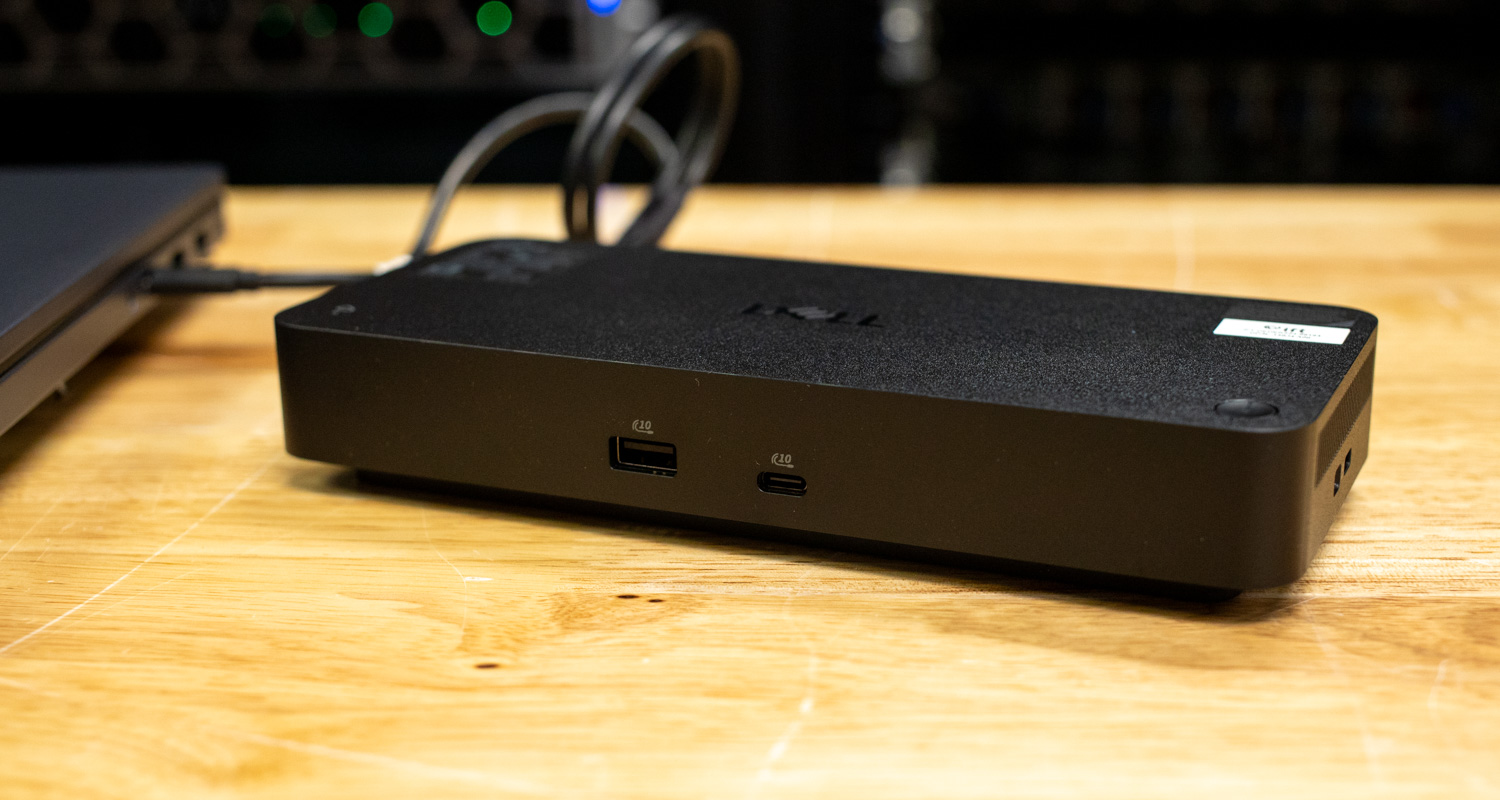
Dell Pro Thunderbolt 5 Smart Dock
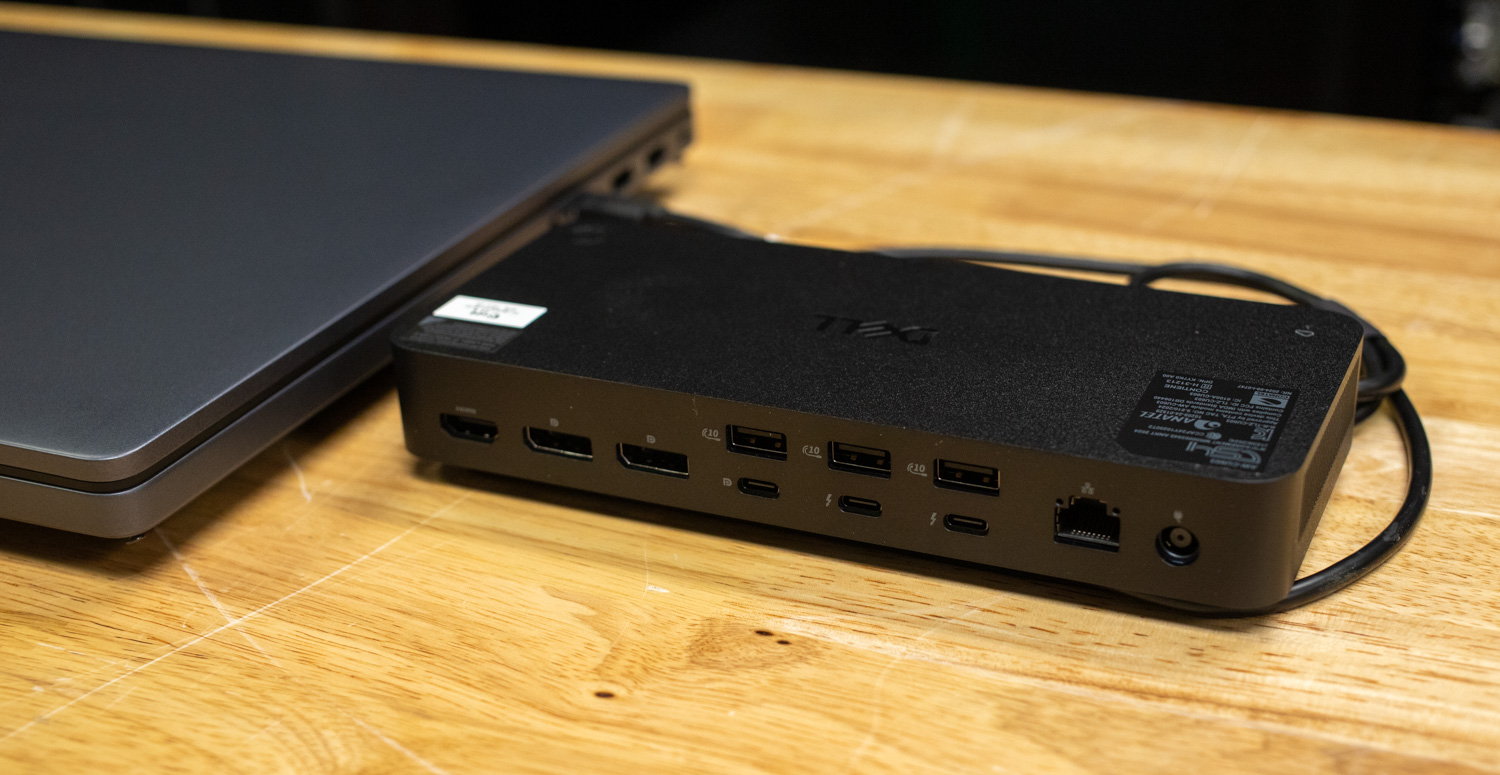
Dell also included us with the Pro Thunderbolt 5 Smart Dock (SD25TB5) with the Pro Max 18 Plus, a docking solution designed to handle the bandwidth and power needs of high-performance mobile workstations. Built on the Thunderbolt 5 interface, the dock provides extensive connectivity, including dual Thunderbolt 5 ports, dual DisplayPort 2.1 outputs, HDMI 2.1, a USB-C 3.2 Gen 2 multifunction port, four USB-A 3.2 Gen 2 ports with PowerShare, and 2.5 GbE networking. This combination enables simultaneous support for up to four 4K displays at 120 Hz or even a single 8K monitor with Display Stream Compression, while still leaving room for high-speed peripherals.
A major highlight is the dock’s 330W AC power brick, capable of delivering up to 300W of power to Dell commercial notebooks (240W for non-Dell systems). This ensures it fully supports the Pro Max 18 Plus, which ships with a 280W adapter, allowing a single cable to provide both system power and full I/O expansion. Beyond connectivity, the SD25TB5 integrates enterprise-grade manageability and security features, including remote firmware updates via the Dell Device Management Console, MAC address pass-through, PXE boot, and hardware-based encryption. Compact and durable at just 632 g, with ambidextrous USB-C cable routing and VESA mount options, the dock neatly complements the Pro Max 18 Plus as a single-cable solution for both performance and desk organization.
Dell Pro Max 18 Plus Performance Testing
Before we begin with the benchmarks, it is important to point out that the Dell Pro Max 18 Plus and the HP ZBook Fury G1i 18 are running the same core configuration, each equipped with the Intel Core Ultra 9 285HX processor paired with the NVIDIA RTX PRO 5000 GPU. This ensures that the comparison remains focused on platform-level performance rather than hardware differences in compute or graphics. The only areas where the two systems diverge are in memory and storage, with variations in installed RAM capacity and drive size that do not affect the overall comparability of CPU and GPU results.
While the CPU and GPU baselines are aligned, the memory and power envelopes reveal subtle but interesting differences in how each vendor approaches platform tuning. Dell configures its RTX PRO 5000 with a 175 W ceiling and a graphics clock of 1807 MHz, while HP sets the same GPU at a 150 W maximum TDP with a 1740 MHz clock. On the memory front, Dell leverages its 7200MT/s CAMM2 implementation at 6400 MT/s, whereas HP stays with more traditional 5600 MT/s SODIMM modules clocked at 4400 MT/s. These decisions highlight the diverging design philosophies.
System Configuration
- CPU: Intel Core Ultra 9 285HX (16 Cores, 24 Threads, 5.5 GHz Turbo, 55W)
- Memory: 128GB of CAMM2 6400MHz (1x128GB)
- GPU: NVIDIA RTX PRO 5000 Blackwell with 24GB GDDR7
- Storage: RAID 0 with 2 X 1TB Gen5 SSD
- Screen: 18″ QHD+ LCD 2560×1600
Procyon AI Computer Vision
The Procyon AI Computer Vision Benchmark measures AI inference performance across CPUs, GPUs, and dedicated accelerators using a range of state-of-the-art neural networks. It evaluates tasks such as image classification, object detection, segmentation, and super resolution with models including MobileNet V3, Inception V4, YOLO V3, DeepLab V3, Real ESRGAN, and ResNet 50. Tests are run on multiple inference engines, including NVIDIA TensorRT, Intel OpenVINO, Qualcomm SNPE, Microsoft Windows ML, and Apple Core ML, providing a broad view of hardware and software efficiency. Results are reported for both float and integer-optimized models, offering a consistent and practical measure of machine vision performance for professional workloads.
On the CPU, the Dell Pro Max 18 Plus achieved an overall score of 195 compared to 185 on the HP ZBook Fury G1i. Dell processed most models slightly faster, including ResNet 50 (6.98 ms vs. 7.46 ms), Inception V4 (19.53 ms vs. 20.47 ms), DeepLab V3 (24.15 ms vs. 25.74 ms), and YOLO V3 (44.53 ms vs. 45.50 ms). HP measured a small advantage in MobileNet V3 (0.94 ms vs. 1.00 ms), while Dell showed a larger gain in Real ESRGAN (1,934.18 ms vs. 2,281.80 ms), indicating stronger sustained performance in heavy workloads.
With integrated Intel ARC graphics, Dell recorded an overall score of 156, while HP measured 116. Dell consistently returned faster times across nearly every model, including ResNet 50 (8.86 ms vs. 13.00 ms), Inception V4 (22.71 ms vs. 30.54 ms), and YOLO V3 (54.03 ms vs. 127.34 ms). The results suggest that Dell’s integrated graphics delivered more stable performance for vision tasks, while both systems showed similar times in lighter workloads such as MobileNet V3.
| CPU Results (average time in ms) | Dell Pro Max 18 Plus (Intel Core Ultra 9 285HX)(NVIDIA RTX PRO 5000) | HP ZBook Fury G1i (Intel Core Ultra 9 285HX)(NVIDIA RTX PRO 5000) |
| AI Computer Vision Overall Score | 195 | 185 |
| MobileNet V3 | 1.00 ms | 0.94 ms |
| ResNet 50 | 6.98 ms | 7.46 ms |
| Inception V4 | 19.53 ms | 20.47 ms |
| DeepLab V3 | 24.15 ms | 25.74 ms |
| YOLO V3 | 44.53 ms | 45.50 ms |
| REAL-ESRGAN | 1,934.18 ms | 2,281.80 ms |
| CPU Integrated Graphics Results (average time in ms) | ||
| AI Computer Vision Overall Score | 156 | 116 |
| MobileNet V3 | 1.35 ms | 1.45 ms |
| ResNet 50 | 8.86 ms | 13.00 ms |
| Inception V4 | 22.71 ms | 30.54 ms |
| DeepLab V3 | 37.80 ms | 42.53 ms |
| YOLO V3 | 54.03 ms | 127.34 ms |
| REAL-ESRGAN | 1,878.42 ms | 1,980.22 ms |
Switching to the mobile platforms dedicated GPUs, Dell reached an overall score of 1,032, compared to 890 for HP. Dell measured lower average times in most tests, including ResNet 50 (1.20 ms vs. 1.54 ms), Inception V4 (3.00 ms vs. 4.11 ms), and YOLO V3 (5.63 ms vs. 6.78 ms). Performance was closer in MobileNet V3 (0.55 ms vs. 0.57 ms) and DeepLab V3 (13.05 ms vs. 12.78 ms), where HP had a slight edge. In the Real ESRGAN workload, Dell again produced faster results at 88.56 ms vs. 100.18 ms.
| GPU Results (average time in ms) | Dell Pro Max 18 Plus (Intel Core Ultra 9 285HX)(NVIDIA RTX PRO 5000) | HP ZBook Fury G1i (Intel Core Ultra 9 285HX)(NVIDIA RTX PRO 5000) |
| AI Computer Vision Overall Score | 1,032 | 890 |
| MobileNet V3 | 0.55 ms | 0.57 ms |
| ResNet 50 | 1.20 ms | 1.54 ms |
| Inception V4 | 3.00 ms | 4.11 ms |
| DeepLab V3 | 13.05 ms | 12.78 ms |
| YOLO V3 | 5.63 ms | 6.78 ms |
| REAL-ESRGAN | 88.56 ms | 100.18 ms |
When using NVIDIA TensorRT on the Nvidia RTX PRO 5000, Dell posted the highest overall score at 1,609, compared to 1,014 on HP. Dell delivered faster inference across all tested models, including MobileNet V3 (0.26 ms vs. 0.43 ms), ResNet 50 (0.98 ms vs. 1.69 ms), Inception V4 (3.01 ms vs. 5.26 ms), DeepLab V3 (3.97 ms vs. 5.89 ms), and YOLO V3 (3.22 ms vs. 5.76 ms). Even in the heavier Real ESRGAN task, Dell maintained lower times at 90.17 ms vs. 110.30 ms, showing stronger acceleration.
| TensorRT Results (average time in ms) | Dell Pro Max 18 Plus (Intel Core Ultra 9 285HX)(NVIDIA RTX PRO 5000) | HP ZBook Fury G1i (Intel Core Ultra 9 285HX)(NVIDIA RTX PRO 5000) |
| AI Computer Vision Overall Score | 1,609 | 1,014 |
| MobileNet V3 | 0.26 ms | 0.43 ms |
| ResNet 50 | 0.98 ms | 1.69 ms |
| Inception V4 | 3.01 ms | 5.26 ms |
| DeepLab V3 | 3.97 ms | 5.89 ms |
| YOLO V3 | 3.22 ms | 5.76 ms |
| REAL-ESRGAN | 90.17 ms | 110.30 ms |
UL Procyon: AI Text Generation
The Procyon AI Text Generation Benchmark streamlines AI LLM performance testing by providing a concise and consistent evaluation method. It allows for repeated testing across multiple LLM models while minimizing the complexity of large model sizes and variable factors. Developed with AI hardware leaders, it optimizes the use of local AI accelerators for more reliable and efficient performance assessments. The results measured below were tested using TensorRT.
In the UL Procyon AI Text Generation benchmark, the Dell Pro Max 18 Plus measured higher overall scores across all tested models. It reached 4,475 vs. 3,904 in Phi, 4,295 vs. 3,823 in Mistral, 3,763 vs. 3,418 in Llama3, and 4,155 vs. 3,711 in Llama2. These results indicate that Dell consistently provided stronger performance in AI text generation workloads compared to the HP ZBook Fury G1i.
| UL Procyon: AI Text Generation | Dell Pro Max 18 Plus (Intel Core Ultra 9 285HX)(NVIDIA RTX PRO 5000) | HP ZBook Fury G1i (Intel Core Ultra 9 285HX)(NVIDIA RTX PRO 5000) |
| Phi Overall Score | 4,475 | 3,904 |
| Phi Output Time To First Token | 0.237 s | 0.265 s |
| Phi Output Tokens Per Second | 185.118 tokens/s | 157.446 tokens/s |
| Phi Overall Duration | 16.314 s | 19.025 s |
| Mistral Overall Score | 4,295 | 3,823 |
| Mistral Output Time To First Token | 0.347 s | 0.379 s |
| Mistral Output Tokens Per Second | 140.546 tokens/s | 121.511 tokens/s |
| Mistral Overall Duration | 21.665 s | 24.843 s |
| Llama3 Overall Score | 3,763 | 3,418 |
| Llama3 Output Time To First Token | 0.344 s | 0.357 s |
| Llama3 Output Tokens Per Second | 119.741 tokens/s | 102.637 tokens/s |
| Llama3 Overall Duration | 25.165 s | 29.068 s |
| Llama2 Overall Score | 4,155 | 3,711 |
| Llama2 Output Time To First Token | 0.546 s | 0.566 s |
| Llama2 Output Tokens Per Second | 69.709 tokens/s | 57.620 tokens/s |
| Llama2 Overall Duration | 42.506 s | 50.608 s |
UL Procyon: AI Image Generation
The Procyon AI Image Generation Benchmark provides a consistent and accurate method for measuring AI inference performance across various hardware, ranging from low-power NPUs to high-end GPUs. It includes three tests: Stable Diffusion XL (FP16) for high-end GPUs, Stable Diffusion 1.5 (FP16) for moderately powerful GPUs, and Stable Diffusion 1.5 (INT8) for low-power devices. The benchmark uses the optimal inference engine for each system, ensuring fair and comparable results.
In the UL Procyon AI Image Generation benchmark, the Dell Pro Max 18 Plus produced higher results across all three Stable Diffusion tests. In Stable Diffusion 1.5 (FP16), Dell scored 3,687 with an image generation speed of 1.695 s/image, compared to HP’s 3,120 and 2.003 s/image. In the INT8 version of Stable Diffusion 1.5, Dell measured 44,101 with 0.709 s/image, while HP recorded 32,824 with 0.952 s/image. Finally, in Stable Diffusion XL (FP16), Dell reached a score of 3,170 and 11.829 s/image, ahead of HP at 2,701 and 13.883 s/image.
Both systems handled the workloads effectively, but Dell consistently generated images faster and with higher benchmark scores, particularly in the INT8 test where it showed a notable efficiency advantage.
| UL Procyon: AI Image Generation | Dell Pro Max 18 Plus (Intel Core Ultra 9 285HX)(NVIDIA RTX PRO 5000) | HP ZBook Fury G1i (Intel Core Ultra 9 285HX)(NVIDIA RTX PRO 5000) |
| Stable Diffusion 1.5 (FP16) – Overall Score | 3,687 | 3,120 |
| Stable Diffusion 1.5 (FP16) – Overall Time | 27.119 s | 32.043 s |
| Stable Diffusion 1.5 (FP16) – Image Generation Speed | 1.695 s/image | 2.003 s/image |
| Stable Diffusion 1.5 (INT8) – Overall Score | 44,101 | 32,824 |
| Stable Diffusion 1.5 (INT8) – Overall Time | 5.669 s | 7.616 s |
| Stable Diffusion 1.5 (INT8) – Image Generation Speed | 0.709 s/image | 0.952 s/image |
| Stable Diffusion XL (FP16) – Overall Score | 3,170 | 2,701 |
| Stable Diffusion XL (FP16) – Overall Time | 189.260 s | 222.133 s |
| Stable Diffusion XL (FP16) – Image Generation Speed | 11.829 s/image | 13.883 s/image |
SPECworkstation 4
The SPECworkstation 4.0 benchmark is a comprehensive tool for evaluating all key aspects of workstation performance. It offers a real-world measure of CPU, graphics, accelerator, and disk performance, ensuring professionals have the data to make informed decisions about their hardware investments. The benchmark includes a dedicated set of tests focusing on AI and ML workloads, including data science tasks and ONNX runtime-based inference tests, reflecting the growing importance of AI/ML in workstation environments. It encompasses seven industry verticals and four hardware subsystems, providing a detailed and relevant measure of the performance of today’s workstations.
In SPECworkstation 4.0, the Dell Pro Max 18 Plus recorded higher results in six of the seven industry verticals. It measured 2.48 in AI & Machine Learning compared to 2.26 on the HP ZBook Fury G1i, along with higher values in Energy (2.49 vs. 2.20), Financial Services (1.66 vs. 1.63), Media & Entertainment (2.66 vs. 2.51), Product Design (2.35 vs. 2.16), and Productivity & Development (1.35 vs. 1.19). The HP system measured higher in Life Sciences, reaching 2.46 compared to 1.50 on the Dell.
| SPECworkstation 4.0.0 (higher is better) | Dell Pro Max 18 Plus (Intel Core Ultra 9 285HX)(NVIDIA RTX PRO 5000) | HP ZBook Fury G1i (Intel Core Ultra 9 285HX)(NVIDIA RTX PRO 5000) |
| AI & Machine Learning | 2.48 | 2.26 |
| Energy | 2.49 | 2.20 |
| Financial Services | 1.66 | 1.63 |
| Life Sciences | 1.50 | 2.46 |
| Media & Entertainment | 2.66 | 2.51 |
| Product Design | 2.35 | 2.16 |
| Productivity & Development | 1.35 | 1.19 |
SPECviewperf 15
SPECviewperf 15 is the industry-standard benchmark for evaluating 3D graphics performance across OpenGL, DirectX, and Vulkan APIs. It introduces new workloads such as blender-01 (Blender 3.6), unreal_engine-01 (Unreal Engine 5.4, DirectX 12), and enscape-01 (Enscape 4.0, Vulkan ray tracing), along with updated traces for 3ds Max, CATIA, Creo, Maya, and Solidworks. With its redesigned GUI, modern application support, and advanced rendering workloads, SPECviewperf 15 provides consistent, real-world insights into professional graphics performance.
In SPECviewperf 15, the Dell Pro Max 18 Plus consistently led across all workloads compared to the HP ZBook Fury G1i, despite both systems featuring the same Intel Core Ultra 9 285HX CPU and NVIDIA RTX PRO 5000 GPU. Dell posted higher scores in every test, including 3dsmax-08 (98.71 vs. 87.03, 13.4% faster), blender-01 (83.23 vs. 78.03, 6.7% faster), catia-07 (113.18 vs. 100.55, 12.6% faster), creo-04 (247.79 vs. 238.38, 3.9% faster), energy-04 (170.27 vs. 153.43, 11% faster), enscape-01 (86.70 vs. 77.57, 11.8% faster), maya-07 (232.48 vs. 217.67, 6.8% faster), medical-04 (210.51 vs. 183.39, 14.8% faster), solidworks-08 (145.56 vs. 110.66, 31.5% faster), and unreal_engine-01 (93.46 vs. 79.85, 17.1% faster).
Overall, Dell showed stronger and more consistent graphics performance, with particularly large gains in Solidworks, Medical, and Unreal Engine workloads, making it the better option for demanding professional 3D workflows.
| SPECviewperf (higher is better) | Dell Pro Max 18 Plus (Intel Core Ultra 9 285HX)(NVIDIA RTX PRO 5000) | HP ZBook Fury G1i (Intel Core Ultra 9 285HX)(NVIDIA RTX PRO 5000) |
| 3dsmax-08 | 98.71 | 87.03 |
| blender-01 | 83.23 | 78.03 |
| catia-07 | 113.18 | 100.55 |
| creo-04 | 247.79 | 238.38 |
| energy-04 | 170.27 | 153.43 |
| enscape-01 | 86.70 | 77.57 |
| maya-07 | 232.48 | 217.67 |
| medical-04 | 210.51 | 183.39 |
| solidworks-08 | 145.56 | 110.66 |
| unreal_engine-01 | 93.46 | 79.85 |
LuxMark
LuxMark is a GPU benchmark that utilizes LuxRender, an open-source ray-tracing renderer, to evaluate a system’s performance in handling highly detailed 3D scenes. This benchmark is relevant for assessing the graphical rendering capabilities of servers and workstations, especially for visual effects and architectural visualization applications, where accurate light simulation is crucial.
In the LuxMark benchmark, the Dell Pro Max 18 Plus measured higher scores in both test scenes. In Hallbench, Dell reached 29,605 compared to 26,594 for the HP ZBook Fury G1i, a difference of about 11.3%. In the more complex Food scene, Dell scored 13,042 while HP recorded 11,500, giving Dell a 13.4% advantage.
| LuxMark (higher is better) | Dell Pro Max 18 Plus (Intel Core Ultra 9 285HX)(NVIDIA RTX PRO 5000) | HP ZBook Fury G1i (Intel Core Ultra 9 285HX)(NVIDIA RTX PRO 5000) |
| Hallbench | 29,605 | 26,594 |
| Food | 13,042 | 11,500 |
7-Zip Compression
The 7-Zip Compression Benchmark evaluates CPU performance during compression and decompression tasks, measuring ratings in GIPS (Giga Instructions Per Second) and CPU usage. Higher GIPS and efficient CPU usage indicate superior performance.
In the 7-Zip Compression Benchmark, the Dell Pro Max 18 Plus recorded higher results in both compression and decompression tests. For compression, Dell measured a resulting rating of 137.459 GIPS, compared to 102.012 GIPS on the HP ZBook Fury G1i, giving Dell about a 34.7% advantage. In decompression, Dell reached 163.149 GIPS while HP measured 146.208 GIPS, a 11.6% advantage. Looking at the total resulting rating, Dell posted 150.304 GIPS against HP’s 124.110 GIPS, reflecting a 21.1% higher overall score.
| 7-Zip Compression Benchmark (higher is Better) | Dell Pro Max 18 Plus (Intel Core Ultra 9 285HX)(NVIDIA RTX PRO 5000) | HP ZBook Fury G1i (Intel Core Ultra 9 285HX)(NVIDIA RTX PRO 5000) | |||
| Compression | |||||
| Current CPU Usage | 1,905% | 1,796% | |||
| Current Rating/Usage | 7.275 GIPS | 5.692 GIPS | |||
| Current Rating | 138.244 GIPS | 102.234 GIPS | |||
| Resulting CPU Usage | 1,891% | 1,780% | |||
| Resulting Rating/Usage | 7.270 GIPS | 5.731 GIPS | |||
| Resulting Rating | 137.459 GIPS | 102.012 GIPS | |||
| Decompression | |||||
| Current CPU Usage | 2,226% | 2,208% | |||
| Current Rating/Usage | 7.175 GIPS | 6.411 GIPS | |||
| Current Rating | 159.735 GIPS | 141.545 GIPS | |||
| Resulting CPU Usage | 2,242% | 2,213% | |||
| Resulting Rating/Usage | 7.276 GIPS | 6.608 GIPS | |||
| Resulting Rating | 163.149 GIPS | 146.208 GIPS | |||
| Total Rating | |||||
| Total CPU Usage | 2,067% | 1,997% | |||
| Total Rating/Usage | 7.273 GIPS | 6.170 GIPS | |||
| Total Rating | 150.304 GIPS | 124.110 GIPS | |||
Blackmagic RAW Speed Test
The Blackmagic RAW Speed Test is a performance benchmarking tool that measures a system’s capabilities for handling video playback and editing using the Blackmagic RAW codec. It evaluates how well a system can decode and play back high-resolution video files, providing frame rates for both CPU- and GPU-based processing.
In the Blackmagic RAW Speed Test, results were mixed between the two systems. On the CPU side, the Dell Pro Max 18 Plus processed 8K video at 128 fps, ahead of the HP ZBook Fury G1i at 112 fps, giving Dell about a 14% advantage in CPU-based decoding. However, when shifting to GPU acceleration with OpenCL, the HP took the lead, reaching 182 fps compared to 168 fps on the Dell, a 8.3% advantage.
| Blackmagic RAW Speed Test | Dell Pro Max 18 Plus (Intel Core Ultra 9 285HX)(NVIDIA RTX PRO 5000) | HP ZBook Fury G1i (Intel Core Ultra 9 285HX)(NVIDIA RTX PRO 5000) |
|---|---|---|
| 8K CPU | 128 | 112 |
| 8K OPENCL | 168 | 182 |
Blackmagic Disk Speed Test
The Blackmagic Disk Speed Test evaluates storage performance by measuring read and write speeds, providing insights into a system’s ability to handle data-intensive tasks, such as video editing and large file transfers.
In the Blackmagic Disk Speed Test, the Dell Pro Max 18 Plus delivered 7,776.1 MB/s read and 6,022.0 MB/s write, outpacing the HP ZBook Fury G1i at 6,554.2 MB/s read and 5,728.0 MB/s write. That works out to about an 18.6% faster read speed and a 5.1% faster write speed for the Dell, giving it the stronger edge in handling large file transfers and demanding storage workloads. Both systems support Gen 5 M.2 SSDs, so performance will ultimately depend on the specific drives configured in each unit.
| Disk Speed Test (higher is better) | Dell Pro Max 18 Plus (Intel Core Ultra 9 285HX)(NVIDIA RTX PRO 5000) | HP ZBook Fury G1i (Intel Core Ultra 9 285HX)(NVIDIA RTX PRO 5000) |
| Read | 7,776.1 MB/s | 6,554.2 MB/s |
| Write | 6,022.0 MB/s | 5,728.0 MB/s |
Blender 4.5
Blender is an open-source 3D modeling application. This benchmark was run using the Blender Benchmark utility. The score is measured in samples per minute, with higher values indicating better performance.
In Blender CPU testing, despite both systems using the same Intel Core Ultra 9 285HX processor, the Dell Pro Max 18 Plus outpaced the HP ZBook Fury G1i in two of the three workloads. Dell scored 237.1 vs. 203.91 in Monster (a 16.3% lead) and 150.7 vs. 132.23 in Junkshop (a 14% lead). In the more demanding Classroom scene, Dell also maintained a smaller but measurable edge at 94.5 vs. 88, giving it a consistent advantage across the board. These results highlight how scene complexity and optimization can impact relative CPU performance, even on identical hardware.
| Blender CPU (samples per minute, higher is better) | Dell Pro Max 18 Plus (Intel Core Ultra 9 285HX)(NVIDIA RTX PRO 5000) | HP ZBook Fury G1i (Intel Core Ultra 9 285HX)(NVIDIA RTX PRO 5000) |
| Monster | 237.1 | 203.91 |
| Junkshop | 150.7 | 132.23 |
| Classroom | 94.5 | 88.19 |
When shifting to Blender GPU rendering with the NVIDIA RTX PRO 5000, the Dell Pro Max 18 Plus held consistent leads across all three workloads. Dell scored 3,928.6 vs. 3,710.99 in Monster (a 5.9% lead), 2,150.1 vs. 2,056.19 in Junkshop (a 4.6% lead), and 2,010.2 vs. 1,888.38 in Classroom (a 6.5% lead). These results show the Dell providing stronger, steady GPU rendering throughput, making it the better choice for GPU-accelerated Blender workflows.
| Blender GPU (samples per minute, higher is better) | Dell Pro Max 18 Plus (Intel Core Ultra 9 285HX)(NVIDIA RTX PRO 5000) | HP ZBook Fury G1i (Intel Core Ultra 9 285HX)(NVIDIA RTX PRO 5000) |
| Monster | 3,928.6 | 3,710.99 |
| Junkshop | 2150.1 | 2056.19 |
| Classroom | 2010.2 | 1,888.38 |
y-cruncher
y-cruncher is a multithreaded and scalable program that can compute Pi and other mathematical constants to trillions of digits. Since its launch in 2009, it has become a popular benchmarking and stress-testing application for overclockers and hardware enthusiasts.
When looking at y-cruncher scores, even though both systems use the same Intel Core Ultra 9 285HX processor, the Dell Pro Max 18 Plus completed every y-cruncher test faster than the HP ZBook Fury G1i. At 1 billion digits, Dell finished in 20.081 seconds compared to 22.042 seconds for HP, about 9% quicker. At higher workloads the advantage grew, with Dell completing 10 billion digits in 311.805 seconds versus 359.489 seconds for HP, a 13% improvement. This shows that while the CPU is identical, system-level differences such as cooling, power tuning, or memory configuration give the Dell an edge in sustained multithreaded workloads.
| Y-Cruncher (Total Computation Time) | Dell Pro Max 18 Plus (Intel Core Ultra 9 285HX)(NVIDIA RTX PRO 5000) | HP ZBook Fury G1i (Intel Core Ultra 9 285HX)(NVIDIA RTX PRO 5000) |
|---|---|---|
| 1 Billion | 20.081 s | 22.042 s |
| 2.5 Billion | 59.228 s | 64.911 s |
| 5 Billion | 142.822 s | 161.295 s |
| 10 Billion | 311.805 s | 359.489 s |
Geekbench 6
Geekbench 6 is a cross-platform benchmark that measures overall system performance.
In Geekbench 6, the HP ZBook Fury G1i edged out the Dell Pro Max 18 Plus in single-core performance with a score of 3,010 vs. 2,977, a difference of about 1.1%. The Dell, however, showed a stronger lead in multi-core performance, scoring 20,717 compared to 18,694 for the HP, a 10.8% advantage. GPU performance was an even bigger differentiator, with the Dell reaching 240,530 in OpenCL against the HP’s 194,740, giving the Dell a 23.5% lead. These results highlight the Dell as the stronger choice for heavy multi-core workloads and GPU-accelerated tasks, while the HP holds a small edge in single-thread efficiency.
| Geekbench 6 (higher is better) | Dell Pro Max 18 Plus (Intel Core Ultra 9 285HX)(NVIDIA RTX PRO 5000) | HP ZBook Fury G1i (Intel Core Ultra 9 285HX)(NVIDIA RTX PRO 5000) |
|---|---|---|
| CPU Single-Core | 2,977 | 3,010 |
| CPU Multi-Core | 20,717 | 18,694 |
| GPU OpenCL | 240,530 | 194,740 |
V-Ray
The V-Ray Benchmark measures rendering performance for CPUs, NVIDIA GPUs, or both using advanced V-Ray 6 engines. It uses quick tests and a simple scoring system to let users evaluate and compare their systems’ rendering capabilities. It’s an essential tool for professionals seeking efficient performance insights.
When looking at GPU performance in the V-Ray Benchmark, the Dell Pro Max 18 Plus scored 8,191, leading the HP ZBook Fury G1i at 7,820. This represents about a 4.7% advantage for the Dell, showing that its RTX PRO 5000 GPU delivered stronger rendering throughput. For professionals relying on GPU-accelerated rendering, the Dell holds a modest but meaningful edge in this workload.
| Vray (higher is better) | Dell Pro Max 18 Plus (Intel Core Ultra 9 285HX)(NVIDIA RTX PRO 5000) | HP ZBook Fury G1i (Intel Core Ultra 9 285HX)(NVIDIA RTX PRO 5000) |
|---|---|---|
| Score | 8,191 | 7,820 |
Topaz Video AI
Topaz Video AI is a professional application for enhancing and restoring video using advanced AI models. It supports tasks such as upscaling footage to 4K or 8K, sharpening blurry content, reducing noise, improving facial details, colorizing black-and-white footage, and interpolating frames for smoother motion. The suite includes an onboard benchmark that measures system performance across its different video-enhancing algorithms, giving a clear view of how well hardware platforms handle demanding AI video processing workloads.
In testing, the Dell Pro Max 18 Plus consistently produced higher frame rates across nearly every model compared to the HP ZBook Fury G1i, despite both systems using the same Intel Core Ultra 9 285HX processor and NVIDIA RTX PRO 5000 GPU. For example, Dell reached 31.10 fps vs. 25.22 fps in Artemis (1X), 38.53 fps vs. 27.18 fps in Gaia (1X), and 43.90 fps vs. 38.21 fps in APFast. Performance was close in smaller models such as Hyperion HDR (19.39 fps vs. 18.76 fps) and Rhea (4X) where Dell scored 3.20 fps vs. 2.81 fps.
| Topaz Video AI Benchmark (Frames per second, higher is better) | Dell Pro Max 18 Plus (Intel Core Ultra 9 285HX)(NVIDIA RTX PRO 5000) | HP ZBook Fury G1i (Intel Core Ultra 9 285HX)(NVIDIA RTX PRO 5000) | ||||
|---|---|---|---|---|---|---|
| Model | 1X | 2X | 4X | 1X | 2X | 4X |
| Artemis | 31.10 | 16.94 | 4.22 | 25.22 | 10.87 | 3.42 |
| Iris | 27.77 | 16.07 | 4.16 | 23.31 | 12.85 | 3.43 |
| Proteus | 28.56 | 18.70 | 4.70 | 24.45 | 13.22 | 3.68 |
| Gaia | 38.53 | 5.88 | 4.27 | 27.18 | 5.06 | 3.21 |
| Nyx | 0.86 | – | – | 0.78 | – | – |
| Nyx Fast | 19.64 | – | – | 17.39 | – | – |
| Rhea | – | – | 3.20 | – | – | 2.81 |
| RXL | – | – | 3.06 | – | – | 2.74 |
| Hyperion HDR | 19.39 | – | – | 18.76 | – | – |
| Apollo | 33.49 | – | – | 28.35 | – | – |
| Aion | 25.06 | – | – | 22.73 | – | – |
| APFast | 43.90 | – | – | 38.21 | – | – |
| Chronos | 20.43 | – | – | 18.25 | – | – |
| CHFast | 30.88 | – | – | 26.17 | – | – |
PCMark 10
PCMark 10 is an industry-standard benchmark designed to measure complete system performance for modern office environments. It features updated workloads for Windows 10 and evaluates everyday tasks such as productivity, web browsing, video conferencing, and content creation. The benchmark is easy to run, delivers multi-level scoring (from high-level overall to detailed workload scores), and includes dedicated battery life and storage tests. While UL Solutions now recommends Procyon for newer, application-based testing, PCMark 10 remains a reliable and widely-used tool for assessing general PC performance.
In PCMark 10, the Dell Pro Max 18 Plus scored 8,581, while the HP ZBook Fury G1i reached 8,667. That works out to a difference of about 1.0% in favor of the HP, showing that both systems perform nearly the same in everyday office workloads.
| Pcmark 10 (higher is better) | Dell Pro Max 18 Plus (Intel Core Ultra 9 285HX)(NVIDIA RTX PRO 5000) | HP ZBook Fury G1i (Intel Core Ultra 9 285HX)(NVIDIA RTX PRO 5000) |
|---|---|---|
| Score | 8,581 | 8,667 |
3DMark CPU
The 3DMark CPU Profile evaluates processor performance across six threading levels: 1, 2, 4, 8, 16, and max threads. Each test runs the same boid-based simulation workload to assess how well the CPU scales under different thread counts, with minimal GPU involvement. The benchmark helps identify single-thread efficiency as well as multithreaded potential for tasks like gaming, content creation, and rendering. Scores at eight threads often align with modern DirectX 12 gaming performance, while 1–4 thread results reflect older or esports game scenarios
In the 3DMark CPU Profile, the Dell Pro Max 18 Plus reached 16,497 at max threads and 7,658 at eight threads, while the HP ZBook Fury G1i scored 16,297 and 7,275 in the same tests. At lighter loads, the HP held small leads with 4,865 at four threads, 2,476 at two threads, and 1,264 at one thread, compared to the Dell at 4,583, 2,435, and 1,234. These results show that both systems delivered very close scores overall, with the Dell slightly stronger under heavier threading and the HP pulling ahead in lighter workloads.
| 3DMark CPU Profile (higher is better) | Dell Pro Max 18 Plus (Intel Core Ultra 9 285HX)(NVIDIA RTX PRO 5000) | HP ZBook Fury G1i (Intel Core Ultra 9 285HX)(NVIDIA RTX PRO 5000) |
|---|---|---|
| Max Threads | 16,497 | 16,297 |
| 16 Threads | 13,224 | 13,868 |
| 8 Threads | 7,658 | 7,275 |
| 4 threads | 4,583 | 4,865 |
| 2 threads | 2,435 | 2,476 |
| 1 threads | 1,234 | 1,264 |
3DMark Storage
The 3DMark Storage Benchmark tests your SSD’s gaming performance by measuring tasks like loading games, saving progress, installing game files, and recording gameplay. It evaluates how well your storage handles real-world gaming activities and supports the latest storage technologies for accurate performance insights.
In the 3DMark Storage Benchmark, the Dell Pro Max 18 Plus achieved a score of 2,368, just edging out the HP ZBook Fury G1i at 2,304. That’s about a 2.8% performance advantage for the Dell, reflecting slightly faster handling of gaming-related storage tasks like loading and saving.
| 3DMark Storage (higher is better) | Dell Pro Max 18 Plus (Intel Core Ultra 9 285HX)(NVIDIA RTX PRO 5000) | HP ZBook Fury G1i (Intel Core Ultra 9 285HX)(NVIDIA RTX PRO 5000) |
|---|---|---|
| Score | 2,368 | 2,304 |
PCMark battery
To measure the battery life of mobile systems, we leverage PCMark 10. It includes a Modern Office benchmark, providing a realistic assessment of battery life during typical workday tasks. It simulates everyday office activities, such as writing documents, browsing the web, and participating in video conferences, with built-in periods of inactivity to mirror how people use their laptops. This isn’t just about peak performance; it focuses on sustained usage under a moderate workload. It is helpful for understanding how long you can expect a laptop to last through a day of office work.
The test operates in 10-minute cycles, balancing active tasks with periods of inactivity. Specifically, the Writing and Web Browsing workloads involve roughly 4.5 minutes of activity followed by 5.5 minutes of inactivity, while Video Conferencing is lighter, at 2 minutes of busy time and 8 minutes of idle time. This approach aims to provide a more accurate representation of real-world battery drain than running demanding tasks continuously, giving you a better idea of longevity for everyday productivity.
In our battery testing, the HP ZBook Fury G1i lasted longer, reaching 4 hours and 48 minutes compared to the Dell Pro Max 18 Plus at 3 hours and 39 minutes. However, it’s worth noting that the Dell consistently showed higher performance across the majority of our benchmark tests, trading some efficiency for raw power. This positions the Dell as the stronger choice for users prioritizing maximum performance, while the HP may appeal more to those needing extended mobility.
| Pcmark Battery (higher is better) | Dell Pro Max 18 Plus (Intel Core Ultra 9 285HX)(NVIDIA RTX PRO 5000) | HP ZBook Fury G1i (Intel Core Ultra 9 285HX)(NVIDIA RTX PRO 5000) |
|---|---|---|
| Time Elapsed | 3 Hr 39 Min | 4 Hr 48 Min |
Conclusion
The Dell Pro Max 18 Plus is a purpose-built system for professionals who demand uncompromising portable performance. When we looked at benchmarking, it consistently delivered stronger results than a comparable HP ZBook Fury G1i across GPU rendering, AI inference, and multi-threaded CPU workloads, while pairing that raw performance with enterprise essentials like Intel vPro manageability and ISV certifications. This is not a system designed for casual use, it is for engineers, creators, and analysts whose work requires accuracy, reliability, and stability in every calculation and render. That is why Dell outfits the platform with workstation-class RTX PRO GPUs running certified drivers, CAMM2 memory configurations up to 256GB, Gen5 SSDs, and support for up to four M.2 drives. These are the kinds of components meant to handle CAD, simulation, medical imaging, and other mission-critical applications where mistakes are unacceptable.
At over seven pounds with modest battery life, mobility is relative but that is not the point. The Pro Max 18 Plus is about delivering tower-class capability in a form you can still move between the office, lab, or job site. The cost is steep, with our fully configured unit priced at $9,245.52, but most units will ship through enterprise channels where volume discounts soften the blow. Combined with Dell’s three-year Next Business Day onsite support, the platform reflects Dell’s intent to give businesses a mobile workstation that can be trusted for years of service.
For professionals seeking the ultimate balance of portability and uncompromising workstation power, the Dell Pro Max 18 Plus stands at the top of Dell’s commercial lineup, setting a new bar for mobile performance and reliability.


 Amazon