

The SSD 710 is Intel’s first enterprise-class SSD in quite some time – it’s been three years since they introduced their last one, the X-25E. Packed with more cost effective eMLC instead of SLC NAND, the SSD 710 gives enterprise buyers a mix of endurance and increased capacity at a more aggressive price point than SLC alternatives. To expand on our single 710 drive review, we take a look at the 710 in RAID 1 and RAID 5 configurations as well as steady state variations to find out how it performs in an enterprise environment.
We reviewed the SSD 710 in a single drive configuration back in September, but as we mentioned at the start of that review, it would be a two part series covering RAID and Enterprise testing as well. Its performance wasn’t impressive when you looked at it in burst performance against consumer SSDs, but when it comes to enterprise usage, what matters is 24/7 performance over a number of years. To that end you’ll see our normal enterprise steady state benchmarks, along with a new over provisioned steady state benchmark.
The combination of performance and endurance the enterprise needs is no easy feat; Intel uses higher-grade MLC NAND memory and over-provisioning to achieve it and with an enhanced power protection from a slew of capacitors, vastly reduce the likelihood of data corruption in a power interruption.
In our RAID-oriented review of the Intel 710 SSD, we’ll be taking a look at the drive in two different configurations:
- RAID 1 (two drives)
- RAID 5 (three drives)
We tested these drives through our LSI MegaRAID 9260-8i, with each RAID configuration setup with a 128K stripe, write-back enabled, and drive cached enabled. For our steady state benchmarks we used a LSI SAS 9211-8i HBA, working with the drive in an unformatted state.
Synthetic Benchmarks
Going from our original review of the Intel SSD 710 where we looked at the single-drive performance, we measured an average sequential read speed of 277MB/s read and 216MB/s write through our LSI 9260-8i MegaRAID card. While not the fastest drive on the block, the speeds were plenty reasonable for a reliable server SSD. Looking to speed things up a bit though we wanted to see how this drive performed in both a two drive RAID1 configuration as well as a three drive RAID5 array.
The RAID5 array won out with a sustained read speed of 589MB/s and a sustained write speed of 423MB/s. The RAID1 setup came up roughly half of that, with speeds measuring 284MB/s read and 197MB/s write.
Our next test switches from sequential to random 2MB transfers.
We start to see some reduction in both read and write speed, although this is a given for most drives. The RAID5 array leveled off at 478MB/s read and 320MB/s write while the RAID1 configuration measured 232MB/s read and 187MB/s write.
Our next test looks at random 4K read and write performance, where a single SSD 710 measured 3,727 IOPS read and 13,269 IOPS write in our previous review.
Working through a RAID array with 128K stripes, neither array performed particularly well in this test. RAID5 speeds measured slightly higher random read speeds at just under 4,100 IOPS, but write speeds dropped to 8,472 IOPS with the performance hit related to the RAID5 parity requirements. RAID1 performance was surprisingly strong measuring 4,036 IOPS read and 14,631 IOPS write.
Given the stronger random 4K write performance of the RAID1 Intel SSD 710 array, it was no surprise to see it posting much lower times in our write latency test.
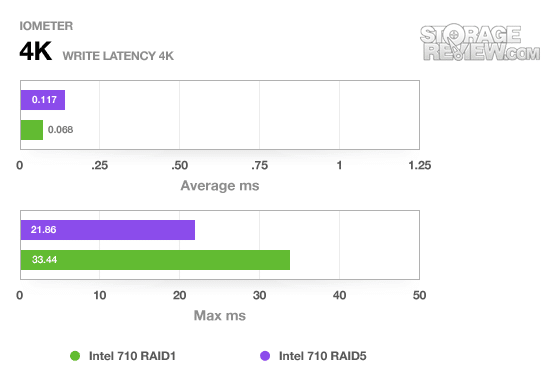
Average write latency is a good indicator of the drive’s responsiveness while peak latency can be an indicator of NAND or controller issues if the values are well outside the norm. On both arrays the average latency spanned between 0.068ms and 0.117ms with max response time measuring 21.86ms for our RAID5 array and 33.44ms on the RAID1 array.
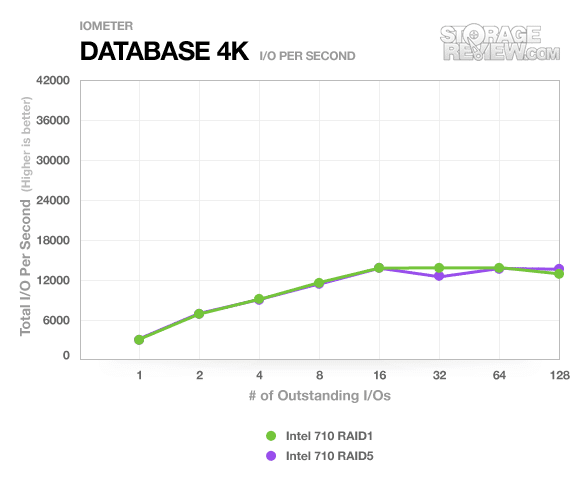
This last series of benchmarks puts the drives through a series of server-style workloads with a queue depth ranging up to 128. As the thread count increases, performance generally increases showing as an improvement reading the chart left to right.
The first is our database profile, with a 67% read and 33% write workload mix primarily centered on 8K transfer sizes.
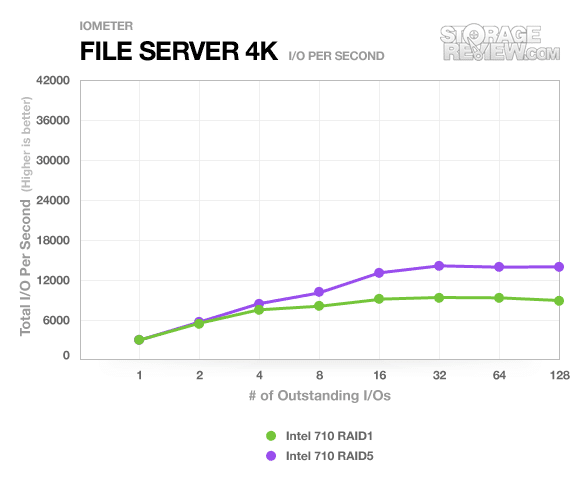
The next profile looks at a file server, with 80% read and 20% write workload spread out over multiple transfer sizes ranging from 512-byte to 64KB.
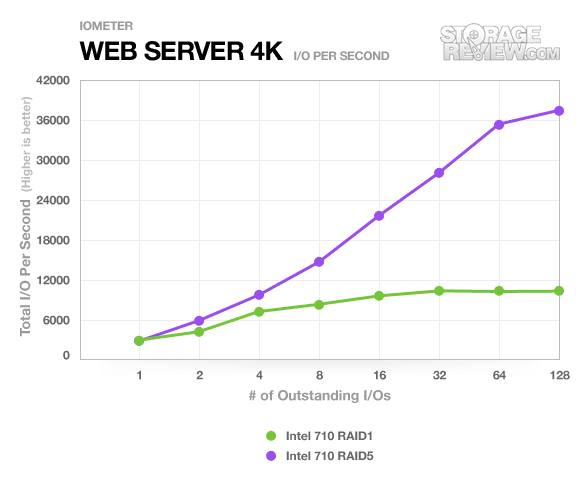
Our webserver profile is read-only with a spread of transfer sizes from 512-byte to 512KB.
The last profile looks at a workstation, with a 20% write and 80% read mix around 8K transfers.
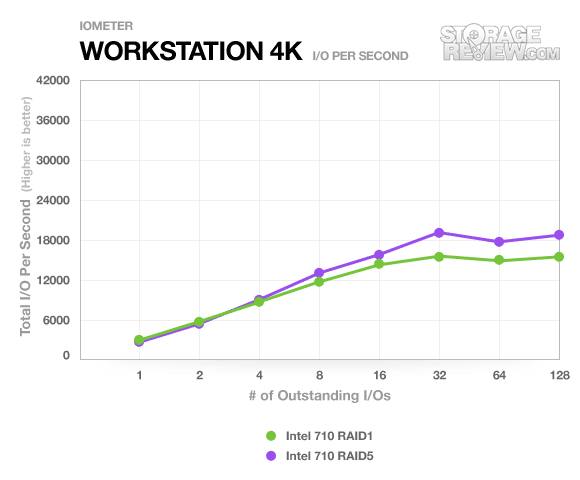
Both RAID1 and RAID5 performance was similar when it came to a mix of read/write transfers, but when it was primarily read-only the RAID5 array really took off at the higher queue depths.
Enterprise Benchmarks
One of the biggest topics that come up when flash media reviewing standards come up is flash media needs to be tested in a different manner than standard platter drives. Flash performance changes the longer you write to a drive and speeds slowly taper down until the drive hits its steady state speed. In an enterprise setting, seeing a burst or sustained speed is worthless if after 1 hour of use the drive is no longer getting that speed. this is where steady state benchmarking comes in, showing how the drive really performs when it is under a 24/7 load.
We compare the Intel SSD 710 up against the Micron P300 in both stock configurations as well as its customizable over-provisioned state. For this we stuck with 200GB (0%) and 160GB (20%), which the latter increases performance and endurance.
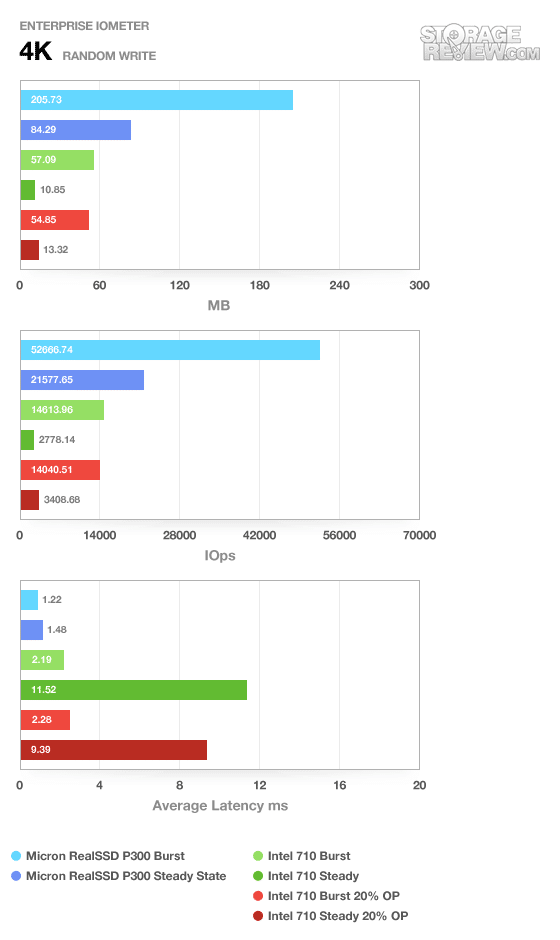
Its a given that any drive put through the steady-state benchmark will have a significant performance drop between before and after. Comparing the consumer-targeted C300 to the enterprise-targeted P300, we notice a 60% drop on the P300 and 94.5% drop on the C300. Clearly the P300 held up better in a 24/7 write environment. The Intel SSD 710 saw an 81% drop in speed, flattening out right at the Intel-provided 2,700 4K random write IOPS figure. With 20% over-provisioning it the speeds dropped 76% to 3,400 IOPS.
Real-World Benchmarks
To really see how drives perform under normal work-loads you need to record the exact traffic being passed to and from the device, and then use that to compare drives against one another. For this reason we turned to our StorageMark 2010 traces, which include consumer traces covering HTPC, productivity, and gaming scenarios and enterprise trace covering a mail-server scenario.
The first real-life test is our HTPC scenario. In this test we include: playing one 720P HD movie in Media Player Classic, one 480P SD movie playing in VLC, three movies downloading simultaneously through iTunes, and one 1080i HDTV stream being recorded through Windows Media Center over a 15 minute period. Higher IOps and MB/s rates with lower latency times are preferred. In this trace we recorded 2,986MB being written to the drive and 1,924MB being read.
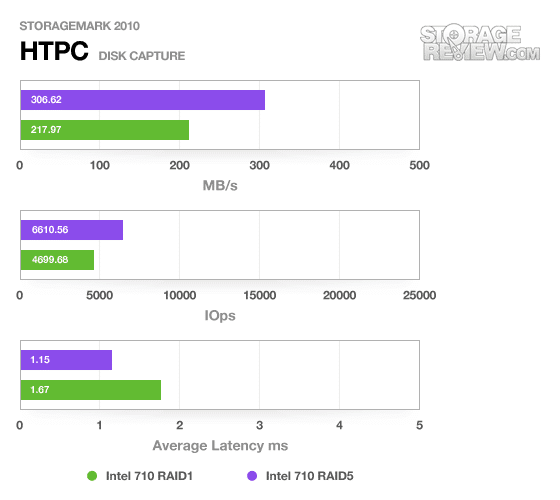
As a baseline, we measured an average transfer speed of 206MB/s average with a single Intel SSD 710. The RAID1 array saw small gains scoring 217MB/s with the RAID5 array really winning out with speeds topping 306MB/s.
Our second real-life test covers disk activity in a productivity scenario. For all intents and purposes this test shows drive performance under normal daily activity for most users. This test includes: a three hour period operating in an office productivity environment with 32-bit Vista running Outlook 2007 connected to an Exchange server, web browsing using Chrome and IE8, editing files within Office 2007, viewing PDFs in Adobe Reader, and an hour of local music playback with two hours of additional online music via Pandora. In this trace we recorded 4,830MB being written to the drive and 2,758MB being read.
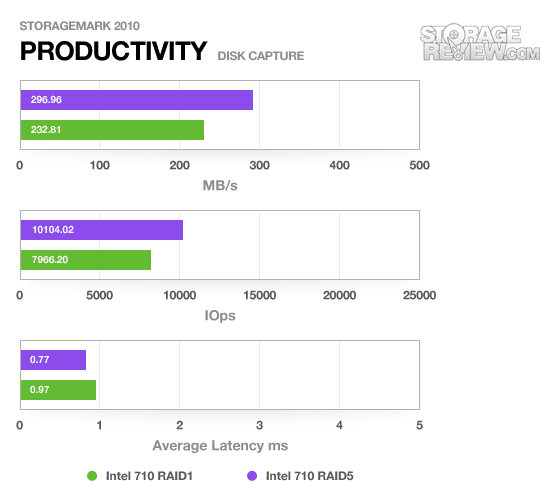
Both RAID1 and RAID5 arrays again scored higher than the single 710, which managed only 223MB/s in this same trace. This compared to 232MB/s from the RAID1 array and 296MB/s from RAID5.
Our third real-life test covers disk activity in a gaming environment. Unlike the HTPC or Productivity trace, this one relies heavily on the read performance of a drive. To give a simple breakdown of read/write percentages, the HTPC test is 64% write, 36% read, the Productivity test is 59% write and 41% read, while the gaming trace is 6% write and 94% read. The test consists of a Windows 7 Ultimate 64-bit system pre-configured with Steam, with Grand Theft Auto 4, Left 4 Dead 2, and Mass Effect 2 already downloaded and installed. The trace captures the heavy read activity of each game loading from the start, as well as textures as the game progresses. In this trace we recorded 426MB being written to the drive and 7,235MB being read.
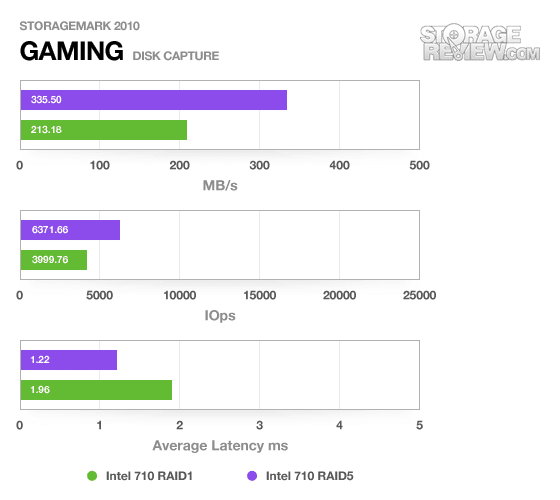
In the read-intensive gaming trace the RAID1 array slipped behind the 243MB/s baseline of the original single SSD 710. The three-drive RAID5 array did manage provide a boost in performance though, going up to 335MB/s average.
Our enterprise trace covers a Microsoft Exchange mail-server environment. We captured the activity of our StorageReview mail server over a period of a few days. This server hardware consists of a Dell PowerEdge 2970 running Windows Server 2003 R2 environment operating off of three 73GB 10k SAS hard drives in RAID5 on the Dell Perc 5/I integrated controller. The trace consists of many small transfer requests, with a strong 95% read load with 5% write traffic.
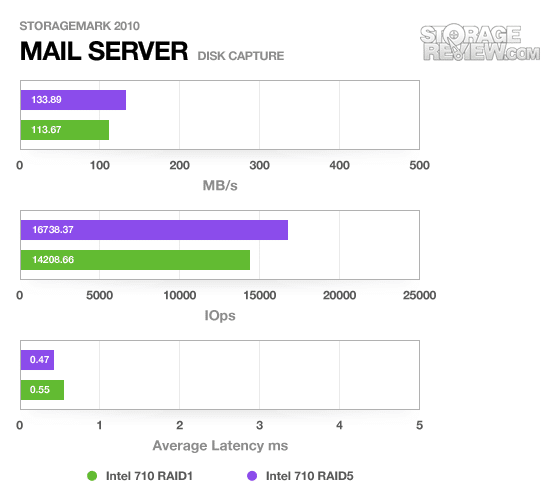
On the mail server trace both RAID1 and RAID5 speeds were very close, measuring 113MB/s and 133MB/s respectively.
Conclusion
Looking at our benchmark results, the Intel SSD 710 proved to be a solid performer with a pedigree of superb SSD endurance and compatibility, two magic words in the enterprise – of course the eMLC helps it hit a third, price point. Starting from the Intel spec sheet, we knew in advance that this SSD wouldn’t be setting any speed records, but instead it would be marching along at a steady pace for years to come with its endurance up to 1.5PB written on the 300GB capacity.
Intel’s published figure of 2,700 4K IOPS random write came up right on the nose in our steady state tests, where we found our particular drive to support 2,778 IOPS actual. Its burst figure was much higher, measuring over 14,000 IOPS, but in a server setting with 24/7 write access, burst speeds mean little once the drive is put to regular use. From the factory, Intel’s 200GB 710 has a over 30% of over-provisioning (200GB available out of 320GB of NAND) but when we tweak it a bit further performance increases. Reducing the available space to 160GB, we see increased steady state performance reaching 3,408 IOPS. This gives the enterprise a good deal of flexibility as they measure the need for capacity vs. performance vs endurance.
Overall the Intel SSD 710 proved to be versatile in a number of RAID configurations and had plenty of customizations to optimize the drive to a given setting. While its not the fastest drive on the block, it does offer an excellent mix of reasonable performance with great endurance, price per GB, and a proven chipset seen in countless numbers of SSDs sold over the past few years. For enterprise environments that demand reliable performance from an SSD, the Intel SSD 710 fits the bill with capacities now up to 300GB.
Discuss This Review


 Amazon