

Launched back in early 2015, the Intel DC S3610 Series is a line of SATA 6Gb/s SSDs intended for applications such as virtualization and e-commerce. These SSDs are equipped with 20nm Intel NAND Flash Memory technology designed and offer a blend of endurance and performance. Intel quotes the DC S3610 with sequential read and write speeds up to 550MB/s and 520 MB/s, and random 4k speeds up to 84,000 OPS and 28,000 IOPS for reads and writes, respectively. Intel also claims a Quality of Service of 500 μs for random 4KB reads measured at a queue depth of 1.
Backed by a 5-year warranty, the DC S3610 Series is available in a wide range of capacities: 100GB, 200GB, 400GB, 480GB, 800GB, 1.2TB and 1.6TB.
Intel DC S3610 Series Specifications
- Capacities: 1.2 TB
- Form Factor: 2.5" 7mm
- Interface: SATA 3.0 6Gb/S
- Performance
- Sequential Read (up to): 550 MB/s
- Sequential Write (up to): 500 MB/s
- Random Read (100% Span): 84000 IOPS
- Random Write (100% Span): 28000 IOPS
- Latency – Read: 55 µs
- Latency – Write: 66 µs
- Power
- Power – Active: 6.4 W
- Power – Idle: 0.6 W
- Reliability
- Vibration – Operating: 2.17 GRMS (5-700Hz)
- Vibration – Non-Operating: 3.13 GRMS (5-800Hz)
- Shock (Operating and Non-Operating): 1,000 G/0.5 ms
- Operating Temperature Range: 0°C to 70°C
- Mean Time Between Failures (MTBF): 2000000
- Uncorrectable Bit Error Rate (UBER): 1 sector per 10^17 bits read
- Weight: 94 grams +-2 grams
- Warranty Period: 5 years
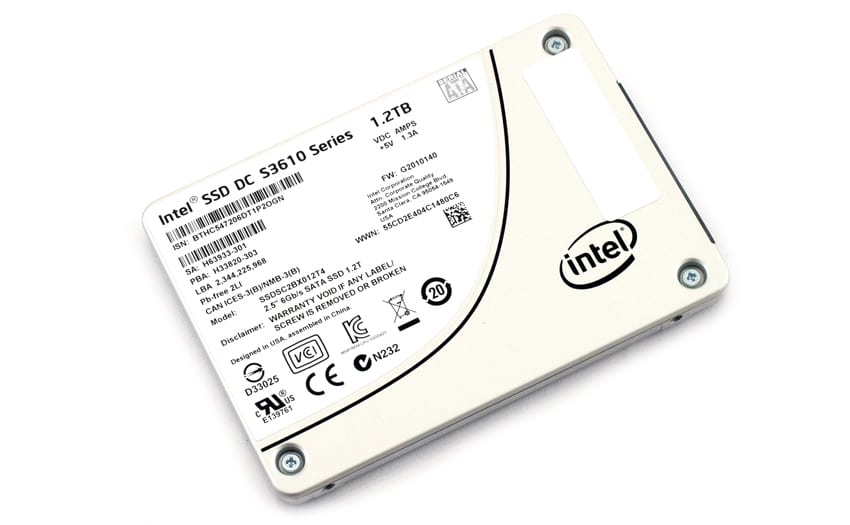
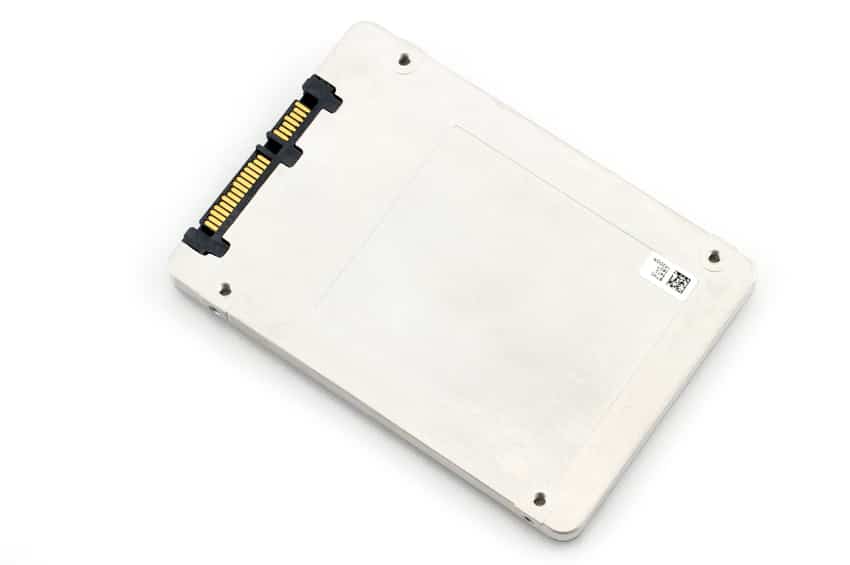
Design and build
The 1.2GB Intel DC S3610 is a 2.5" 7mm form factor SSD and can fit in most storage arrays. The drive’s enclosure is a nice metallic design with an Intel logo at the bottom right corner.
The 200GB, 400GB, and 800GB capacities are available in a 1.8-inch form factor.
Application Workload Analysis
In order to understand the performance characteristics of enterprise storage devices, it is essential to model the infrastructure and the application workloads found in live production environments. Our first benchmarks for the Seagate 1200.2 SAS 3.84TB are therefore the MySQL OLTP performance via SysBench and Microsoft SQL Server OLTP performance with a simulated TCP-C workload. For our application workloads, each drive will be running 2-4 identically configured VMs.
SQL Server Performance
Each SQL Server VM is configured with two vDisks: 100GB volume for boot and a 500GB volume for the database and log files. From a system resource perspective, we configured each VM with 16 vCPUs, 64GB of DRAM and leveraged the LSI Logic SAS SCSI controller. While our Sysbench workloads tested previously saturated the platform in both storage I/O and capacity, the SQL test is looking for latency performance.
This test uses SQL Server 2014 running on Windows Server 2012 R2 guest VMs, being stressed by Quest's Benchmark Factory for Databases. StorageReview’s Microsoft SQL Server OLTP testing protocol employs the current draft of the Transaction Processing Performance Council’s Benchmark C (TPC-C), an online transaction-processing benchmark that simulates the activities found in complex application environments. The TPC-C benchmark comes closer than synthetic performance benchmarks to gauging the performance strengths and bottlenecks of storage infrastructure in database environments. Each instance of our SQL Server VM for this review uses a 333GB (1,500 scale) SQL Server database and measures the transactional performance and latency under a load of 15,000 virtual users.
SQL Server Testing Configuration (per VM)
- Windows Server 2012 R2
- Storage Footprint: 600GB allocated, 500GB used
- SQL Server 2014
- Database Size: 1,500 scale
- Virtual Client Load: 15,000
- RAM Buffer: 48GB
- Test Length: 3 hours
- 2.5 hours preconditioning
- 30 minutes sample period
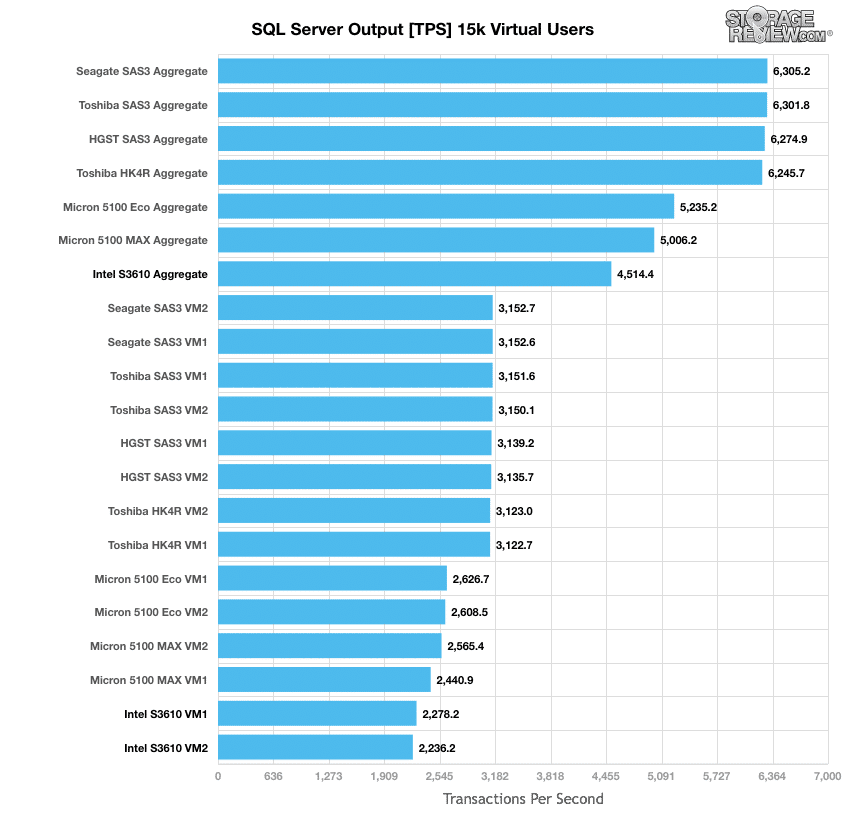
When looking at SQL Server Output, the Intel drive hit an aggregate TPS of 4,514.39 with individual VMs ranging from 2,236.2 TPS to 2,278.19 TPS. This places the S3610 in last place among the tested drives, which was expected.
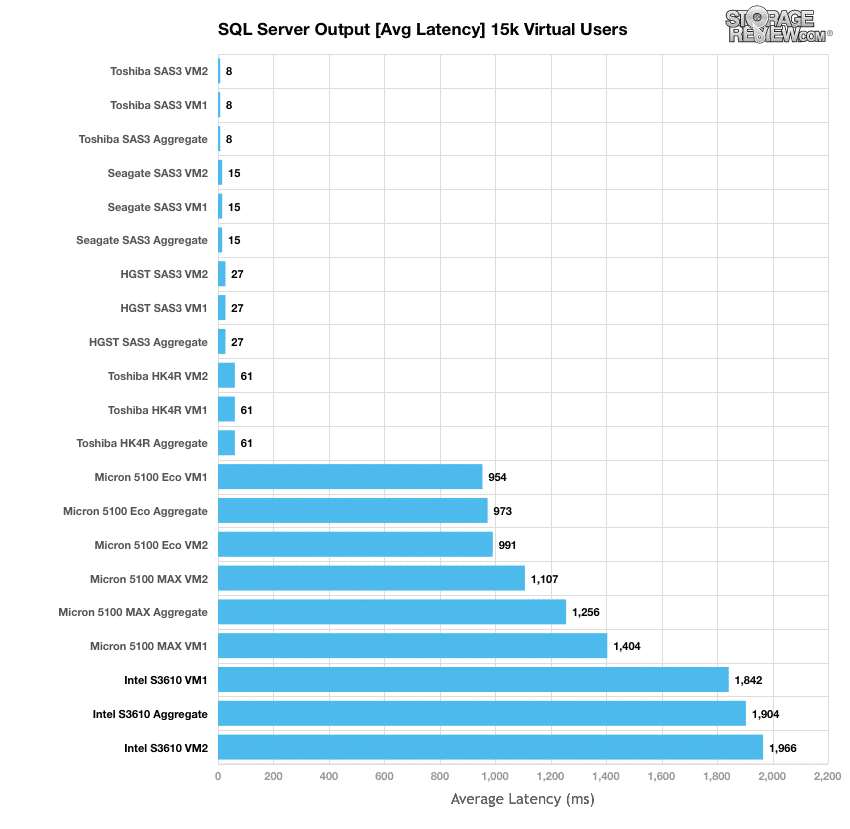
In average latency, the Intel S3610 again placed at the bottom of the pack with individual VMs placing as high as 1,905ms with an aggregate score of 1,966ms. These are a far cry away from the leading Toshiba drive.
Sysbench Performance
The next application benchmark consists of a Percona MySQL OLTP database measured via SysBench. This test measures average TPS (Transactions Per Second), average latency, and average 99th percentile latency as well.
Each Sysbench VM is configured with three vDisks: one for boot (~92GB), one with the pre-built database (~447GB), and the third for the database under test (270GB). From a system resource perspective, we configured each VM with 16 vCPUs, 60GB of DRAM and leveraged the LSI Logic SAS SCSI controller.
Sysbench Testing Configuration (per VM)
- CentOS 6.3 64-bit
- Percona XtraDB 5.5.30-rel30.1
- Database Tables: 100
- Database Size: 10,000,000
- Database Threads: 32
- RAM Buffer: 24GB
- Test Length: 3 hours
- 2 hours preconditioning 32 threads
- 1 hour 32 threads
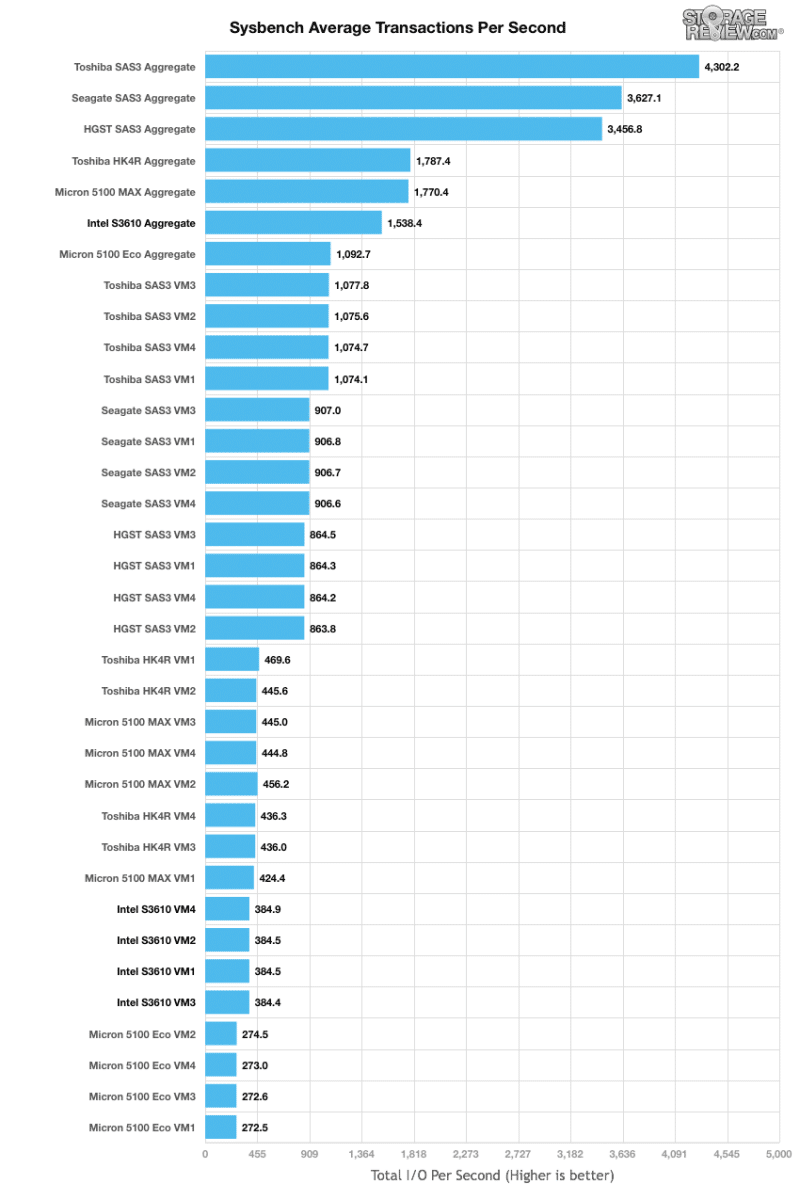
In the average transactions-per-second benchmark, the Intel boasted a VM range of 383.43 TPS (VM3) to 384/95 (VM4) with an aggregate of 1,538.37 TPS, which placed it at the bottom of the pack but noticeably better than the Micron 5100 Eco drive (1,092.65 TPS in aggregate).
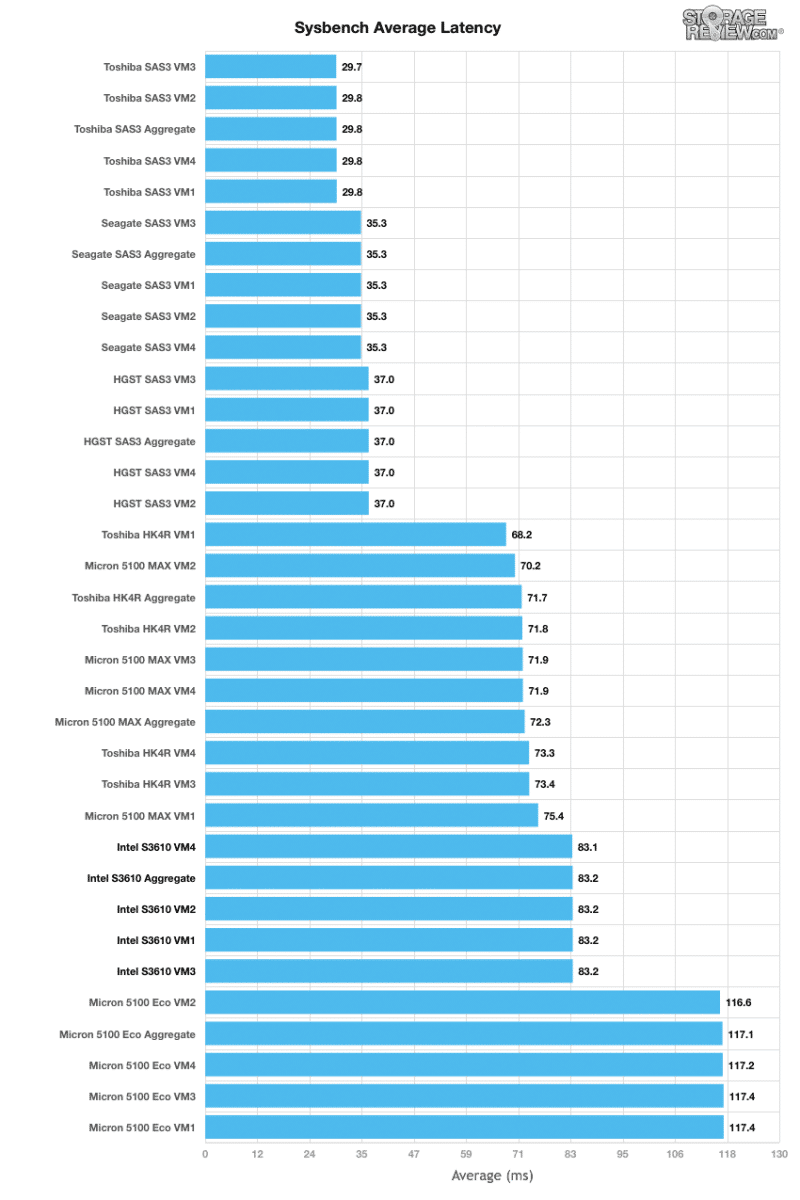
Looking at average Sysbench VM latency, we measured individual VMs between 83.13ms to 83.24ms with an aggregate of 83.205ms, which placed it once again only better than the Micron 5100 Eco.
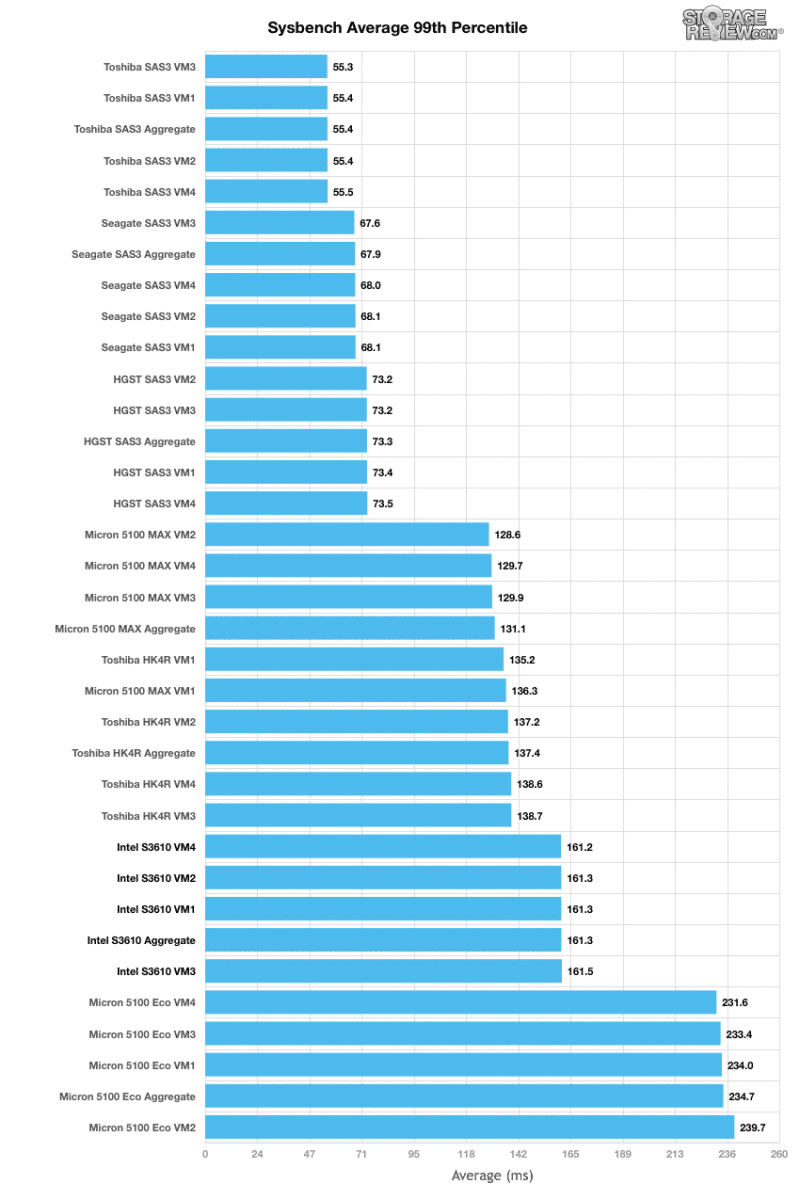
In terms of our worst-case MySQL latency scenario (99th percentile latency), the Intel S3610 placed posted individual VMs ranging from 161.2ms to 161.54ms with an aggregate score of 161.335ms.
Enterprise Synthetic Workload Analysis
Flash performance varies as the drive becomes conditioned to its workload, meaning that flash storage must be preconditioned before each of the fio synthetic benchmarks in order to ensure that the benchmarks are accurate. Each of the comparable drives are preconditioned into steady-state with a heavy load of 16 threads and an outstanding queue of 16 per thread.
Preconditioning and Primary Steady-State Tests:
- Throughput (Read+Write IOPS Aggregate)
- Average Latency (Read+Write Latency Averaged Together)
- Max Latency (Peak Read or Write Latency)
- Latency Standard Deviation (Read+Write Standard Deviation Averaged Together)
Once preconditioning is complete, each device is then tested in intervals across multiple thread/queue depth profiles to show performance under light and heavy usage. Our synthetic workload analysis for the RI SATA SSDs focuses on one profile, our 8K 70/30 mixed random workload It is important to take into consideration that synthetic workloads will never 100% represent the activity seen in production workloads, and in some ways inaccurately portray a drive in scenarios that wouldn't occur in the real world.
- 8k
- 70% Read/30% Write
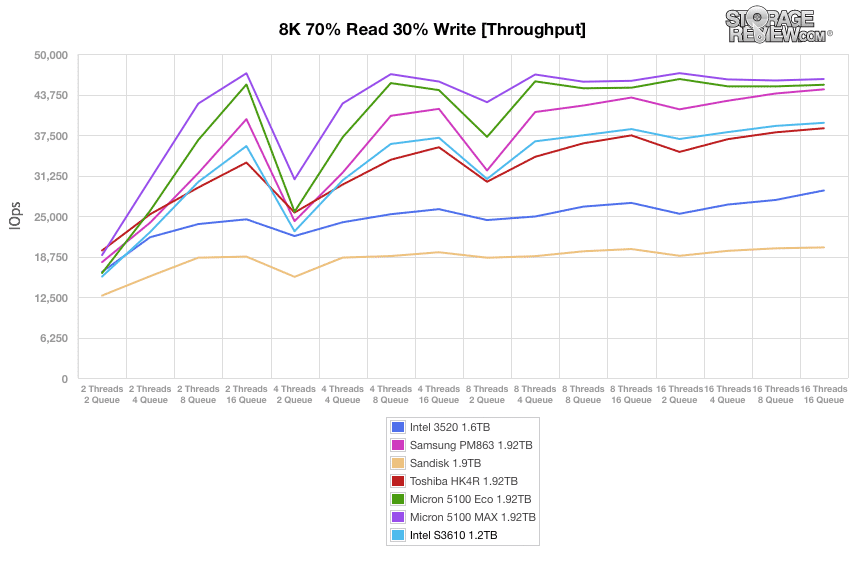
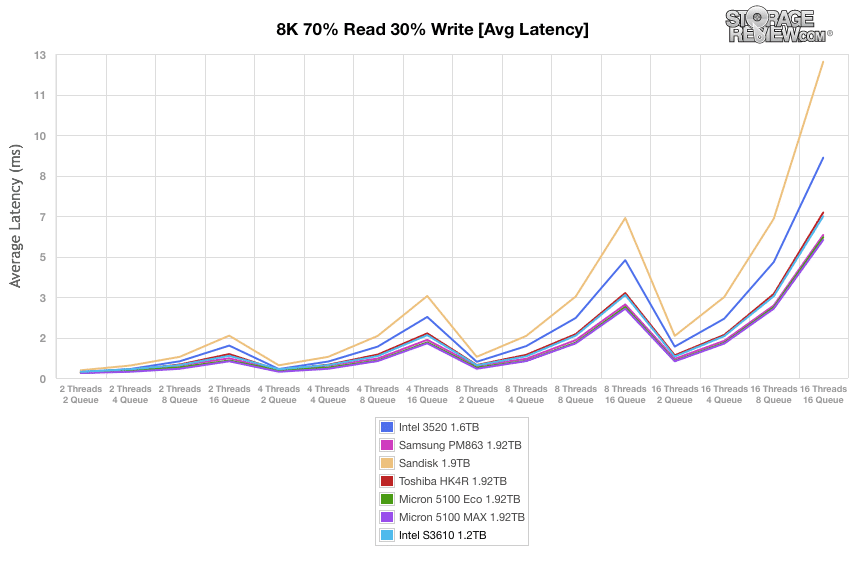
Our 8k benchmark uses a ratio of 70% read operations and 30% write operations. During our throughput test, the Intel S3610 peaked at 39,38 IOPS (in the terminal queue depths), which placed it in the middle of the leaderboard.
Looking at average latency, the Intel S3610 found itself in the middle of the pack again with a range of 0.25ms (2 Threads 2 Queue) to 6.49ms (16 Threads 16 Queue).
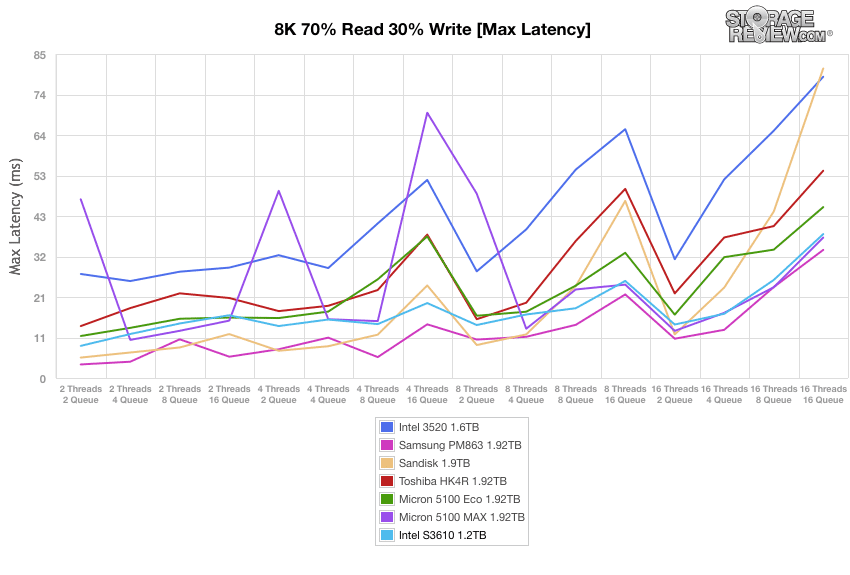
Moving to max latency, the Intel S3610 showed a solid range of 8.43ms through 37.76ms, placing it third among the tested drives. The most stable SSD tested was the Samsung PM863.
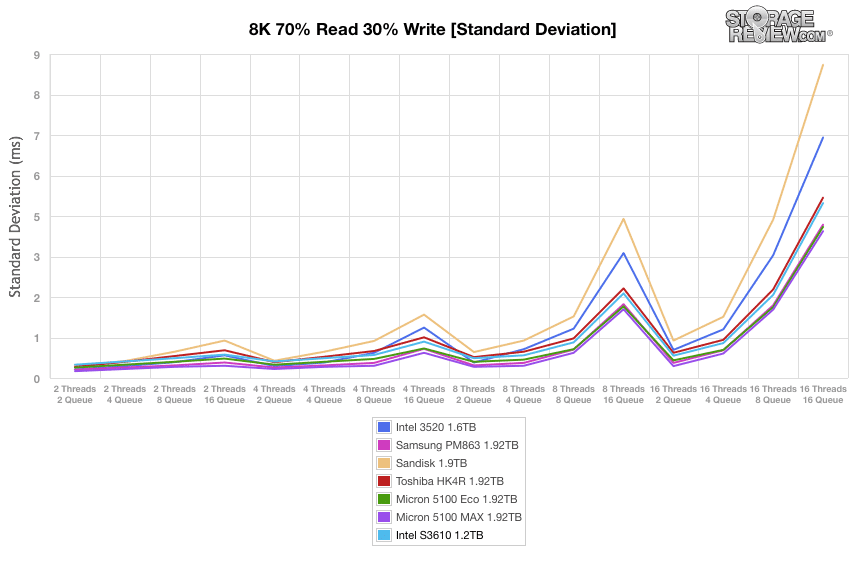
When looking at standard deviation, the Intel S3610 continued its mid-range performance run with 0.37ms (at 2 Threads 2 Queue) and ending with 4.86ms in the terminal.
Conclusion
The Intel S3610 is a power-conscious SSD line that, like all enterprise drives, offers numerous reliability features such as built-in AES-256 bit encryption, enhanced power-loss and end-to-end data protection, thermal throttling and temperature Sensors.
Though the Intel S3610 is one of the older enterprise SATA SSD lines out there, it certainly held its ground in some of our workload benchmarks. Only looking at 8k 70/30, we saw the S3610 with upper mid-range performance in throughput, latency, and standard deviation, the former which boasted a respectable peak of 39,381 IOPS. When looking at our application workloads, however, the Intel drive placed well behind the other tested drives in most of our tests.
Another element that hasn’t quite held up to modern storage demands is its capacity sizes, as it offers 10 models ranging from just 100GB to 1.6TB. With a hefty price tag of $1,200 for the highest model, its priced above other comparable models which have been introduced at lower price points.
Pros
- Decent synthetic workload performance
- Good reliability features
Cons
- Poor application performance
- Small capacities
The Bottom Line
The Intel S3610 certainly shows its age in certain areas, though it does handle itself well at low queue depths and offers low peak latency under stress.


 Amazon